
Africa Data Center Networking Market Size and Share
Market Overview
| Study Period | 2020 - 2031 |
|---|---|
| Forecast Data Period | 2026 - 2031 |
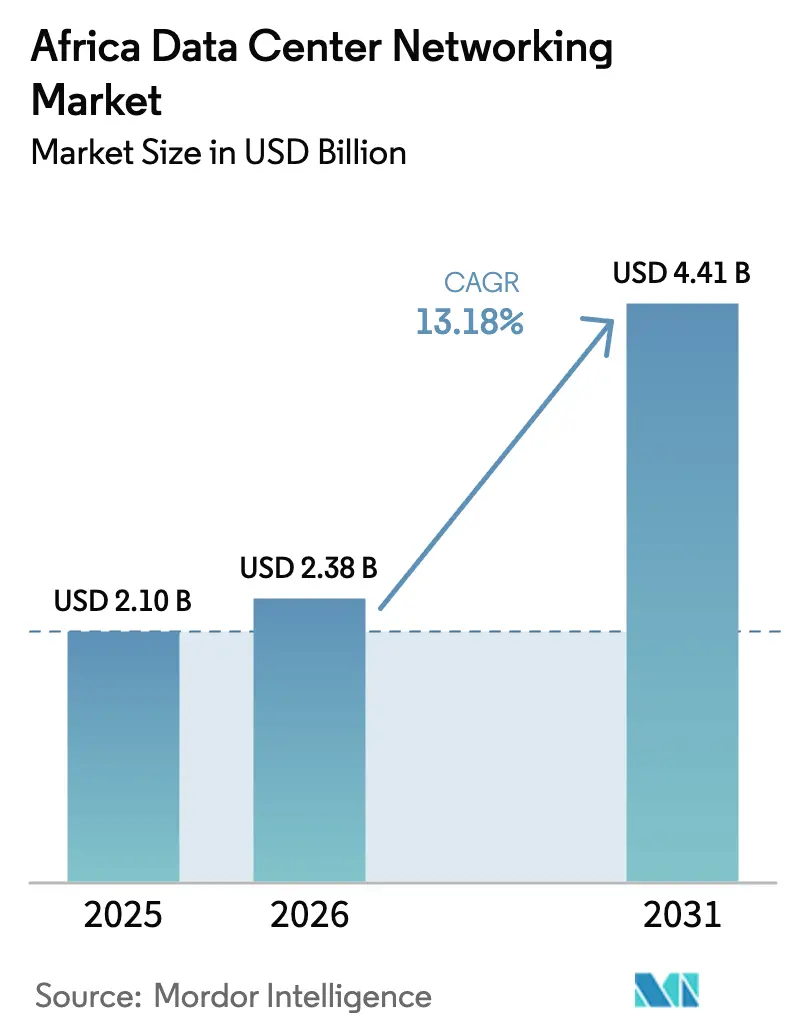
| Base Year Market Size (2025) | USD 2.1 Billion |
| Market Size (2026) | USD 2.38 Billion |
| Market Size (2031) | USD 4.41 Billion |
| Growth Rate (2026 - 2031) | 13.18 % |
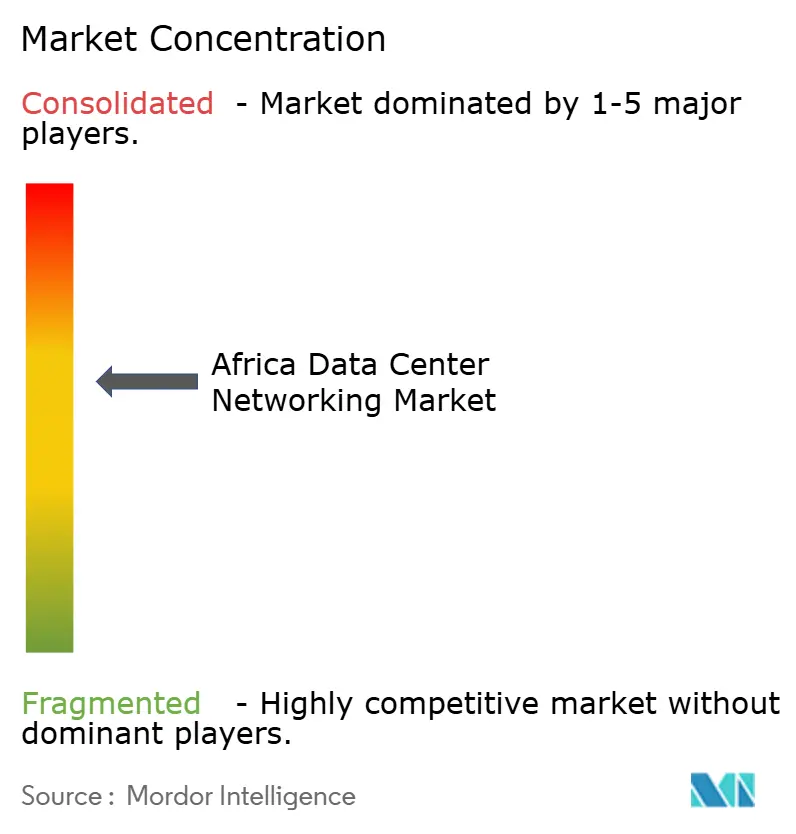
| Market Concentration | Medium |
Major Players *Disclaimer: Major Players sorted in no particular order Image © Mordor Intelligence. Reuse requires attribution under CC BY 4.0. | |
Africa Data Center Networking Market Analysis by Mordor Intelligence
The Africa data center networking market size is expected to grow from USD 2.1 billion in 2025 to USD 2.38 billion in 2026 and is forecast to reach USD 4.41 billion by 2031 at 13.18% CAGR over 2026-2031. Continuous cloud region launches, AI workload demands, and national data-sovereignty rules are the main catalysts behind this vigorous trajectory. Extensive subsea-cable projects deliver fresh international bandwidth that feeds hyperscaler entry, while local carriers and colocation operators upgrade switching fabrics to 50-100 GbE architectures to cope with rising east-west traffic. Government incentives, especially in South Africa, Nigeria, Kenya, and Egypt, steer investments toward sustainable designs that blend renewable power with liquid-cooling topologies. At the same time, widespread adoption of white-box hardware trims capital outlays by up to 70%, giving domestic integrators room to compete with global brands. Skills shortages, power-grid instability, and complex import duties persist as restraining factors, yet they are spurring demand for managed services and modular micro-sites that tolerate volatile utility conditions.
Key Report Takeaways
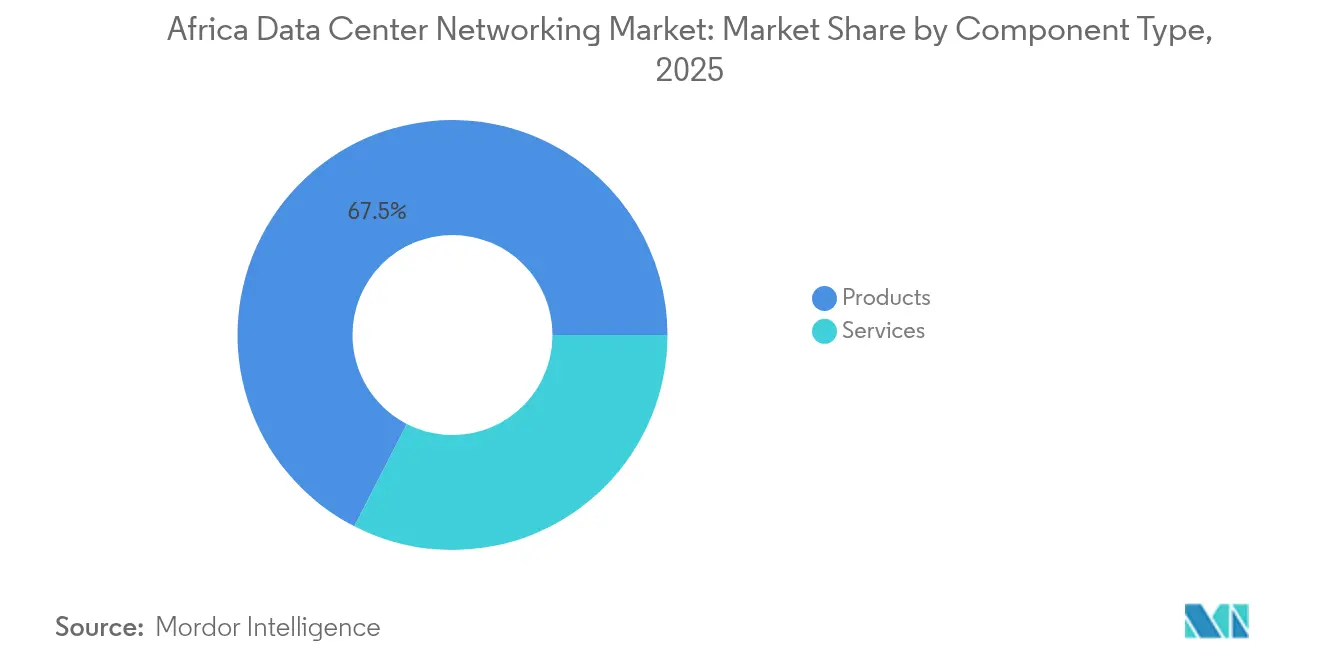
- By component, products led with 67.45% of the Africa data center networking market share in 2025, while services are projected to expand at a 14.08% CAGR to 2031.
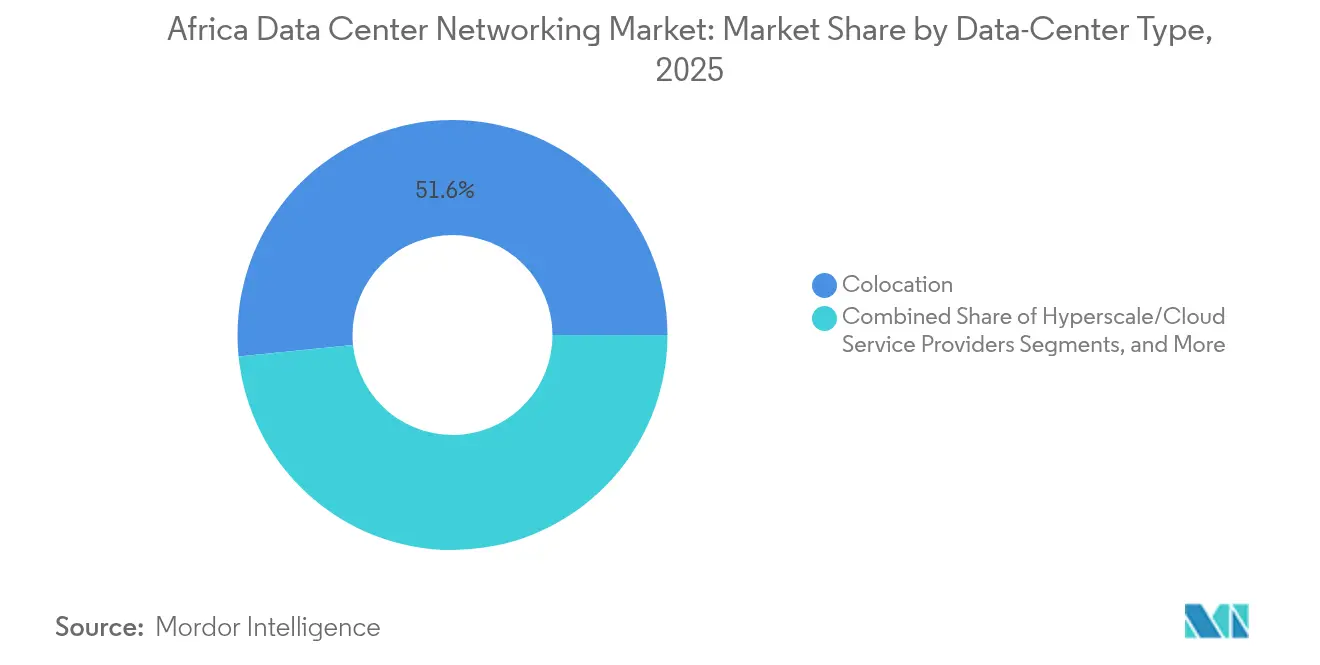
- By data-center type, colocation held 51.60% of the Africa data center networking market share in 2025; hyperscalers are set to grow at a 15.02% CAGR through 2031.
- By bandwidth, 50-100 GbE accounted for 37.55% share of the Africa data center networking market size in 2025, and >100 GbE is advancing at a 15.92% CAGR to 2031.
- By end-user, IT and telecommunications captured 32.65% share of the Africa data center networking market size in 2025, while government and defense are posting the fastest 14.72% CAGR to 2031.
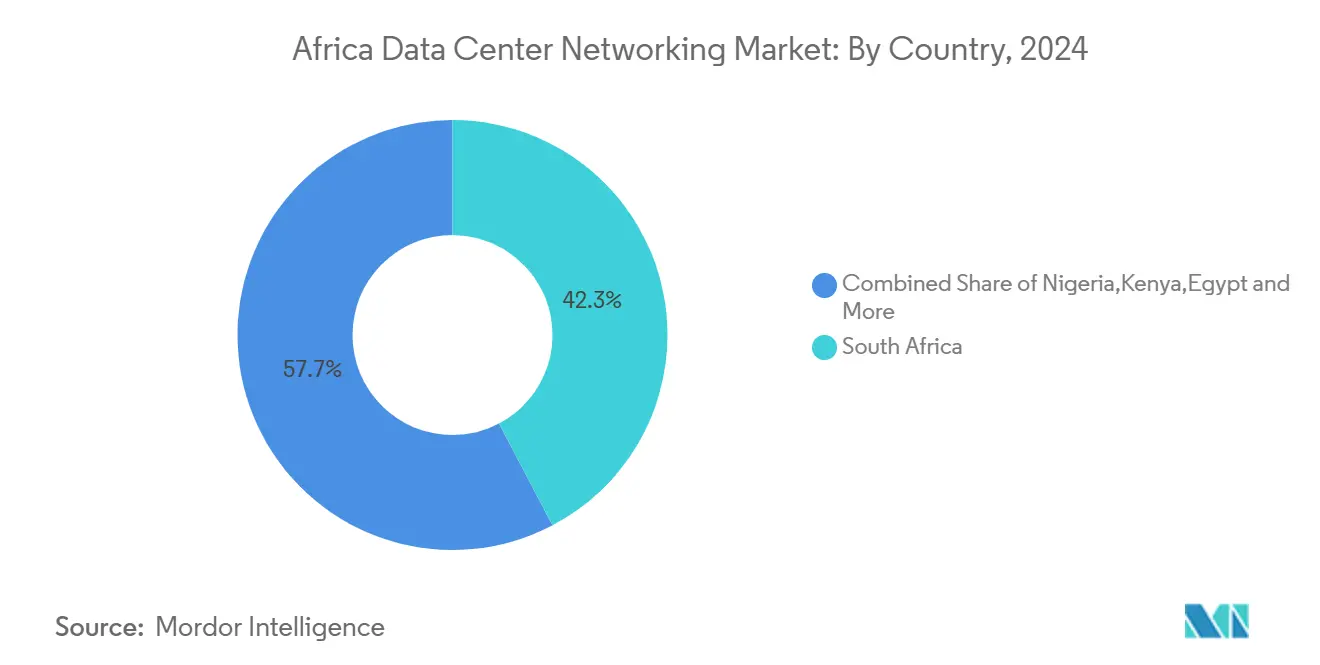
- By geography, South Africa commanded 41.85% of the Africa data center networking market share in 2025; Kenya is on track for the strongest 13.76% CAGR through 2031.
Note: Market size and forecast figures in this report are generated using Mordor Intelligence’s proprietary estimation framework, updated with the latest available data and insights as of 2026.
Market Trends and Insights
Drivers Impact Analysis of Africa Data Center Networking Market*
| Driver | (~) % Impact on CAGR Forecast | Geographic Relevance | Impact Timeline |
|---|---|---|---|
| Rapid expansion of hyperscale and cloud deployments | +2.8% | South Africa, Nigeria, Kenya | Medium term (2-4 years) |
| Rising cyber-attack surface and compliance mandates | +1.9% | South Africa, Nigeria | Short term (≤ 2 years) |
| Surge in mobile data traffic and OTT content | +2.1% | Nigeria, Kenya, Egypt | Medium term (2-4 years) |
| Government-backed national data-residency policies | +1.7% | Morocco, South Africa, Nigeria | Long term (≥ 4 years) |
| Sub-sea cable landings enabling low-latency peering | +1.4% | West and East African coastal regions | Medium term (2-4 years) |
| Adoption of white-box/open networking to cut TCO | +1.6% | Cost-sensitive markets across Sub-Saharan Africa | Short term (≤ 2 years) |
| Source: Mordor Intelligence | |||
Rapid Expansion of Hyperscale and Cloud Deployments
Hyperscalers are reshaping the Africa data center networking market as Microsoft, Google, and Amazon Web Services commit fresh capital for sovereign cloud zones. Microsoft’s USD 298 million South African program delivers AI-ready fabrics built around 25 GbE leaf and 100 GbE spine layers that support large-language-model training. Google’s Johannesburg cloud region, live since early 2024, shows latency reductions of 80 milliseconds compared with Amsterdam routes, prompting regional SaaS firms to migrate workloads. Each new cloud availability zone triggers parallel investments in carrier-neutral meet-me rooms, dark-fiber routes, and open-bridged 400G optical uplinks that feed the new campuses. In Senegal, AWS partners with Sonatel to deliver sub-5 millisecond services for fintech workloads, underlining how sovereign cloud regions spur a multiplier effect on switching, routing, and interconnection spending.[1]Ecofin Agency, “AWS Partners with Sonatel for Senegal Cloud Zone,” ecofinagency.com
Rising Cyber-Attack Surface and Compliance Mandates
Tighter privacy statutes increase capital allocation toward secure switching fabrics and micro-segmented leaf layers. South Africa’s POPIA forces enterprises to deploy next-generation firewalls, zero-trust overlays, and telemetry-rich routers able to export flow data for audit trails.[2]Baker McKenzie, “South Africa National Data and Cloud Policy,” bakermckenzie.comBanks in Nigeria and South Africa are early adopters of secure SD-WAN, illustrated by African Bank’s Fortinet rollout that halved WAN expense while meeting PCI DSS rules. Compliance extends beyond finance as healthcare and public-sector clouds must maintain encrypted east-west pathways and demonstrate deterministic data-residency enforcement. Demand therefore migrates toward intent-based fabrics with embedded crypto engines and AI-driven anomaly detection that shortens mean-time-to-detect from hours to minutes.
Surge in Mobile Data Traffic and OTT Content
Sub-Saharan broadband users doubled between 2019 and 2023, forcing carriers to backhaul petabytes of video and gaming traffic through coastal landing stations[3]Baker McKenzie, “South Africa National Data and Cloud Policy,” bakermckenzie.com. The 2Africa cable introduces 180 Tbit/s of design capacity that plugs directly into new Egyptian and Kenyan carrier-hotels, accelerating orders for 50/100 GbE top-of-rack switches in peering rooms. Google’s Equiano cable has already cut consumer broadband prices by 14% in Togo and doubled average speeds, proving that fresh subsea supply converts rapidly into data-center port demand. Operators now interconnect with content platforms through Ethernet virtual-private networks that offload 40% of video streams onto local caches, trimming international transit costs and enhancing user experience.
Government-Backed National Data-Residency Policies
Localisation rules continue to anchor traffic within borders, effectively guaranteeing baseline demand for switching gear, firewalls, and intelligent load balancers. South Africa’s National Data and Cloud Policy obliges agencies to host sensitive workloads on in-country systems that pass FIPS-valid encryption standards. Niger’s USD 14.3 million Tier III public datacenter and Morocco’s Digital Morocco 2030 plan illustrate how public funding catalyses private co-investment. Sovereignty requirements also influence topology, steering networks toward geo-redundant metro clusters rather than offshore replication targets, which intensifies purchase volumes for dual-core routers, cross-metro DWDM links, and synchronous replication fabrics.
Restraints Impact Analysis of Africa Data Center Networking Market*
| Restraint | (~) % Impact on CAGR Forecast | Geographic Relevance | Impact Timeline |
|---|---|---|---|
| Escalating network complexity in multi-cloud fabric | -1.2% | Large enterprises across Africa | Medium term (2-4 years) |
| Scarcity of skilled DC networking professionals | -1.8% | Sub-Saharan Africa | Long term (≥ 4 years) |
| Power-grid instability affecting facility uptime | -1.3% | Nigeria, Kenya, Ghana, parts of Southern Africa | Short term (≤ 2 years) |
| Import-tariff complexities inflating hardware costs | -1.0% | Economies with high customs duties (e.g., Nigeria, Tanzania) | Medium term (2-4 years) |
| Source: Mordor Intelligence | |||
Escalating Network Complexity in Multi-Cloud Fabric
African enterprises adopting multi-cloud strategies face inconsistent performance, tool sprawl, and higher operational costs. A South African retail bank needed five different control planes to secure traffic across two local clouds and one European zone, resulting in configuration drift and extended change windows. Limited in-house expertise pushes organisations toward managed overlay networks that raise opex even while solving skill gaps. The situation delays the adoption of software-defined fabrics and stalls the migration of latency-sensitive apps such as digital trading platforms.
Scarcity of Skilled DC Networking Professionals
Demand for CCIE-, JNCIE-, and HCIE-level engineers far exceeds supply. Across the region, fewer than 4,000 professionals possess hands-on experience with large-scale leaf-spine deployments, according to African Union digital-skills data. This deficit forces many projects to import contractors from Europe or the Middle East, adding 12–20% to overall project cost and extending roll-out schedules. The talent shortfall particularly hampers white-box switching adoption because those platforms depend on Linux command-line fluency and DevOps tooling unfamiliar to most local engineers.
*Our forecasts treat driver/restraint impacts as directional, not additive. The impact forecasts reflect baseline growth, mix effects, and variable interactions.
Africa Data Center Networking Market Segment Analysis
By Component:
Products Dominate Despite Services AccelerationProducts retained 67.45% of the Africa data center networking market share in 2025, as every facility still requires a baseline of physical switches, routers, and optical transport gear. Ethernet switches remain the largest revenue contributor because leaf-spine designs rely on high-port-density TOR units coupled with low-latency spine blocks. Routing continues to find purchase within campus cores, internet gateways, and data-center interconnects that link metro nodes to subsea landing stations. Security appliances and ADCs are gaining momentum as zero-trust and SSL offload proliferate.
Services are scaling faster at a 14.08% CAGR through 2031 as enterprises aim to bridge operational skill deficiencies. Installation and integration engagements are the first port of call for hyperscaler newcomers that want assured time-to-market. Managed network services deliver continuous operations support, freeing local IT teams to focus on application enablement. Training and consulting lines are growing because large multinationals attempt to build regional centres of excellence that can eventually own leaf-spine operations internally. Support and maintenance revenues likewise climb as SLA-sensitive sectors such as finance and healthcare demand four-nines uptime.



By End-User:
IT and Telecommunications Lead, Government AcceleratesIT and telecommunications players accounted for 32.65% of the Africa data center networking market size in 2025 as they deploy dense fabrics to host customer VMs, OTT caches, and 5G core functions. Telcos are refreshing edge aggregation sites from 10 GbE to 25 GbE in preparation for ultra-reliable low-latency traffic while also investing in segment routing to control inter-city paths. Cloud-native ISPs embrace white-box units running SONiC, which lowers capital spending by 40% relative to branded stacks and shortens lead times amid global supply constraints.
Government and defence workloads exhibit the swiftest growth at 14.72% CAGR. National clouds, e-health repositories, and smart-city telemetry demand encrypted 100 GbE links across redundant availability zones. Ministries adopt private access service edges that place inspection functions inside the core rather than at the perimeter, which changes traffic flow patterns and increases east-west bandwidth needs. Defence agencies also prioritise on-premise AI inference to analyse drone footage, thereby driving requests for GPU-aware network topologies.
By Data-Center Type:
Colocation Dominates, Hyperscalers SurgeColocation facilities represented 51.60% of Africa data center networking market share in 2025, reflecting the strong preference for opex models that avoid large upfront capital commitments. Neutral sites such as Teraco Johannesburg enable enterprises to reach multiple subsea cables and cloud on-ramps through a single cross-connect, which lowers latency and simplifies redundancy planning. Dense cross-connect fabrics require high-availability spine layers with dual supervisors and real-time telemetry to track port-to-port performance.
Hyperscalers are the fastest-growing category at 15.02% CAGR as Microsoft, Google, and Oracle continue their multi-billion-dollar buildouts. Their campuses opt for 100 GbE and 400 GbE optical uplinks wired in Clos-4 topologies optimised for AI clusters. Procurement teams tend to select merchant-silicon switches in fixed 32-port form factors, which accelerates port rollout and aligns with the hyperscaler philosophy of horizontal scale. The hyperscaler wave is also elevating demand for campus dark-fiber routes because organisations require diverse paths to ensure sub-5-millisecond round-trip times between metros.
By Bandwidth:
50-100 GbE Leads, Greater than 100 GbE Accelerates50-100 GbE links held 37.55% share of the Africa data center networking market size in 2025. This sweet-spot range offers a cost-performance balance for mixed workloads ranging from virtual desktop infrastructure to basic AI inference. Enterprises upgrading from 10 GbE find that 25 GbE disassembled breakout features allow gradual migration without forklift replacements.
Bandwidth above 100 GbE will rise at a 15.92% CAGR through 2031, driven by AI training farms, real-time analytics, and latency-sensitive fintech services. Afrihost’s Mellanox-based network delivers 400G uplinks across metro fibre rings, saving 20% on optics thanks to QSFP-DD standardisation. Optical transponder suppliers expect volume shipments of 800G coherent pluggables by 2027, which should usher in spine upgrades that further push the Africa data center networking market adoption of high-speed lanes.
Geography Analysis
South Africa Data Center Networking Market
South Africa maintained 41.85% of the Africa data center networking market share in 2025, thanks to its robust submarine-cable endpoints and mature power grid. International firms favour Johannesburg and Cape Town for primary and disaster-recovery nodes because the two metros already host extensive cloud on-ramps, carrier hotels, and internet exchanges. Government policy reinforces this position, with the Digital Transformation Infrastructure Roadmap promising expedited permits for new data-hall expansions.
Kenya Data Center Networking Market
Kenya is the fastest-growing national market at 13.76% CAGR through 2031. The Microsoft-G42 geothermal campus south of Nairobi improves sustainability metrics and introduces 100 GbE leaf layers pre-wired for 400G spine upgrades. Nairobi’s two new neutral IXPs encourage local content caching, cutting backhaul costs by 35% and boosting demand for TOR switch ports. Kenya’s special economic zone concessions waive import duties on optics and fibre, which improves project IRRs and accelerates new market entrants.
Africa Data Center Networking Market
Nigeria, Egypt, and Morocco round out the second tier of expansion. Lagos-area facilities now connect directly to Equiano and 2Africa, pushing average latency to Western Europe below 120 milliseconds, while Cairo leverages its junction position between Mediterranean and Red Sea routes to attract serving points for North African OTT subscriptions. Morocco’s Digital Morocco 2030 blueprint targets data-center energy intensity under 1.3 PUE by prioritising renewable power purchase agreements, leading to pilot projects with liquid-cooled racks that require specialised manifolded topologies. Elsewhere, emerging hubs such as Dakar and Abidjan rely on Public–Private Partnerships to finance Tier III designs that seed connectivity and gradually grow regional share of the Africa data center networking market.
Regulatory Landscape
Africa data center networking is shaped by regional guidance alongside fast-evolving national privacy and data-sovereignty rules that influence where workloads are hosted and how networks are secured. At the regional level, the African Union Digital Transformation Strategy for Africa (2020-2030) and the African Union Data Policy Framework (endorsed in 2022) offer reference principles for harmonizing data governance and cross-border data flows, and the African Telecommunications Union (ATU) has issued a model framework for data centers and cloud computing services to encourage local capacity development.
At the country level, compliance requirements affect fabric design, encryption, logging, and interconnection decisions. South Africa’s Protection of Personal Information Act (POPIA) has been in force since 2021 and tightens conditions for cross-border transfers, reinforcing preferences for in-country processing in regulated use cases. Kenya’s Office of the Data Protection Commissioner enforces the Data Protection Act (2019), and Nigeria’s Data Protection Act (2023) includes provisions that can require local hosting for specified regulated data categories. Regulatory scope continues to widen, including Botswana’s Data Protection Act 2024 (October 2024), which expanded the mandate of the Information and Data Protection Commission and added clearer controls on cross-border data flows, increasing the need for auditable, policy-driven networking and security controls inside local data centers.
Value Chain Analysis
The value chain starts with upstream silicon, optics, and network operating systems, which feed OEM and white-box switch and router supply. From there, importation, distribution, and integration take place across African markets where customs processes and duties can materially affect landed costs. Global vendors and merchant-silicon ecosystems supply the core switching, routing, and optical interconnect building blocks, while local and regional systems integrators assemble designs into operational leaf-spine fabrics, often refreshed toward 50-100 GbE architectures, and provide testing, staging, and configuration services. As open networking and white-box hardware spread, software selection, automation tooling, and Linux-based operations skills take on a larger role in the deployment chain.
Downstream, colocation operators, telcos, and hyperscalers serve as the main demand centers and increasingly procure end-to-end solutions that bundle networking with power and facility readiness, particularly given grid instability constraints. Energy and physical infrastructure partners are therefore closely tied to networking outcomes, including arrangements that co-locate data centers with dedicated generation, such as the Tetracore project in Nigeria that pairs a Tier III facility with an on-site 100 MW independent power plant. Modular and prefabricated construction also compress build cycles and pull forward demand for pre-engineered network racks, structured cabling, and standardized top-of-rack switching. Managed services providers and OEM channel partners add recurring revenue through operations, security monitoring, spares logistics, and SLA-driven maintenance across distributed sites.
Competitive Landscape
Competition centres on balancing performance, price, and operational simplicity. Cisco, Huawei, and Juniper continue to win complex financial-sector refreshes due to fully-featured operating systems and long support life-cycles, yet their dominance is eroding where cost sensitivity reigns. White-box vendors shipping Broadcom Trident-based fixed switches claim 30–70% capex savings, an advantage that resonates with local ISPs. Mellanox scored several headline deals by bundling Cumulus Linux with 100 GbE TORs, illustrating the appetite for merchant-silicon plus open-source NOS.
Software-defined networking has become a key differentiator. Vendors that embed closed-loop telemetry and offer single-panel orchestration are viewed favourably because many African operators lack large NetOps teams. Security integration is another battleground, with Fortinet and Palo Alto offering fabric-wide micro-segmentation that aligns with POPIA and GDPR equivalency rules. Meanwhile, optical-layer suppliers such as Ciena and Infinera position coherent-plug transponders as an economical method for metro DCI expansion.
Partnership strategies are also shaping standings in the Africa data center networking market. Nokia aligns with Liquid Intelligent Technologies to target pan-regional fibre plus cloud stack bundles, while HPE’s acquisition of Silver Peak gives it an SD-WAN beachhead. Investors such as IDC, IFC, and KKR continue to back neutral facilities, providing follow-on capital that indirectly fuels switching and routing sales. As competitive intensity builds, end-users increasingly weigh vendor ability to supply local spares, deliver 24×7 multilingual support, and train in-house staff, factors that can override headline equipment pricing.
Africa Data Center Networking Industry Leaders
Huawei Technologies Co., Ltd.
Cisco Systems, Inc.
Hewlett Packard Enterprise Company
Arista Networks, Inc.
Juniper Networks, Inc.
- *Disclaimer: Major Players sorted in no particular order
Africa Data Center Networking Market Companies Covered in this Report
- Huawei Technologies Co. Ltd.
- Cisco Systems, Inc.
- F5, Inc.
- H3C Holding Limited
- NEC Corporation
- Juniper Networks, Inc.
- VMware, Inc.
- A10 Networks, Inc.
- Extreme Networks, Inc.
- Dell Technologies Inc.
- Array Networks, Inc.
- Radware Ltd.
- TP-Link Corporation Limited
- Moxa Inc.
- Arista Networks, Inc.
- Hewlett Packard Enterprise Company
- Nokia Corporation
- Ciena Corporation
- Fortinet, Inc.
- Check Point Software Technologies Ltd.

Market Opportunities and Future Outlook
AI-oriented data center builds and upgrades create whitespace for higher-speed switching, liquid-cooled-ready designs, and fabric automation that reduces operational overhead across multi-site environments. A concrete indicator is Huawei’s release of the Northern Africa AIDC Reference Design White Paper in Cairo on April 28, 2026, which targets accelerated AI data center deployment patterns and, by implication, lifts requirements for dense east-west networking, telemetry, and higher-speed optics across new builds and retrofits. On the demand side, national data localization requirements in Kenya, Nigeria, South Africa, and Egypt continue to pull workloads onshore, increasing the number of in-country interconnection points, meet-me rooms, and metro data center interconnect routes that need scalable routing and switching.
Power-constrained deployment environments also support opportunities for integrated networking plus energy-resilience packages, particularly where operators can engineer deterministic performance under unstable utilities. The Nigeria-based Tetracore Energy Group, Huawei, and Inspirive Technologies initiative to develop a 20 MW Tier III data center in Atakobo, Ogun State, supported by an on-site 100 MW power plant and reported at USD 400 million, shows how large projects are being structured around power assurance. This structure supports demand for campus and DCI networking that can be deployed quickly and operated with limited on-site staffing. Separately, telco-grade hybrid power modernization provides a pull-through for edge and micro data center networking: Orange and Huawei have deployed AI-driven solar hybrid solutions (HEHA) across rural African telecom sites with a reported 55% reduction in downtime, reinforcing the value of uptime and remote management in purchasing decisions.
Recent Industry Developments in Africa Data Center Networking Market
- April 2026: Huawei introduced Xinghe AI Fabric 2.0 and announced new CloudEngine data center switches, including 128 x 800GE and liquid-cooled 128 x 400GE models, positioning its portfolio for AI-ready data center fabrics. These launches raise the performance ceiling for African data centers moving beyond 100 GbE and align switching roadmaps with higher-density AI clusters and advanced cooling topologies.
- February 2026: Cisco announced Silicon One G300, a 102.4 Tbps switching silicon designed for AI cluster buildouts and intended to power new Cisco systems in the Nexus 9000 and Cisco 8000 families. The milestone strengthens the supplier pipeline for next-generation spine and DCI platforms, supporting higher-radix designs and improved scale economics for large fabrics deployed by colocation operators and cloud entrants.
- July 2025: NEC XON highlighted readiness to deliver services around the combined HPE Aruba and Juniper Mist portfolios following HPE’s acquisition of Juniper Networks (reported at USD 14 billion). The consolidation expands the set of AI-native networking and automation options available through African channels, influencing enterprise and data center buyers that rely on local integration, lifecycle support, and managed operations.


Africa Data Center Networking Market Report Scope and Research Methodology
Market Definition and Coverage
This market covers networking equipment and related services deployed inside data centers across Africa to connect servers, storage, and external networks, including switching, routing, SAN connectivity, ADC, and SDN control. Revenues are counted at the point these solutions are deployed for data center use.
Scope exclusions: We exclude networking spend intended mainly for office campus or branch LANs, and any consumer-grade networking products.
Segments Covered in This Report
- By Component
- Products
- Ethernet Switches
- Routers
- Storage Area Network (SAN)
- Application Delivery Controllers (ADC)
- Network Security Appliances
- Software-Defined Networking (SDN) Controllers
- Optical Interconnects
- Services
- Installation and Integration
- Training and Consulting
- Support and Maintenance
- Managed Network Services
- Products
- By End-User
- IT and Telecommunications
- Banking, Financial Services and Insurance (BFSI)
- Government and Defense
- Media and Entertainment
- Healthcare and Life Sciences
- Manufacturing and Industrial
- Other End-Users
- By Data-Center Type
- Colocation
- Hyperscalers/Cloud Service Providers
- Edge/Micro Data Centers
- By Bandwidth
- Less Than or equals to 10 GbE
- 25–40 GbE
- 50–100 GbE
- Greater than 100 GbE
- By Country
- South Africa
- Nigeria
- Kenya
- Egypt
- Morocco
- Rest of Africa
Data Sources, Market Sizing, and Validation
Desk Research
Desk work starts by mapping the demand footprint for African data centers, then linking that footprint to networking intensity using bandwidth classes and target architectures. Public sources that support this step include data center and telecom releases and datasets from national ICT regulators, ITU indicators, World Bank digital and electricity statistics, UN Comtrade trade codes for networking hardware, and information on submarine cables and internet exchanges published by industry bodies.
We also reviewed public filings and investor presentations of data center operators, hyperscale build announcements, and reputable press coverage that indicates new halls, new regions, and changes in commissioning timing. Patent databases were used selectively to sense upgrade cycles in high-speed Ethernet and optical connectivity, which informs refresh assumptions. Where needed, we relied on paid subscription sources for company financials and news to keep ownership and expansion timelines consistent. These examples are not exhaustive, and additional public documents were checked to validate data points and clarify assumptions.
Primary Interviews and Surveys
Primary work was used to confirm what is actually being bought for African data centers, and to ground assumptions for mix shifts such as 25-40 GbE moving toward 50-100 GbE and above. We spoke with a mix of data center operators, system integrators, distributors, and enterprise network teams across key hubs, and then used their inputs to close gaps in pricing, refresh timing, and services attach rates.
Distribution of primary research fieldwork respondents
| Company type | Respondent position |
|---|---|
| Top tier: 31% | CXOs: 19% |
| Mid tier: 48% | Functional/Unit leaders: 26% |
| Smaller Players: 21% | Managers: 55% |
Market-Sizing & Forecasting
The sizing model uses top-down logic to rebuild data center networking demand from the active data center footprint (by colocation, hyperscale or cloud, and edge or micro), then applies typical networking intensity by bandwidth class. To keep the numbers practical, we also run selective bottom-up checks, such as sampled price-per-port ranges, channel checks on product availability, and a roll-up of a limited set of large deployments that are visible from public build announcements.
Model inputs include planned and live data center capacity additions, upgrade cadence for switching and routing, adoption of leaf-spine designs, Ethernet speed mix changes, and the services share tied to installation, support, and network management. When primary inputs indicated gaps in smaller markets, we filled those gaps using proxy indicators such as colocation cabinet growth, enterprise cloud migration timing, and cross-border cable landing activity, then rebalanced country shares back to Africa totals.
Forecasts were generated using scenario analysis supported by a simple multivariate regression view for the near term, where variables like capacity additions, cloud workload localization, and bandwidth migration rates were treated as leading indicators. Final forecast assumptions were normalized using expert consensus ranges, so the growth path remains consistent year to year.
Data Validation & Update Cycle
Validation is done through multiple checks to keep results consistent with real build cycles. We compare modeled spend against independent signals such as capacity expansions, public project timelines, and trade-flow direction for key networking categories, then investigate any variance that appears too large for the specific country or year.
Before sign-off, the model is reviewed in steps, including peer review of key assumptions, unit checks on pricing and mix, and a final variance scan versus prior-year patterns. When large events occur, such as a delayed hyperscale launch or a major policy shift on data localization, analysts re-contact sources and update the relevant assumptions. Reports are refreshed annually, and before delivery a new pass is completed so clients receive the latest updated view.
Mordor Intelligence's Africa Data Center Networking Market Size Measured Against Other Published Estimates
Published market values for Africa data center networking can differ because each publisher draws the boundary differently on what counts as in-data-center networking, and they may also use different timing for upgrades and currency conversion. As a result, two sources can look far apart even when they are responding to the same expansion announcements.
Capacity additions, speed-mix upgrades (such as 25-40 GbE moving to 50-100 GbE), and trade-flow checks for networking hardware are used as evidence to keep Mordor Intelligence's estimate tied to data center deployed demand, rather than broader enterprise networking spend. Differences usually come from scope choices (edge and micro sites, SDN control, services attach), aggressive versus base-case rollout timing for new halls, and whether pricing is modeled as a stable blended ASP or escalated by high-speed adoption.
Benchmark comparison
| Source | Market Size | Gaps in Research Methodology |
|---|---|---|
| Mordor Intelligence | USD 2.38 B (2026) | |
| Regional Consultancy A | USD 1.20 B (2024) | Uses an earlier base year and tends to exclude edge or micro data centers and services revenues, which reduces counted deployments and lowers the blended spend per site. |
| Global Consultancy B | USD 3.41 B (2024) | Combines Africa with a wider geography and may fold in campus networking tied to data center campuses, which inflates volumes beyond equipment deployed inside the data center network. |
The spread in the table is mainly explained by boundary choices and timing, not a different view of Africa data center momentum. By keeping inclusions tied to in-data-center networking components and validating against build and upgrade signals, the final number stays traceable to clear demand drivers and repeatable checks.


Key Questions Answered in the Report
What is the current size of the Africa data center networking market?
The Africa data center networking market size at USD 2.38 billion in 2026 and is projected to reach USD 4.41 billion by 2031.
Which segment holds the largest share in the Africa data center networking market?
Products, primarily Ethernet switches and routers, captured 67.45% of market share in 2025.
Which bandwidth category is growing the fastest?
Links above 100 GbE are expanding at a 15.92% CAGR because AI and hyperscale workloads need higher throughput.
Why is South Africa the dominant geography?
South Africa controls 41.85% of 2025 revenue thanks to extensive subsea cable landings, established carrier hotels, and supportive government policy.
How are skills shortages affecting growth?
Limited availability of advanced network engineers raises deployment costs and delays projects, subtracting an estimated 1.8% from forecast CAGR.
What opportunities do white-box vendors have in Africa?
White-box switches can reduce capex by up to 70% and align with open-source operating systems, making them attractive in price-sensitive markets.
Page last updated on:
- Data Center Networking Market
- APAC Data Center Networking Market
- Australia Data Center Networking Market
- Austria Data Center Networking Market
- Belgium Data Center Networking Market
- Brazil Data Center Networking Market
- Canada Data Center Networking Market
- Chile Data Center Networking Market
- China Data Center Networking Market
- Data Center Networks Market
- Denmark Data Center Networking Market
- Europe Data Center Networking Market





