India Agricultural Biologicals Market Size and Share
Market Overview
| Study Period | 2018 - 2031 |
|---|---|
| Forecast Data Period | 2026 - 2031 |
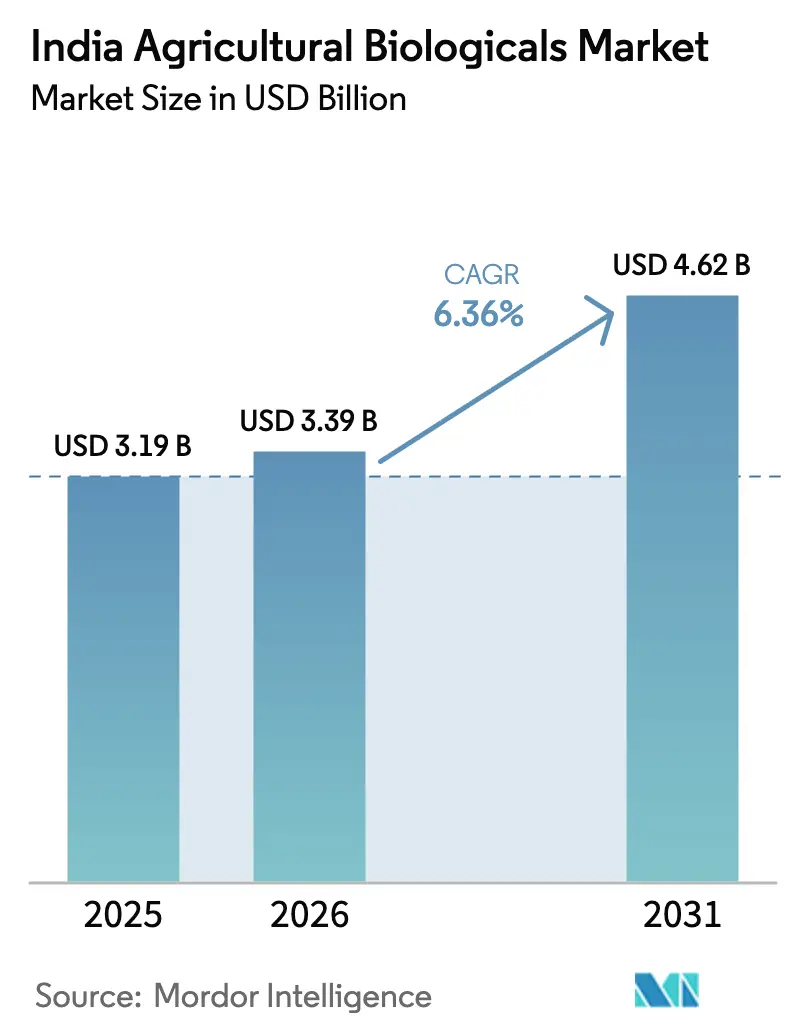
| Base Year Market Size (2025) | USD 3.19 Billion |
| Market Size (2026) | USD 3.39 Billion |
| Market Size (2031) | USD 4.62 Billion |
| Growth Rate (2026 - 2031) | 6.36% CAGR |
| Market Concentration | Low |
Major Players*Disclaimer: Major Players sorted in no particular order Image © Mordor Intelligence. Reuse requires attribution under CC BY 4.0. | |
India Agricultural Biologicals Market Analysis by Mordor Intelligence
India Agricultural Biologicals Market size in 2026 is estimated at USD 3.39 billion, growing from 2025 value of USD 3.19 billion with 2031 projections showing USD 4.62 billion, growing at 6.36% CAGR over 2026-2031.
The Indian agricultural biologicals industry is undergoing a significant transformation driven by mounting concerns over soil health and environmental sustainability. The continuous and excessive use of chemical fertilizers has led to severe degradation of soil quality, with studies showing deficiencies in both macro and micronutrients despite recommended NPK applications. The Indian Council of Agricultural Research (ICAR) has taken a proactive stance by advocating for integrated nutrient management approaches that combine both organic and inorganic sources. This shift in agricultural practices reflects a growing recognition of the need to balance productivity with environmental stewardship. The average pesticide consumption in India remains relatively low at 570 grams per hectare, compared to countries like Japan and Thailand, where consumption rates reach 11 kg and 17 kg per hectare, respectively.
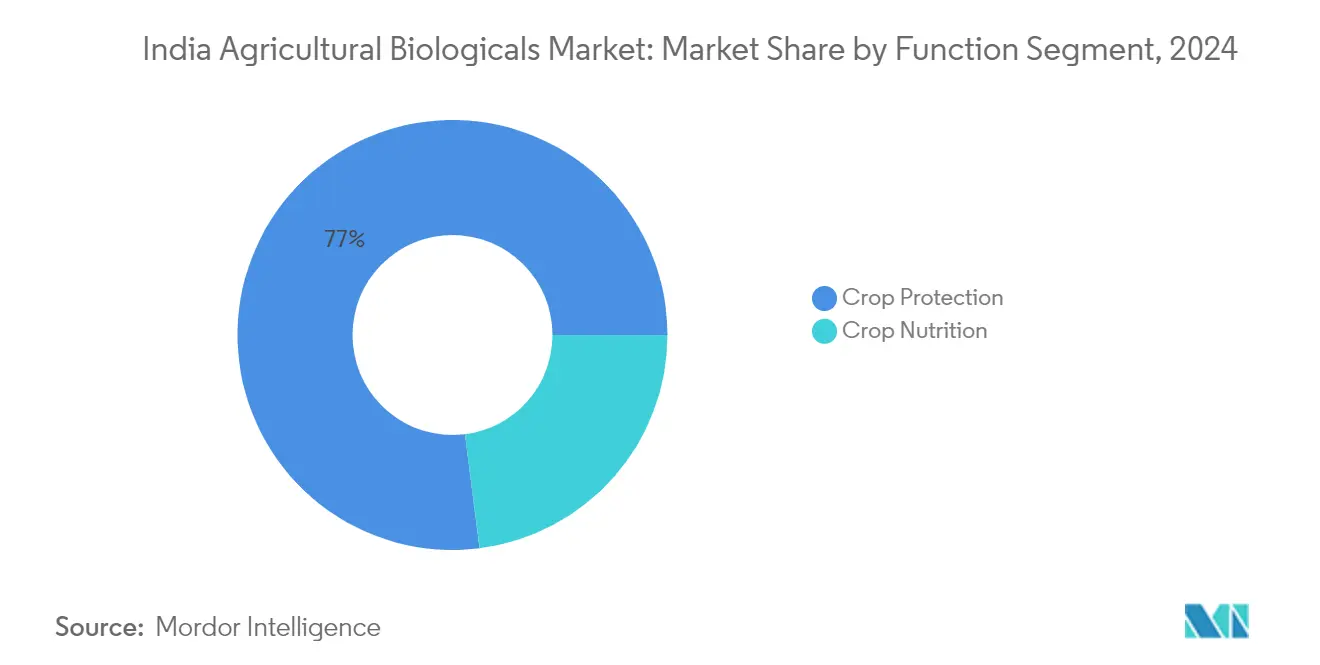
The market landscape is being reshaped by progressive government initiatives and regulatory frameworks aimed at promoting sustainable agriculture. The implementation of programs such as Paramparagat Krishi Vikas Yojana (PKVY) and Mission Organic Value Chain Development for North East Region (MOVCD-NER) demonstrates India's commitment to expanding organic farming inputs. These initiatives provide comprehensive support mechanisms, including financial assistance, training, and certification support for farmers transitioning to organic methods. The crop protection segment has emerged as a dominant force in the market, accounting for 77% of the total market share in 2022, indicating a strong emphasis on biological crop protection solutions.
India's position as a global leader in organic agriculture is exemplified by its vast network of certified organic producers, numbering 1.3 million, making it the country with the largest organic producer base worldwide. Despite this impressive producer base, organic cultivation currently represents only 2% of the total agricultural area, suggesting significant potential for expansion. The industry is witnessing a gradual shift from traditional farming methods to more sustainable practices, with row crop cultivation dominating the agricultural biologicals market at 87.7% in 2022. This trend reflects the growing adoption of biological solutions in mainstream agriculture, particularly in staple crop production.
The sector is experiencing notable technological advancements in biological formulations and application methods. Companies are investing in research and development to create more effective and targeted biological solutions, including enhanced biofertilizers, biopesticides, and biostimulants. The industry is seeing increased collaboration between research institutions and private sector players to develop innovative biological products that can effectively replace chemical alternatives. These developments are particularly focused on addressing specific challenges in Indian agriculture, such as soil health restoration, pest resistance management, and yield optimization while maintaining environmental sustainability. The market is witnessing a shift towards integrated pest management approaches that combine biological control agents with traditional methods, leading to more sustainable and effective agricultural practices.
Note: Market size and forecast figures in this report are generated using Mordor Intelligence’s proprietary estimation framework, updated with the latest available data and insights as of 2026.
India Agricultural Biologicals Market Trends and Insights
Growing number of organic producers helping the increase in area under organic cultivation, primarily in row crops
- India is the largest country, in terms of the total number of certified organic producers in the world, with 1.3 million organic producers in 2019. Despite having a large number of organic producers, organic cultivation areas in the country account for around 2.0% of the total agriculture area in the country. In 2021, the organic area in the country was recorded as 0.7 million hectares, which increased by about 3.4% compared to 2017.
- The top ten organic farming states in the country account for about 80.0% of the total organic crop area. A few states have taken the lead in improving organic farming including Madhya Pradesh, Rajasthan, and Maharashtra, the top organic farming states, with Madhya Pradesh accounting for 27.0% in 2019.
- Organic cultivation of row crops is dominant in the country, which accounted for about 59.7% of the total organic crop area in 2021. Cereal crop production is dominant rice, wheat, millet, and maize are the major cereals produced. Most cereal crops are grown in the kharif season (June - September). The crops grown in this season are mainly rain-dependent or require more water, like rice, maize, cotton, and soybean.
- The overall organic cash crop cultivation area increased from 0.27 million hectares in 2017 to 0.28 million hectares in 2021. The major cash crops produced in the country are cotton, sugarcane, tea, and spices. There is a limited growth of organic horticultural crops currently in the country. The increasing demand for organic products and Indian government initiatives to go organic are anticipated to increase organic crop area between 2023 and 2029.


Growing demand and their easy accessibility through e-commerce channels, rising the per capita spending on organic food
- India's per capita spending on organic products is relatively low at USD 0.23 compared to the average per capita spending on organic products in Asia-Pacific. However, in recent years, shifting consumer demand has increased toward organic products as more customers perceive these items offer better immunity, higher quality, and more accessibility through e-commerce channels. India is a promising and developing market for organic foods and beverages. India's domestic organic food and beverage industry is expected to be worth USD 138.0 million by 2024, rising at a compound annual growth rate of 13% between 2019 to 2024.
- In 2022, the total combined organic food and beverages worth USD 108.0 million consumed in the country. The consumption value of organic products in the country increased from USD 45 million in 2016 to USD 96.0 million in 2021. Organic food sales have seen an increasing trend mainly due to increasing consumer awareness, and high-income consumers are propelling organic food and beverage consumption. Categories that gained the most demand included essential foods, such as organic eggs, dairy, and fruits and vegetables.
- Organic beverage consumption dominated the market and accounted for about 85.2% of the total combined organic food and beverages market value in 2022. The organic beverages segment includes organic packaged food and beverages that are certified by the approved certification body. Organic beverage consumption value increased at a CAGR of 14% between 2020 to 2022. The price premium associated with organic products hampers lower-income consumer access and is the major limiting factor for organic food consumption. However, organic products' active promotion and advantages drive the organic food market during the forecast period.

Segment Analysis: Function
Crop Protection Segment in India Agricultural Biologicals Market
The crop protection segment maintains its dominant position in the Indian agricultural biologicals market, accounting for approximately 76.42% of the total market value in 2025. This substantial market share is primarily driven by the widespread adoption of biocontrol agents, which dominate the crop protection segment. Biocontrol agents have gained significant traction among Indian farmers due to their effectiveness in managing crop pests and diseases while maintaining environmental sustainability. The segment's strong performance is further supported by various government initiatives promoting biopesticide research, development, and commercialization through agencies like the Ministry of Agriculture and Farmers Welfare and the Department of Biotechnology (DBT).

Biostimulants Segment in India Agricultural Biologicals Market
The biostimulants segment, a key component of crop nutrition, is experiencing remarkable growth in the Indian agricultural biologicals market, with a projected CAGR of approximately 9.45% between 2025 and 2031. This impressive growth trajectory is driven by increasing awareness among farmers about the benefits of biostimulants in improving overall plant health, stress tolerance, root growth, and crop yield. The segment's expansion is particularly notable in the application of seaweed extracts, which have shown exceptional results in enhancing crop productivity and resilience. The growth is further supported by the rising adoption of sustainable farming practices and the increasing demand for organic agricultural products in both domestic and international markets.
Remaining Segments in Function Segmentation
Beyond crop protection and biostimulants, the Indian agricultural biologicals market encompasses other vital segments, including biofertilizers and organic fertilizers within the crop nutrition category. These segments play crucial roles in sustainable agriculture by providing essential nutrients and improving soil health naturally. Organic fertilizers, in particular, have gained significant importance due to their ability to enhance soil biodiversity and maintain long-term soil fertility. The biofertilizers segment, though smaller in market share, continues to contribute significantly to sustainable farming practices through products like Rhizobium and Azospirillum, which help in nitrogen fixation and overall plant growth enhancement.
Segment Analysis: Crop Type
Row Crops Segment in India Agricultural Biologicals Market
Row crops dominate the Indian agricultural biologicals market, commanding approximately 88% market share in 2024, primarily driven by the extensive organic cultivation area in the country. The segment's prominence is attributed to the widespread cultivation of essential crops like rice, wheat, pulses, millet, and maize, which form the staple food base for most of the country's population. The consumption of biological crop protection products is particularly high in this segment due to growing awareness among farmers about the importance of pest management to increase overall yield. The segment's dominance is further strengthened by various government initiatives promoting sustainable farming practices and organic cultivation methods, particularly for cereal crops, which have significant export potential in international markets.
Horticultural Crops Segment in India Agricultural Biologicals Market
The horticultural crops segment in the Indian agricultural biologicals market is experiencing significant transformation, with projections indicating substantial growth between 2024 and 2029. The segment's expansion is driven by increasing demand for organic fruits and vegetables in both domestic and international markets, where they command premium prices of 10-15% higher than conventional produce. Government initiatives like the Paramparagat Krishi Vikas Yojana (PKVY) are actively promoting organic farming in this sector by providing training to farmers and offering financial assistance of USD 623.1 per hectare for the first three years. The rising consumer awareness about food safety and increasing preference for chemical-free produce is expected to boost organic horticultural cultivation, consequently driving the demand for agricultural biologicals in this segment.
Remaining Segments in Crop Type
The cash crops segment represents a significant portion of the Indian agricultural biologicals market, encompassing important crops like cotton, sugarcane, tea, coffee, and spices. This segment has witnessed substantial development through various government schemes and programs designed to promote sustainable farming practices. The National Mission on Oilseeds and Oil Palm (NMOOP) has been particularly influential, offering a 50% subsidy to farmers on agricultural biological inputs. The segment's growth is further supported by the increasing international demand for organic cash crops and the growing awareness among farmers about the benefits of biological inputs in improving both yield and quality of these high-value crops.
Competitive Landscape
Top Companies in India Agricultural Biologicals Market
The leading companies in India's agricultural biologicals market are demonstrating a strong commitment to innovation and market expansion through various strategic initiatives. Companies are actively investing in research and development to create novel biological solutions, particularly focusing on biostimulants and biopesticides tailored for different crop types. Operational agility is being enhanced through the establishment of specialized manufacturing facilities and the development of robust distribution networks across key agricultural regions. Strategic partnerships with agricultural universities and technological institutions are being leveraged to develop innovative crop solutions and strengthen market presence. Companies are also expanding their product portfolios through organic and inorganic growth strategies, with a particular focus on developing eco-friendly and sustainable agricultural bio products. The market is witnessing increased investment in farmer education programs and digital platforms to promote the adoption of biological products.
Local Players Dominate Fragmented Market Structure
The Indian agricultural biologicals market exhibits a fragmented structure with a mix of large domestic conglomerates and specialized local players. Domestic companies like Coromandel International, Madras Fertilizers, and Gujarat State Fertilizers & Chemicals dominate the market through their extensive distribution networks and strong brand recognition. These established players leverage their deep understanding of local agricultural conditions and farmer requirements to maintain their market positions. The market is characterized by intense competition among numerous small and medium-sized enterprises that specialize in specific biological product categories.
The market is witnessing gradual consolidation through strategic mergers and acquisitions, particularly among larger players seeking to expand their biological product portfolios. Companies are forming strategic alliances to strengthen their research capabilities and market reach, while also focusing on vertical integration to ensure better control over product quality and supply chain. Local players maintain a competitive edge through their strong relationships with farming communities and ability to provide customized solutions for regional crop requirements. The market structure encourages healthy competition while fostering innovation and product development to meet evolving farmer needs.
Innovation and Distribution Key to Growth
Success in the Indian agricultural biologicals market increasingly depends on companies' ability to innovate and develop effective distribution strategies. Incumbent players need to focus on continuous product innovation, particularly in developing biological solutions that offer comparable efficacy to chemical alternatives while maintaining cost-effectiveness. Building strong relationships with agricultural institutions and farming communities through demonstration programs and technical support services is crucial for market expansion. Companies must also invest in digital platforms and modern distribution channels to improve product accessibility and farmer engagement.
For contenders looking to gain market share, developing specialized product offerings for specific crop segments and regional requirements presents a significant opportunity. Success factors include establishing robust quality control measures to build farmer trust and investing in farmer education programs to promote biological product adoption. Companies must also navigate the evolving regulatory landscape, particularly regarding product registration and quality standards. The market shows limited substitution risk due to growing awareness about sustainable agriculture, but companies need to focus on price competitiveness and product effectiveness to maintain market position. Building strong distribution networks and leveraging digital technologies for farmer outreach will be crucial for future success. Additionally, the integration of agricultural microbials and biological crop protection solutions can further enhance market growth and sustainability.
India Agricultural Biologicals Industry Leaders
Coromandel International Ltd
Gujarat State Fertilizers & Chemicals Limited
Madras Fertilizers Limited
Prabhat Fertilizer and Chemical Works
Swaroop Agrochemical Industries
- *Disclaimer: Major Players sorted in no particular order


Recent Industry Developments
- September 2022: To expand GSFC's agro-products portfolio, the company planned to enter into organic fertilizers by setting up a 2x200 MTPD PROM plant at a polymer unit by using available existing infrastructure.
- April 2022: The company approved the merger between Liberty Pesticides and Fertilizers Limited (LPFL) and Coromandel SQM (India) Private Limited (CSQM) (wholly-owned subsidiaries), which came into effect on April 01, 2021.
- February 2022: Gujarat State Fertilizers & Chemicals Ltd launched the Urban Sardar organic fertilizer, an eco-friendly and non-toxic product containing organic sources of nutrients best suitable for all flowering plants and ornamental plants, gardens, and kitchen gardening.


India Agricultural Biologicals Market Report Scope
Crop Nutrition, Crop Protection are covered as segments by Function. Cash Crops, Horticultural Crops, Row Crops are covered as segments by Crop Type.| Crop Nutrition | Biofertilizer | Azospirillum |
| Azotobacter | ||
| Mycorrhiza | ||
| Phosphate Solubilizing Bacteria | ||
| Rhizobium | ||
| Other Biofertilizers | ||
| Biostimulants | Amino Acids | |
| Fulvic Acid | ||
| Humic Acid | ||
| Protein Hydrolysates | ||
| Seaweed Extracts | ||
| Other Biostimulants | ||
| Organic Fertilizer | Manure | |
| Meal Based Fertilizers | ||
| Oilcakes | ||
| Other Organic Fertilizers | ||
| Crop Protection | Biocontrol Agents | Macrobials |
| Microbials | ||
| Biopesticides | Biofungicides | |
| Bioherbicides | ||
| Bioinsecticides | ||
| Other Biopesticides | ||
| Cash Crops |
| Horticultural Crops |
| Row Crops |
| Function | Crop Nutrition | Biofertilizer | Azospirillum |
| Azotobacter | |||
| Mycorrhiza | |||
| Phosphate Solubilizing Bacteria | |||
| Rhizobium | |||
| Other Biofertilizers | |||
| Biostimulants | Amino Acids | ||
| Fulvic Acid | |||
| Humic Acid | |||
| Protein Hydrolysates | |||
| Seaweed Extracts | |||
| Other Biostimulants | |||
| Organic Fertilizer | Manure | ||
| Meal Based Fertilizers | |||
| Oilcakes | |||
| Other Organic Fertilizers | |||
| Crop Protection | Biocontrol Agents | Macrobials | |
| Microbials | |||
| Biopesticides | Biofungicides | ||
| Bioherbicides | |||
| Bioinsecticides | |||
| Other Biopesticides | |||
| Crop Type | Cash Crops | ||
| Horticultural Crops | |||
| Row Crops | |||


Market Definition
- AVERAGE DOSAGE RATE - The average application rate is the average volume of agricultural biologicals applied per hectare of farmland in the respective region/country.
- CROP TYPE - Crop type includes Row crops (Cereals, Pulses, Oilseeds), Horticultural Crops (Fruits and vegetables) and Cash Crops (Plantation Crops, Fibre Crops and Other Industrial Crops)
- FUNCTION - Agricultural biological products provide crops with essential nutrients, prevent or control abiotic & biotic stresses, and enhance soil quality.
- TYPE - The Crop Nutrition function of agricultural biologicals includes organic fertilizer and Biofertilizer, whereas the Crop Protection function includes Biostimulants, Biopesticides and Biocontrol Agents.
| Keyword | Definition |
|---|---|
| Cash Crops | Cash crops are non-consumable crops sold as a whole or part of the crop to manufacture end-products to make a profit. |
| Integrated Pest Management (IPM) | IPM is an environment-friendly and sustainable approach to control pests in various crops. It involves a combination of methods, including biological controls, cultural practices, and selective use of pesticides. |
| Bacterial biocontrol agents | Bacteria used to control pests and diseases in crops. They work by producing toxins harmful to the target pests or competing with them for nutrients and space in the growing environment. Some examples of commonly used bacterial biocontrol agents include Bacillus thuringiensis (Bt), Pseudomonas fluorescens, and Streptomyces spp. |
| Plant Protection Product (PPP) | A plant protection product is a formulation applied to crops to protect from pests, such as weeds, diseases, or insects. They contain one or more active substances with other co-formulants such as solvents, carriers, inert material, wetting agents or adjuvants formulated to give optimum product efficacy. |
| Pathogen | A pathogen is an organism causing disease to its host, with the severity of the disease symptoms. |
| Parasitoids | Parasitoids are insects that lay their eggs on or within the host insect, with their larvae feeding on the host insect. In agriculture, parasitoids can be used as a form of biological pest control, as they help to control pest damage to crops and decrease the need for chemical pesticides. |
| Entomopathogenic Nematodes (EPN) | Entomopathogenic nematodes are parasitic roundworms that infect and kill pests by releasing bacteria from their gut. Entomopathogenic nematodes are a form of biocontrol agents used in agriculture. |
| Vesicular-arbuscular mycorrhiza (VAM) | VAM fungi are mycorrhizal species of fungus. They live in the roots of different higher-order plants. They develop a symbiotic relationship with the plants in the roots of these plants. |
| Fungal biocontrol agents | Fungal biocontrol agents are the beneficial fungi that control plant pests and diseases. They are an alternative to chemical pesticides. They infect and kill the pests or compete with pathogenic fungi for nutrients and space. |
| Biofertilizers | Biofertilizers contain beneficial microorganisms that enhance soil fertility and promote plant growth. |
| Biopesticides | Biopesticides are natural/bio-based compounds used to manage agricultural pests using specific biological effects. |
| Predators | Predators in agriculture are the organisms that feed on pests and help control pest damage to the crops. Some common predator species used in agriculture include ladybugs, lacewings, and predatory mites. |
| Biocontrol agents | Biocontrol agents are living organisms used to control pests and diseases in agriculture. They are alternatives to chemical pesticides and are known for their lesser impact on the environment and human health. |
| Organic Fertilizers | Organic fertilizer is composed of animal or vegetable matter used alone or in combination with one or more non-synthetically derived elements or compounds used for soil fertility and plant growth. |
| Protein hydrolysates (PHs) | Protein hydrolysate-based biostimulants contain free amino acids, oligopeptides, and polypeptides produced by enzymatic or chemical hydrolysis of proteins, primarily from vegetal or animal sources. |
| Biostimulants/Plant Growth Regulators (PGR) | Biostimulants/Plant Growth Regulators (PGR) are substances derived from natural resources to enhance plant growth and health by stimulating plant processes (metabolism). |
| Soil Amendments | Soil Amendments are substances applied to soil that improve soil health, such as soil fertility and soil structure. |
| Seaweed Extract | Seaweed extracts are rich in micro and macronutrients, proteins, polysaccharides, polyphenols, phytohormones, and osmolytes. These substances boost seed germination and crop establishment, total plant growth and productivity. |
| Compounds related to biocontrol and/or promoting growth (CRBPG) | Compounds related to biocontrol or promoting growth (CRBPG) are the ability of a bacteria to produce compounds for phytopathogen biocontrol and plant growth promotion. |
| Symbiotic Nitrogen-Fixing Bacteria | Symbiotic nitrogen-fixing bacteria such as Rhizobium obtain food and shelter from the host, and in return, they help by providing fixed nitrogen to the plants. |
| Nitrogen Fixation | Nitrogen fixation is a chemical process in soil which converts molecular nitrogen into ammonia or related nitrogenous compounds. |
| ARS (Agricultural Research Service) | ARS is the U.S. Department of Agriculture's chief scientific in-house research agency. It aims to find solutions to agricultural problems faced by the farmers in the country. |
| Phytosanitary Regulations | Phytosanitary regulations imposed by the respective government bodies check or prohibit the importation and marketing of certain insects, plant species, or products of these plants to prevent the introduction or spread of new plant pests or pathogens. |
| Ectomycorrhizae (ECM) | Ectomycorrhiza (ECM) is a symbiotic interaction of fungi with the feeder roots of higher plants in which both the plant and the fungi benefit through the association for survival. |


Research Methodology
Mordor Intelligence follows a four-step methodology in all our reports.
- Step-1: Identify Key Variables: In order to build a robust forecasting methodology, the variables and factors identified in Step-1 are tested against available historical market numbers. Through an iterative process, the variables required for market forecast are set and the model is built on the basis of these variables.
- Step-2: Build a Market Model: Market-size estimations for the forecast years are in nominal terms. Inflation is not a part of the pricing, and the average selling price (ASP) is kept constant throughout the forecast period.
- Step-3: Validate and Finalize: In this important step, all market numbers, variables and analyst calls are validated through an extensive network of primary research experts from the market studied. The respondents are selected across levels and functions to generate a holistic picture of the market studied.
- Step-4: Research Outputs: Syndicated Reports, Custom Consulting Assignments, Databases & Subscription Platforms.


