Incident Response Services Market Size and Share
Market Overview
| Study Period | 2020 - 2031 |
|---|---|
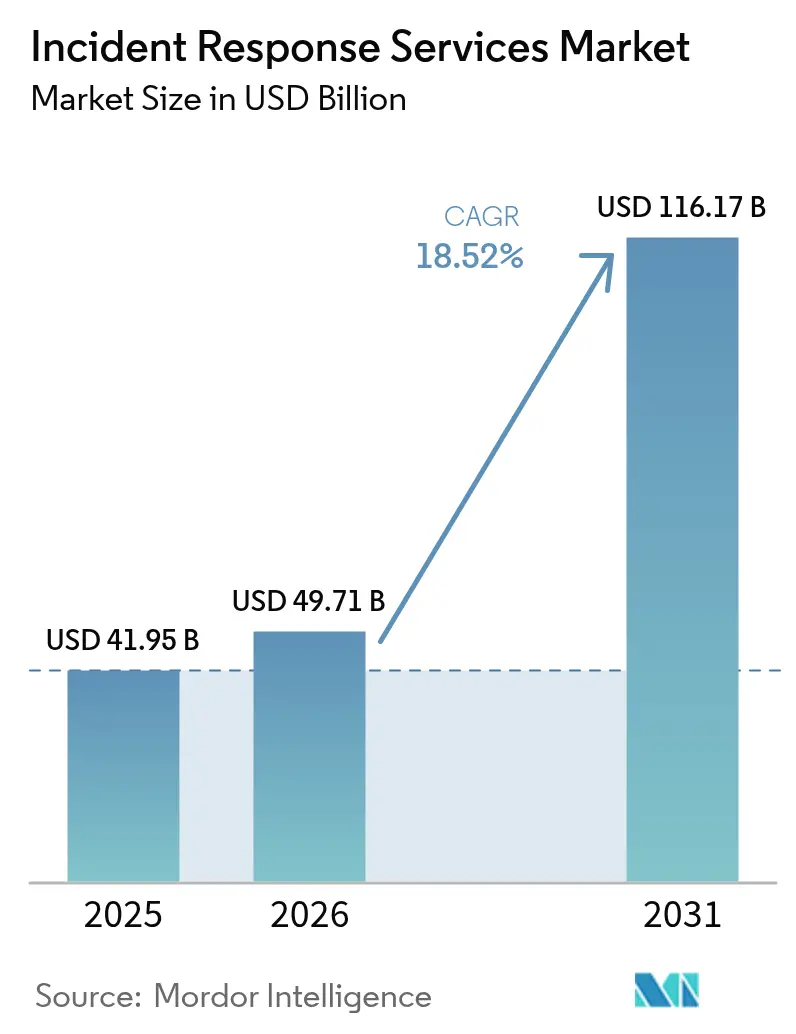
| Market Size (2026) | USD 49.71 Billion |
| Market Size (2031) | USD 116.17 Billion |
| Growth Rate (2026 - 2031) | 18.52% CAGR |
| Fastest Growing Market | Asia-Pacific |
| Largest Market | North America |
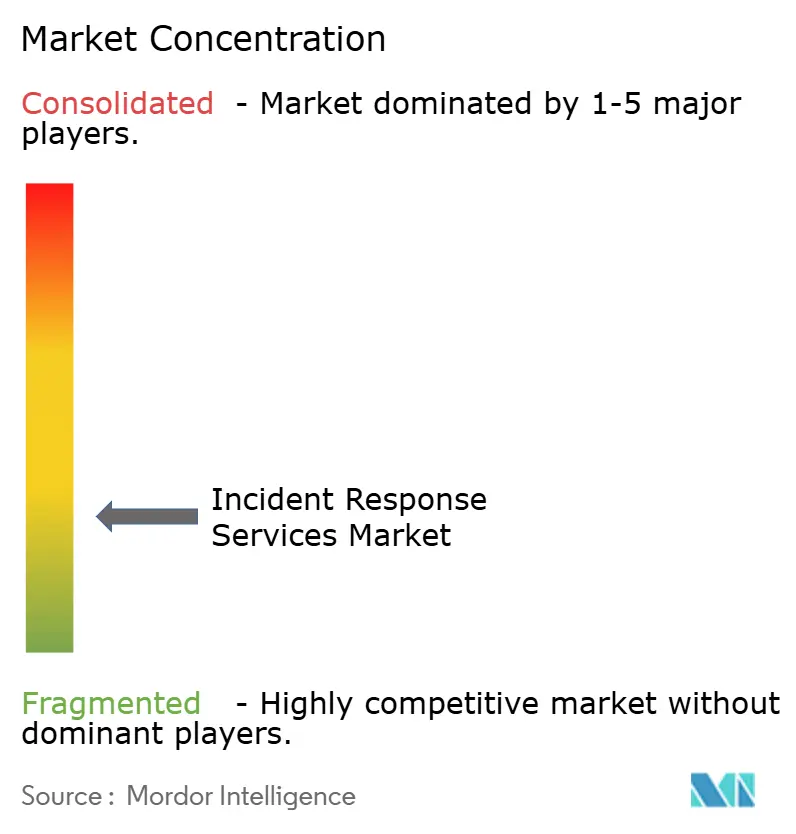
| Market Concentration | Low |
Major Players *Disclaimer: Major Players sorted in no particular order Image © Mordor Intelligence. Reuse requires attribution under CC BY 4.0. | |
Incident Response Services Market Analysis by Mordor Intelligence
incident response services market size in 2026 is estimated at USD 49.71 billion, growing from 2025 value of USD 41.95 billion with 2031 projections showing USD 116.17 billion, growing at 18.52% CAGR over 2026-2031. Rising attack sophistication, stricter data-protection mandates, and cloud-first architectures are redefining service expectations in ways that favor automation, artificial intelligence, and cross-border response expertise. Vendor consolidation is underway as platform providers acquire managed detection and response (MDR) specialists to integrate threat hunting and containment under one operating model. Cloud workload migration continues to expand the incident response services market, yet on-premises tooling still dominates highly regulated environments that must meet local data-sovereignty rules. Meanwhile, cyber-insurance underwriters are tightening policy language and rewarding buyers that can show signed response retainers, incentivizing organizations of every size to reassess coverage gaps.
Key Report Takeaways
- By service type, Containment and Mitigation led with 32.75% incident response services market share in 2025, while Managed Detection and Response is projected to grow at a 20.6% CAGR through 2031.
- By deployment mode, On-Premises solutions held 56.45% of the incident response services market size in 2025; cloud-based services are advancing at a 19.85% CAGR to 2031.
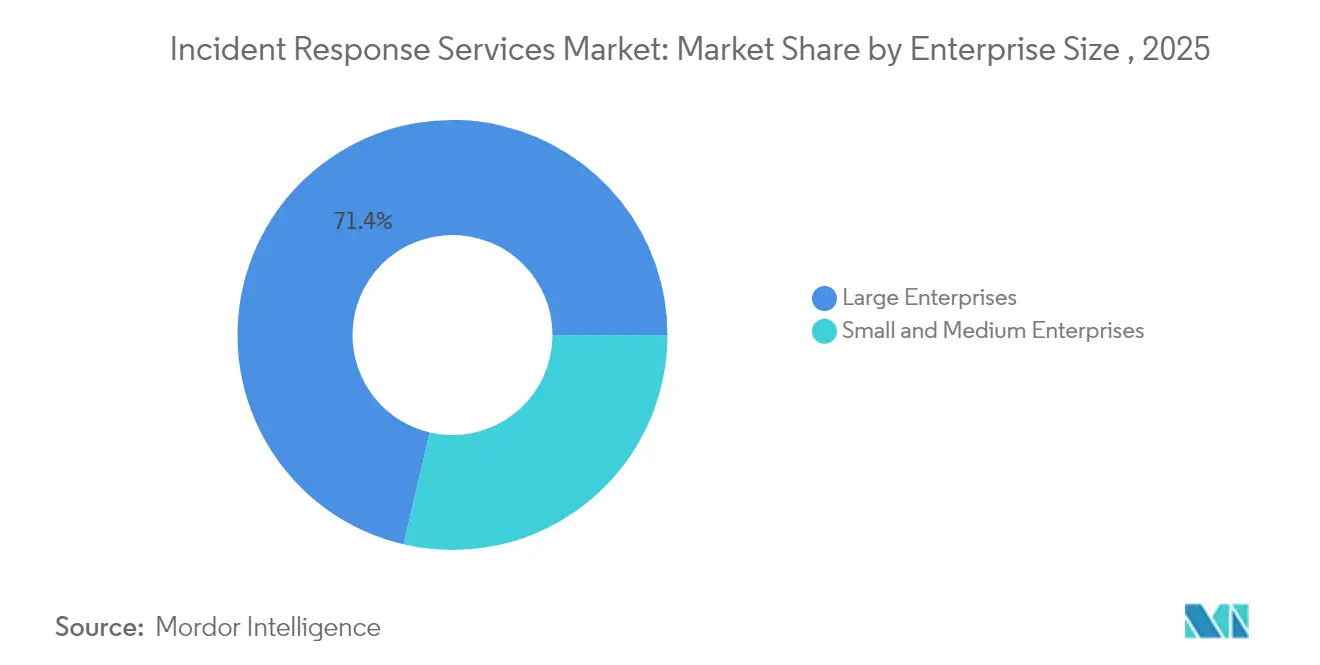
- By enterprise size, Large Enterprises controlled 71.35% revenue share in 2025; Small and Medium Enterprises are expanding at a 18.74% CAGR as cyber-insurance clauses push pre-approved retainers.
- By end-user industry, Banking, Financial Services, and Insurance accounted for 23.15% of the incident response services market size in 2025, while Healthcare and Life Sciences is rising at a 19.24% CAGR.
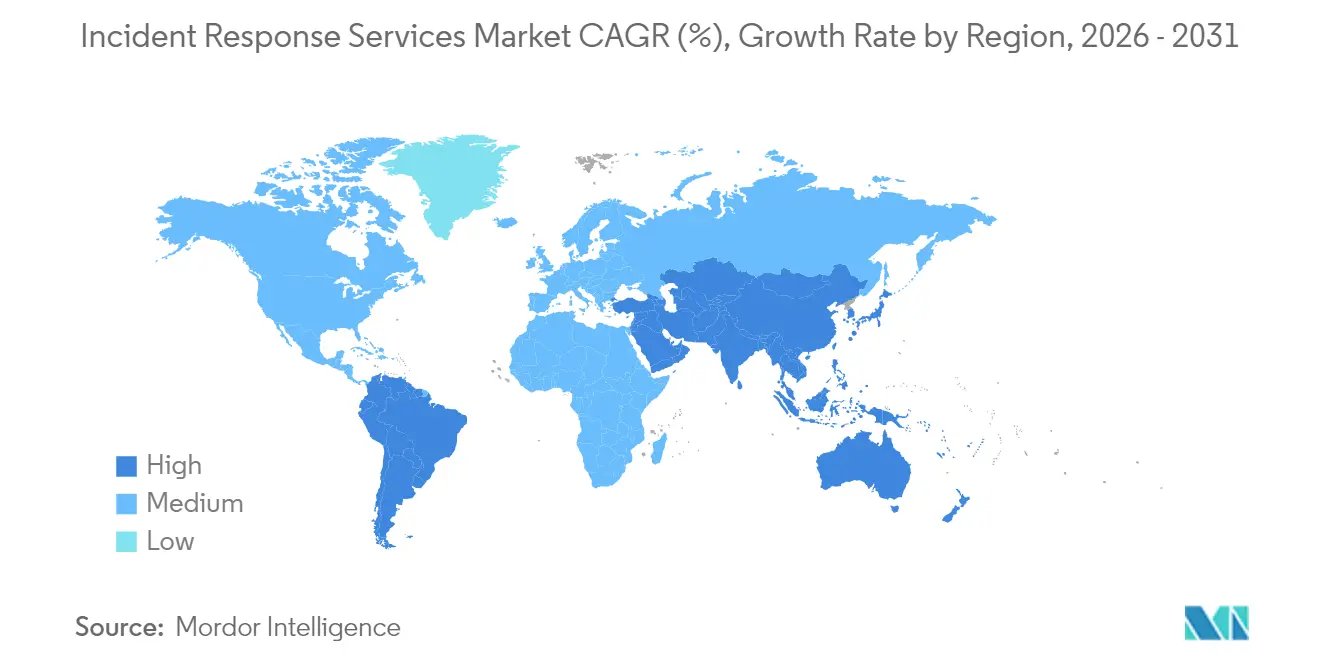
- By geography, North America led with 37.85% incident response services market share in 2025; Asia-Pacific is the fastest-growing region at a 20.12% CAGR through 2031
Note: Market size and forecast figures in this report are generated using Mordor Intelligence’s proprietary estimation framework, updated with the latest available data and insights as of 2026.
Global Incident Response Services Market Trends and Insights
Surge in Frequency and Sophistication of Cyber-Attacks in BFSI and Critical Infrastructure
Financial institutions and utility operators now contend with attack dwell times measured in minutes rather than days, forcing a pivot to containment-first playbooks that emphasize rapid isolation of endpoints and network segments. The Unit 42 Global Incident Response Report recorded that 86% of 2024 breaches disrupted business operations, while adversaries exfiltrated data inside the first hour of compromise. Legacy system convergence with open banking APIs compounds risk in BFSI, whereas operational technology (OT) environments in energy and transport require response teams to preserve uptime even while eradicating malware. Government guidance, such as the Texas Department of Banking’s 2025 notice that basic cyber hygiene blocks 98% of threats, reinforces the view that specialized responders are essential for the remaining high-grade incidents. [1]Texas Department of Banking, “Industry Notice 2025-01,” dob.texas.gov
Stricter Data-Protection Regulations Driving Compliance-Mandated Investments
The European Union’s NIS2 directive obliges essential entities to report significant incidents within 24 hours and faces violators with fines up to EUR 10 million (USD 11.3 million). [2]European Commission, “Directive (EU) 2022/2555 on Measures for a High Common Level of Cybersecurity,” secureframe.com Similar momentum exists in North America, where PCI-DSS 4.0 and evolving state privacy laws demand verifiable incident response programs that extend beyond technical logs to downstream reporting and stakeholder communication. Compliance overlap across regions has spurred multinational firms to seek global response partners that can align evidence collection, legal holds, and public disclosure standards in one coordinated workflow.
Cloud-First Adoption Expanding Attack Surface
Organizations shifting to multi-cloud infrastructures discover that perimeter-centric response plans break down when serverless functions, APIs, and container workloads disappear within seconds. The Cloud Security Alliance warns that ineffective playbooks delay cloud breach detection and amplify downstream losses. Shared responsibility models further complicate forensic chain-of-custody, motivating providers to embed automated snapshots and tamper-proof logging. Early adopters report that cloud-native MDR contracts shorten detection windows, though some financial services clients still require on-premises analysis for regulated data sets.
Rise of Ransom-Cloud and BEC 3.0 Exploiting OAuth Tokens
Threat actors now leverage legitimate OAuth applications to tunnel operations that appear whitelisted to security monitors. Microsoft observed Storm-1283 using cloud virtual machines for lateral movement, with incident losses ranging from USD 10,000 to USD 1.5 million securityaffairs. Attack schemes classed as BEC 3.0 combine token theft and social engineering to redirect wire transfers and payroll files, raising the stakes for rapid token revocation and account restoration. The FBI attributes USD 17.3 billion in global business email compromise losses between 2013 and 2022, with a sharp rise in 2023 linked to cloud collaboration platforms guycarpenter.
Restraints Impact Analysis*
| Restraint | (~) % Impact on CAGR Forecast | Geographic Relevance | Impact Timeline |
|---|---|---|---|
| Global shortage of skilled incident responders | -2.8% | Global, acute in North America and Europe | Long term (≥ 4 years) |
| High cost of premium IR retainers limiting SME uptake | -1.9% | Global, especially emerging markets | Medium term (2-4 years) |
| Overlap with XDR/SOAR platforms causing buyer confusion | -1.4% | North America and Europe | Short term (≤ 2 years) |
| Zero-trust architectures shortening dwell time, reducing full-scale IR engagements | -1.1% | Global, led by mature markets | Medium term (2-4 years) |
| Source: Mordor Intelligence | |||
Global Shortage of Skilled Incident Responders Constraining Growth
The worldwide cybersecurity workforce gap climbed significantly in 2025, with incident responders among the scarcest skill sets. Staffing deficits raise time-to-contain metrics and inflate breach liabilities; IBM estimates an average USD 1.76 million premium for firms lacking dedicated incident response resources. Outsourcing partners benefit, yet capacity bottlenecks persist during multi-client surge events, spurring investments in AI-driven triage to extend human expertise
High Cost of Premium IR Retainers Limiting SME Adoption
Monthly retainers can range between USD 500 and USD 5,000, a barrier for small enterprises that nonetheless account for nearly half of reported cyber breaches strongdm. Median impact costs of USD 3 million including operational downtime and reputational damage outstrip many SME balance sheets, creating a protection gap where reactive, pay-as-you-go clean-ups remain the only option. Managed security providers are responding with tiered offerings and community-based response models to broaden access without undermining profitability.
*Our forecasts treat driver/restraint impacts as directional, not additive. The impact forecasts reflect baseline growth, mix effects, and variable interactions.
Segment Analysis
By Service Type: Containment Now, MDR Next
Containment and Mitigation captured 32.75% of the incident response services market in 2025, reflecting the urgency to isolate compromised assets before attackers pivot or exfiltrate data. Rapid isolation of endpoints and privileged credentials has become standard practice as median attacker dwell time shrinks. Over the forecast horizon, Managed Detection and Response will expand at a 20.6% CAGR, elevating continuous threat-hunting and proactive remediation from optional add-ons to core contract deliverables.
MDR momentum is powered by AI-assisted analytics that surface anomalies human analysts might miss. Vendors infuse large-language-model copilots that accelerate root-cause discovery and automated playbook execution, slashing response hours. Remediation and Recovery maintain relevance, particularly when regulatory reporting or litigation requires certified evidence handling. Digital Forensics and Analytics is evolving through machine-learning-based pattern recognition, enabling incident responders to reconstruct attacker timelines faster while satisfying evidentiary standards for court proceedings.


By Deployment Mode: Balancing Control and Flexibility
On-Premises installations still held 56.45% share of the incident response services market size in 2025 due to sovereignty mandates and board-level preferences for local custody of sensitive logs. Financial institutions and public agencies continue to limit external data transfers, especially in jurisdictions that prohibit customer information from leaving national borders. Yet cloud-based response tooling will outpace overall growth at a 19.85% CAGR as security teams embrace plug-and-play scalability.
Hybrid deployment models now fuse local log retention with cloud analytics engines, giving organizations the forensic visibility they require without sacrificing elastic compute capacity. Zero-trust philosophies reinforce the shift by de-emphasizing network location as a security boundary and normalizing remote examination of forensic artifacts. Providers differentiate by offering “bring-your-own-key” encryption and in-region data storage to satisfy compliance audits.
By Enterprise Size: Large Budgets, Small-Business Volume
Large Enterprises commanded 71.35% revenue in 2025, having the budget to fund end-to-end response teams that integrate threat intelligence, playbook automation, and crisis communications. Meanwhile, SMEs represent the fastest-growing opportunity at a 18.74% CAGR. The value proposition for smaller firms hinges on pooled SOC resources and cyber-insurance incentives that now require pre-negotiated retainer agreements.
SMEs turn to subscription-based platforms that bundle MDR, incident response, and regulatory reporting in one license. Large enterprises remain innovation drivers, validating advanced use cases such as OT forensics and AI-guided threat prioritization. The incident response services market continues to mature toward outcome-based pricing, where service-level agreements tie fees to containment time or compliance benchmarks.
By End-User Industry: BFSI Leads, Healthcare Surges
Banking, Financial Services, and Insurance retained 23.15% of the incident response services market size in 2025 owing to strict supervisory requirements and the sector’s outsized exposure to financial crime. However, Healthcare and Life Sciences will advance at 19.24% CAGR as patient-safety imperatives and soaring ransomware frequency heighten urgency. Hospital downtime directly threatens clinical care, pushing boards to prioritize guaranteed response SLAs.
Government and Defense agencies accelerate adoption to counter nation-state espionage, while Industrial Manufacturing, Energy, and Utilities seek OT-specific response capabilities that preserve safety and uptime across critical infrastructure. Retail and E-commerce players emphasize customer trust and continuity during peak shopping periods, integrating incident response playbooks with payment system redundancies.
Geography Analysis
North America retained the regional lead with 37.85% incident response services market share in 2025, propelled by mature breach-notification laws and robust security ecosystems. United States financial regulators, such as the New York Department of Financial Services, require formalized incident response plans, reinforcing demand across large banks and fintechs. Canada’s critical-infrastructure directives and Mexico’s expanding fintech rules extend regional volume.
Asia-Pacific is on track for a 20.12% CAGR to 2031. Regulatory harmonization in Japan, Singapore, and Australia now mandates 24-hour breach disclosure and certified response processes, encouraging organizations to secure retainers before incidents occur. The region recorded 34% of global attacks in 2024, intensifying demand for bilingual, cross-jurisdictional responders who can navigate local rules and diverse cloud stacks.
Europe’s compliance-driven adoption accelerates under NIS2, which broadens the scope of “essential entities” and elevates fines for insufficient preparedness. Organizations must harmonize GDPR data-breach reporting with NIS2 security-incident disclosure, fueling bundled privacy-plus-security response engagements. Eastern European members look to consultancies for playbook localization, while larger economies deepen contracts to cover supply-chain and OT threats.
Latin America, the Middle East, and Africa remain nascent but rising. Digital-commerce expansion and new data-protection statutes open opportunities, though budgetary and talent constraints temper immediate growth. International providers partner with local MSSPs to bridge language, culture, and compliance gaps, a model expected to scale as regional investment in cyber resilience continues.
Mordor Intelligence provides coverage of the incident response services market across other key regional markets, including Latin America, each with their regulatory frameworks and demand patterns.

Competitive Landscape
The incident response services market is moderately fragmented. Established vendors such as IBM, CrowdStrike, and Rapid7 integrate AI-driven correlators with broad service portfolios, while niche consultancies focus on vertical specialties like OT or legal-grade forensics. Strategic acquisitions highlight convergence: Zscaler acquired Red Canary in May 2025 to embed MDR into its zero-trust stack, adding USD 140 million in recurring revenue and bolstering 24/7 monitoring.
Platform consolidation favors buyers seeking unified dashboards, streamlined invoicing, and preconfigured workflow integrations. Technology differentiation is shifting to large-language-model copilots that automate evidence triage and draft regulator-ready reports. Disruptors compete on cost-effective retainers for SMEs, offering chat-based incident portals and automated response orchestration.
White-space opportunities lie in supply-chain investigation and OT-centric services. Providers that can validate vendor-risk exposures or run forensics in air-gapped networks will gain share, especially as industrial firms adopt digital twins that require specialized analytic tooling. Alliances between cloud hyperscalers and response boutiques are also emerging, delivering regionally hosted evidence lockers that meet sovereignty conditions while leveraging hyperscale compute for rapid analysis.
Incident Response Services Industry Leaders
CrowdStrike Holdings Inc.
NCC Group plc
Rapid7 Inc.
IBM Corporation
Check Point Software Technologies Ltd.
- *Disclaimer: Major Players sorted in no particular order

Recent Industry Developments
- May 2025: Zscaler acquired Red Canary, adding managed detection and response capabilities and more than USD 140 million in annual recurring revenue.
- April 2025: CyberMaxx purchased Cybersafe Solutions and onShore Security, while Nightwing acquired Roka Security, illustrating ongoing MSSP consolidation.
- March 2025: European Union member states began enforcing the NIS2 directive with penalties up to EUR 10 million for non-compliance.
- February 2025: Cognizant deepened alliances with CrowdStrike and Zscaler to streamline enterprise security transformation services.
- January 2025: The Texas Department of Banking issued Industry Notice 2025-01, emphasizing the need for incident response plans to address sophisticated threats.


Research Methodology Framework and Report Scope
Market Definitions and Key Coverage
Our study defines the incident response services market as all externally sourced professional or managed engagements that help an organization detect, contain, eradicate, and recover from a cyber incident. The universe includes retainers, rapid-response call-outs, digital forensics, and post-incident advisory delivered across on-premises, cloud, or hybrid environments.
Scope exclusion: we exclude software licenses, internal security operations center labor, and wider emergency management services.
Segmentation Overview
- By Service Type
- Containment and Mitigation
- Remediation and Recovery
- Digital Forensics and Analytics
- Managed Detection and Response (MDR)
- Others
- By Deployment Mode
- On-Premises
- Cloud-based
- Hybrid
- By Enterprise Size
- Small and Medium Enterprises
- Large Enterprises
- By End-User Industry
- BFSI
- Government and Defense
- IT and Telecom
- Healthcare and Life Sciences
- Industrial Manufacturing
- Energy and Utilities
- Retail and E-commerce
- Others
- By Geography
- North America
- United States
- Canada
- Mexico
- South America
- Brazil
- Argentina
- Rest of South America
- Europe
- Germany
- United Kingdom
- France
- Spain
- Italy
- Russia
- Rest of Europe
- Asia-Pacific
- China
- Japan
- India
- Australia
- South Korea
- Rest of Asia-Pacific
- Middle East and Africa
- Middle East
- Saudi Arabia
- United Arab Emirates
- Turkey
- Rest of Middle East
- Africa
- South Africa
- Rest of Africa
- Middle East
- North America
Detailed Research Methodology and Data Validation
Primary Research
Our team interviewed North American CISOs, Asia-Pacific managed service leads, European cyber insurance underwriters, and procurement officers in BFSI and healthcare. These conversations confirmed price bands, incident volumes, response hour mixes, and upcoming regulatory triggers, letting us close data gaps and recalibrate assumptions.
Desk Research
We began with desk research. Mordor analysts mapped threat and spending trends through US-CERT breach statistics, ENISA threat landscape reviews, the Verizon DBIR, and national cyber strategy papers, then aligned them with NIST 800-61 and ISO 27035 guidance. Public customs codes for IT security consulting and regional tax filings added trade and revenue clues.
To firm up revenue pools, we parsed listed provider statements in D&B Hoovers, tracked deal announcements in Dow Jones Factiva, and reviewed framework contracts on Tenders Info. These sources form the factual backbone; many other open publications also informed data collection and validation.
Market-Sizing & Forecasting
Sizing starts with a top-down reconstruction of global breach counts and average outsourced response spend per incident, which are then multiplied by regional breach distributions to create demand pools. Supplier roll-ups of sampled retainers and time and materials projects act as a bottom-up reasonableness test. Key model variables include reported breach disclosures, cyber insurance claim payouts, average retainer spend, managed detection penetration rates, and venture funding into IR consultancies. Forecasts rely on multivariate regression that links these variables with macro IT outlays and regulatory milestones, before scenario analysis frames upside or downside bands.
Data Validation & Update Cycle
Outputs run through variance checks against independent cost of breach studies, multi-step analyst reviews, and historic growth ceilings. Reports refresh annually, with interim updates triggered by landmark legislation or material supply side moves, ensuring clients always receive the latest view.
Why Mordor's Incident Response Services Baseline Commands Reliability
Published estimates often diverge because firms slice the pie differently, track distinct revenue streams, and update at uneven cadences. By focusing strictly on paid service engagements and refreshing our model every twelve months, we keep our baseline tightly aligned with economic reality.
Differences grow when others fold in software sales, count internal blue team payroll, or apply blanket growth rates without breach volume validation. Some convert local currencies at outdated averages or lock in single geopolitical scenarios. This is where Mordor Intelligence's stepwise checks and annual refresh lift credibility.
Benchmark comparison
| Market Size | Anonymized source | Primary gap driver |
|---|---|---|
| USD 41.95 B (2025) | Mordor Intelligence | n/a |
| USD 29.46 B (2024) | Global Consultancy A | Bundles IR software with services; uses three-year average FX rates |
| USD 50.85 B (2025) | Industry Association B | Assumes every notifiable breach is fully outsourced; lacks supplier revenue audits |
The comparison shows that scope, input rigor, and update frequency drive sizable swings. By anchoring to verifiable breach economics and audited revenues, Mordor Intelligence delivers a balanced, transparent baseline that decision makers can retrace with confidence.


Key Questions Answered in the Report
What is the current size of the incident response services market?
The incident response services market is valued at USD 49.71 billion in 2026 and is forecast to reach USD 116.17 billion by 2031.
How fast is the market expected to grow?
The market is projected to expand at an 18.52% compound annual growth rate (CAGR) between 2026 and 2031.
Which service category will grow the fastest through 2031?
Managed Detection and Response (MDR) is projected to log the highest growth at a 20.6% CAGR over the forecast period.
Which region is expected to record the strongest growth?
Asia-Pacific leads growth momentum with a 20.12% CAGR through 2031, driven by new cybersecurity regulations in Japan, Singapore, and Australia.
What industry vertical currently dominates spending on incident response services?
Banking, Financial Services, and Insurance holds the largest share at 23.15% of global revenue in 2025, reflecting stringent regulatory requirements.
Why are small and medium enterprises (SMEs) accelerating adoption?
Cyber-insurance policies now require signed response retainers, prompting SMEs to adopt managed services and fueling a 18.74% CAGR in this segment.
Page last updated on:


