
Market Overview
| Study Period | 2021 - 2031 |
|---|---|
| Forecast Data Period | 2026 - 2031 |
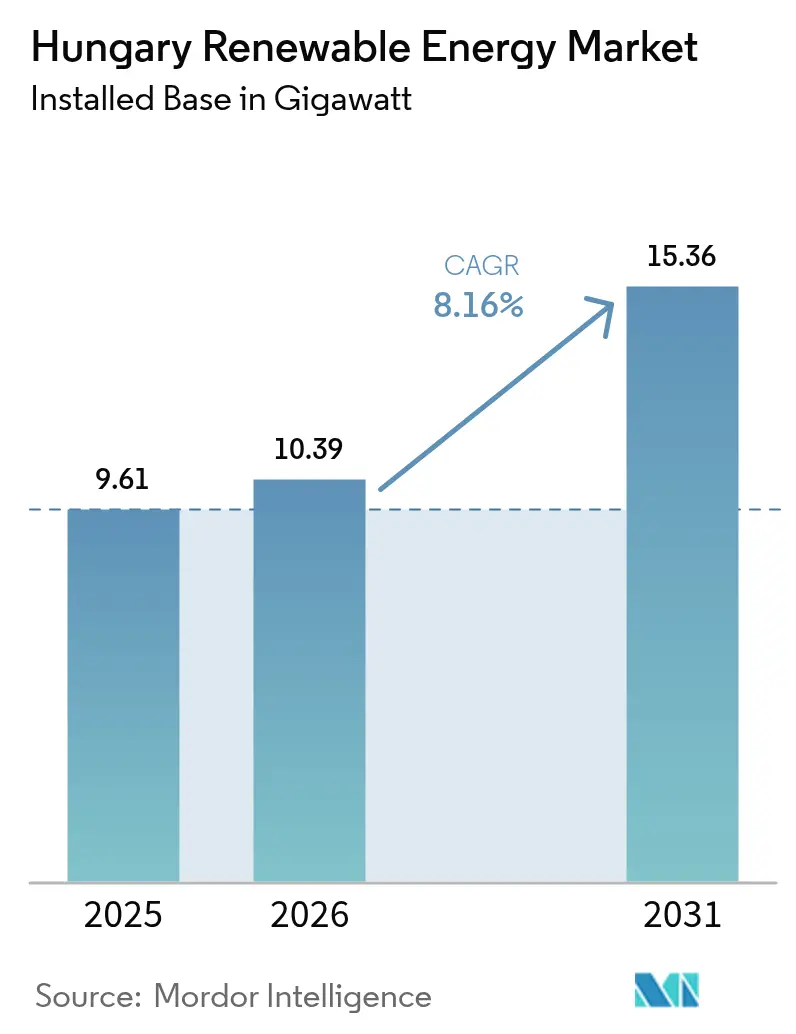
| Base Year Market Size (2025) | 9.61 gigawatt |
| Market Volume (2026) | 10.39 gigawatt |
| Market Volume (2031) | 15.36 gigawatt |
| Growth Rate (2026 - 2031) | 8.16% CAGR |
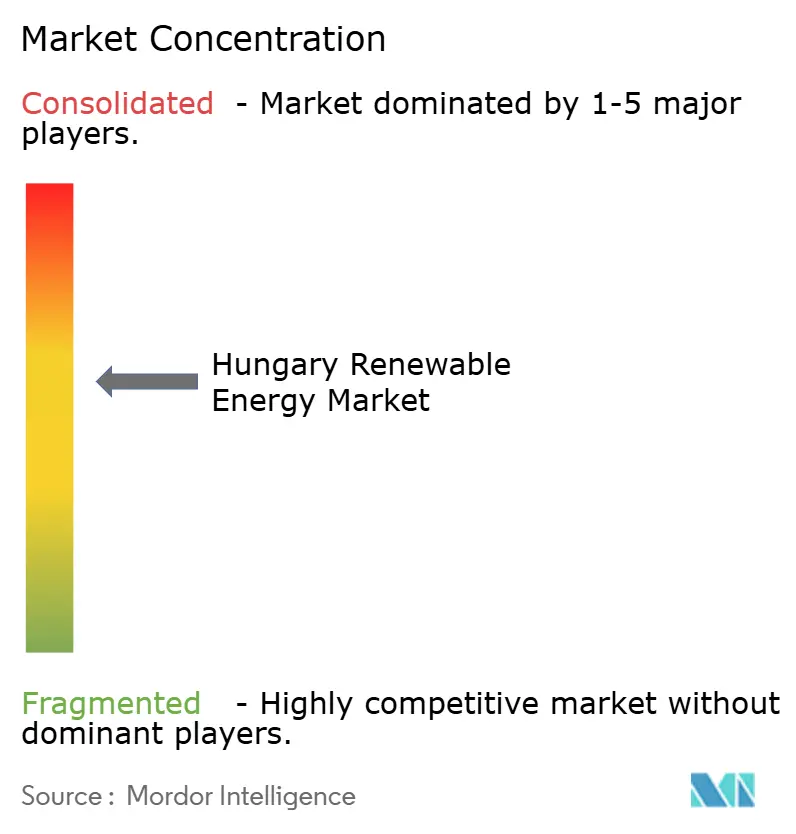
| Market Concentration | Medium |
Major Players *Disclaimer: Major Players sorted in no particular order Image © Mordor Intelligence. Reuse requires attribution under CC BY 4.0. | |
Hungary Renewable Energy Market Analysis by Mordor Intelligence
The Hungary Renewable Energy Market size is expected to grow from 9.61 gigawatt in 2025 to 10.39 gigawatt in 2026 and is forecast to reach 15.36 gigawatt by 2031 at 8.16% CAGR over 2026-2031.
Solar photovoltaic installations dominate capacity, yet geothermal energy is set for the fastest expansion as policy incentives and a robust thermal-well base converge. Battery-storage auctions, a growing pool of long-term corporate power-purchase agreements, and Fit-for-55 obligations are reinforcing the deployment pipeline while tempering merchant-price volatility. Imbalance-day-ahead pricing, effective January 2025, together with 440 MW of state-funded batteries, will encourage developers to consider co-located storage that captures intraday spreads. At the same time, the Robin Hood Tax compresses project margins and redirects some investment from pure merchant solar to sleeved or virtual structures arranged through incumbent utilities.
Key Report Takeaways
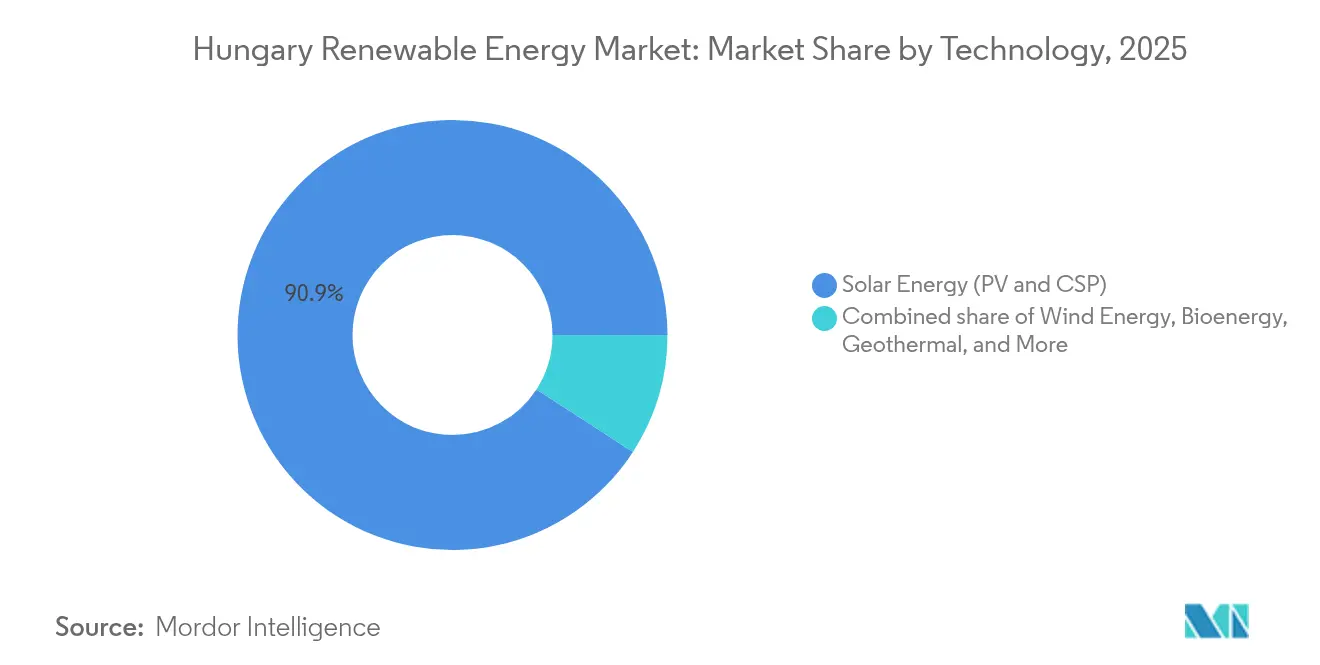
- By technology, solar photovoltaic held a 90.85% capacity share of the Hungary renewable energy market in 2025, while geothermal is projected to advance at a 26.35% CAGR through 2031, the fastest among all sources.
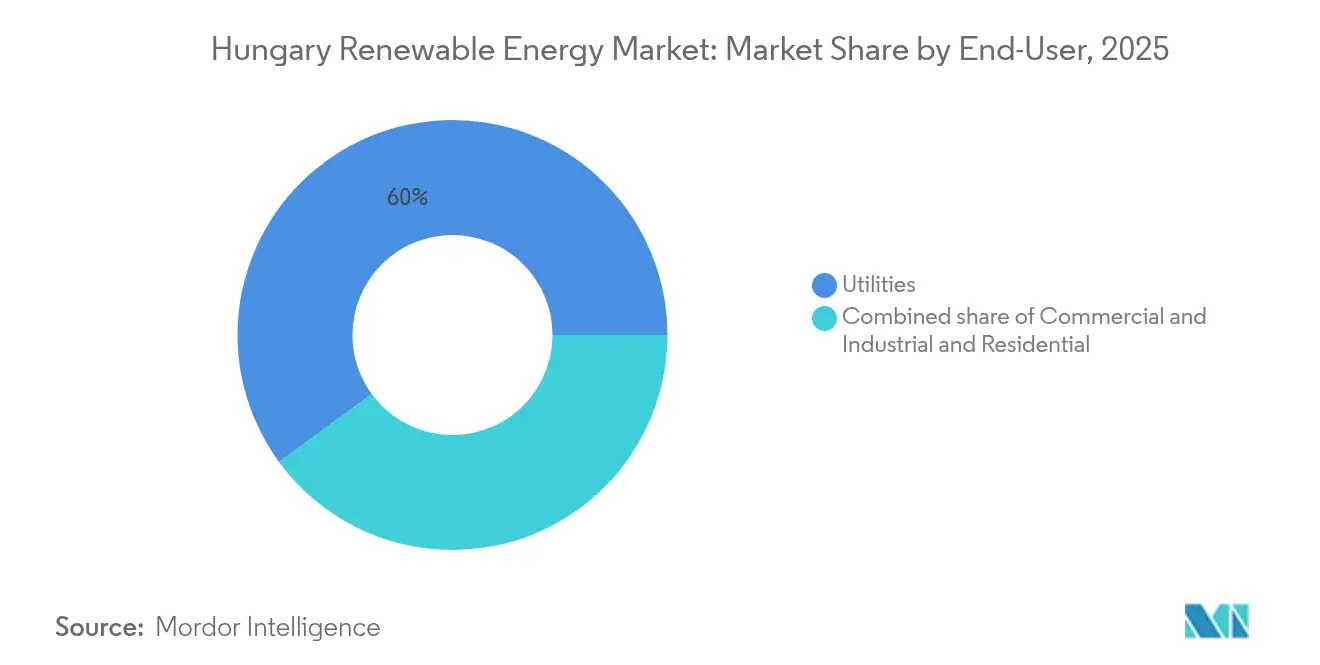
- By end-user, utilities controlled 60.05% of installed capacity in 2025; commercial and industrial off-takers are expected to expand at a 15.22% CAGR to 2031 on the back of automotive and construction PPAs.
- MVM Group, E.ON, and Shanghai Electric collectively accounted for more than 40% of 2024 capacity additions, underscoring their scale advantage in the Hungary renewable energy market.
Note: Market size and forecast figures in this report are generated using Mordor Intelligence’s proprietary estimation framework, updated with the latest available data and insights as of 2026.
Hungary Renewable Energy Market Trends and Insights
Drivers Impact Analysis*
| Driver | (~) % Impact on CAGR Forecast | Geographic Relevance | Impact Timeline |
|---|---|---|---|
| EU "Fit-for-55" incentive structure | 2.1% | National, aligned with EU-wide decarbonization mandates | Long term (≥ 4 years) |
| Declining LCOE of utility-scale solar PV | 1.8% | National, concentrated in southern and eastern regions with higher irradiance | Medium term (2-4 years) |
| Corporate PPA demand from automotive cluster (Audi Győr, Mercedes Kecskemét) | 1.4% | Regional, centered in Győr, Kecskemét, Debrecén industrial zones | Medium term (2-4 years) |
| Grid-flexibility investments via battery-storage tenders | 1.2% | National, prioritizing areas with high solar penetration | Short term (≤ 2 years) |
| EU Recovery & Resilience Facility allocations for renewables | 0.9% | National, with emphasis on residential rooftop solar | Short term (≤ 2 years) |
| Heat-pump electrification boosting renewable demand | 0.7% | National, urban and suburban residential segments | Long term (≥ 4 years) |
| Source: Mordor Intelligence | |||
EU “Fit-for-55” incentive architecture
The Fit-for-55 package requires Hungary to increase its share of renewables to 30% of final consumption by 2030, a doubling of its 2024 share. The updated National Energy and Climate Plan now mandates at least 12 GW of solar capacity, a threshold already exceeded midway through 2024. New legislation caps solar permitting at 24 months and wind at 27 months, yet rural municipalities still rely on paper cadastral records, prolonging approvals. Hungary secured approximately EUR 2.3 billion in Modernisation Fund proceeds, which will be invested in grid reinforcement over the next five years. In parallel, utilities are divesting from fossil fuel assets; the MVM Group has pledged a 50% reduction in emissions by 2035. Taken together, these measures ratchet up compliance pressure and create a durable long-term demand signal for the Hungary renewable energy market. Binding 2030 targets require 42.5% renewable energy in final consumption and tie EUR 76.8 million of Modernisation Fund inflows to capacity milestones. Manufacturers pressured by Scope 2 reporting rules are anchoring new PPA demand, tightening the linkage between policy and project finance.(1)European Commission, “Fit for 55: Delivering the EU Green Deal,” ec.europa.eu
Declining LCOE of utility-scale solar PV
Module oversupply drove polysilicon prices below USD 6/kg in 2024, pulling Hungary’s utility-scale solar LCOE under EUR 40/MWh. Turnkey capital costs fell to EUR 0.8–1.3 million /MW, enabling merchant projects to achieve sub-seven-year paybacks. However, solar’s midday surge pushed wholesale prices negative on 42 days in 2024. That volatility channels developers toward corporate PPAs and battery co-location, even as a new foreign-investment screening rule adds 30–60 days to asset-sale approvals for non-EU buyers. Mid-tier players, such as ABO Wind, delivered 80 MW across five projects in 2024 by pairing expedited permitting with Hungarian EPC services, demonstrating that niche advantages persist despite price compression.
Corporate PPA demand from automotive cluster
Audi, Mercedes-Benz, and BMW collectively consumed 3.5 TWh of electricity in 2024, accounting for 6% of Hungary’s total electricity draw. E.ON inked a 10-year, 100 GWh annual agreement with BMW’s Debrecen plant, while Audi deployed a 16 MW geothermal unit to shrink Scope 2 emissions. Photon Energy, ID Energy, and Axpo have utilized similar PPAs to secure revenue visibility for nearly 200 MW of new build projects. Yet the 31–41% Robin Hood Tax trims contracted prices by EUR 8–12/MWh, nudging developers toward sleeves through incumbent utilities rather than direct bilateral deals. Even so, Axpo closed 60 MW of PPAs outside the automotive sector in 2024, indicating broader industrial participation.
Battery-storage tenders enhancing grid flexibility
MAVIR was awarded 440 MW of battery capacity in 2024, utilizing HUF 62 billion in state grants, a direct response to the 80% increase in long-system hours that year. MET Group’s 40 MW/80 MWh system, co-located with solar, captured frequency-containment revenue sufficient for a 12% internal rate of return without capacity payments. Beginning in 2025, co-located batteries can bid into balancing markets under the same grid-connection contract, reducing interconnection costs by approximately EUR 150,000/MW. The transition from quarter-hour to imbalance-day-ahead settlement is likely to double intraday volatility, thereby reinforcing the economics of storage. Transformer limits in Bács-Kiskun and Csongrád impose an additional EUR 200,000–400,000 per project, making financing channels from the European Investment Bank critical to unlocking latent solar queues.
Restraints Impact Analysis*
| Restraint | (~) % Impact on CAGR Forecast | Geographic Relevance | Impact Timeline |
|---|---|---|---|
| Limited grid hosting capacity in rural substations | -1.3% | Southern and eastern Hungary, particularly Bács-Kiskun, Csongrád, and Békés counties | Medium term (2-4 years) |
| Slow permitting for wind repowering | -0.8% | Northern and western Hungary, existing wind-farm corridors | Long term (≥ 4 years) |
| Rising land-lease costs for solar farms | -0.5% | National, acute in high-irradiance southern regions | Short term (≤ 2 years) |
| Workforce shortages in high-voltage engineering | -0.4% | National, concentrated in transmission-grid expansion zones | Medium term (2-4 years) |
| Source: Mordor Intelligence | |||
Limited grid hosting capacity in rural substations
Many 20 kV networks remain undersized for two-way power flows, resulting in a delay of more than 3 GW of pending solar applications.(2)MAVIR, “Grid Connection Capacity Statement 2025,” mavir.huDistribution assets built for one-way flows now operate at 85–95% of their thermal limits at midday in counties with the highest irradiance. MAVIR introduced a queue system in 2024 that favors projects bundling batteries or demand-response contracts, yet the backlog still topped 2 GW by year-end. Although the European Investment Bank disbursed EUR 200 million in March 2025 for grid upgrades, procurement delays and skilled labor shortages will postpone most reinforcements until 2027. Developers are increasingly siting plants inside automotive clusters or brownfields where spare high-voltage capacity exists, bypassing rural queues altogether.
Slow permitting for wind repowering
Although minimum setback distances dropped from 12 km to 700 m in 2024, multi-agency approvals still extend beyond 24 months, leaving wind at 330 MW against a 1 GW 2030 target.(3)Bird & Bird, “Hungary Eases Wind Turbine Setback Rules,” twobirds.comHungary’s wind fleet has remained frozen at 329 MW since 2024 because repowering timelines stretch to 36–48 months. A 2024 moratorium lift left unclear municipal procedures, Natura 2000 biodiversity tests, and aviation height caps that remove 40% of possible sites. Only one 24 MW repowering in Mosonmagyaróvár secured approval last year, diverting capital toward quicker solar builds. Without a streamlined path, Hungary risks undershooting its 2030 wind target and deepening the solar monoculture risk that already pressures merchant revenues.
*Our forecasts treat driver/restraint impacts as directional, not additive. The impact forecasts reflect baseline growth, mix effects, and variable interactions.
Segment Analysis
By Technology: Solar Dominance Masks Geothermal Emergence
Solar technology contributed 90.85% of installed renewable capacity in 2025, reflecting sub-EUR 1 million/MW build costs and permitting cycles under 18 months. That dominance means the Hungary renewable energy market size for solar alone exceeded 8.7 GW in 2025. Geothermal accounts for less than 1% of capacity today but is forecast to grow at a 26.35% CAGR, enabled by the Jedlik Ányos Program’s EUR 240 million funding pool and more than 200 thermal wells above 70 °C. Audi Győr’s 16 MW geothermal plant, commissioned in 2024, validated industrial-scale heat applications and trimmed the site’s natural-gas demand by 60%.
Solar’s dominance also amplifies volatility: wholesale prices turned negative on 42 days in 2024, eroding merchant returns and accelerating battery pairing. Chinese EPC contractors, such as Shanghai Electric, deliver turnkey parks for under EUR 1 million/MW, undercutting European rivals by 15–20% and capturing roughly a quarter of the 2024 capacity additions. Mid-sized firms, such as ABO Wind, compete by bundling local procurement and permit acceleration, as highlighted by the delivery of 80 MW across five sites last year. Hydropower remains at 0.06 GW due to flat topography; however, the 1 GW Tisza pumped-storage feasibility study, if realized, could help cushion solar oversupply. Bioenergy’s 800 MW dispatchable fleet, led by ALTEO Group, continues to offset intermittency in the Hungary renewable energy market.



By End-User: Utilities Yield Ground to Industrial Procurement
Utilities owned 60.05% of installed capacity in 2025, anchored by MVM Group’s 3 GW solar ambition and a EUR 750 million green bond issued in December 2024 to finance both grid-tied and behind-the-meter assets. The commercial and industrial segment is forecast to post a 15.22% CAGR, increasing its Hungary renewable energy market share beyond 35.40% by 2031 as automotive and materials firms secure 10–15-year PPAs. E.ON’s 100 GWh annual contract with BMW and ID Energy’s 28.5 MWp, 15-year supply deal with Holcim reflect how Scope 2 reporting deadlines under the Corporate Sustainability Reporting Directive have moved PPAs from optional to essential.
The Robin Hood Tax deducts up to 41% of generator revenue, shrinking PPA headroom by EUR 8–12/MWh and prompting more developers to route power through incumbent-utility sleeve structures. Residential uptake is smaller but rising, as EUR 415 million of EU Recovery & Resilience funds subsidize 31,000 rooftop systems, paired with heat pumps that deepen electrification. Land-lease prices for greenfield solar climbed 30% in 2024, steering developers toward industrial rooftops, brownfields, and agrivoltaic concepts on marginal plots where lease costs remain well below Western European averages.
Geography Analysis
The southern and eastern counties, including Bács-Kiskun, Csongrád, Békés, and Hajdú-Bihar, contributed roughly 60% of the 1.3 to 1.4 GW of new solar capacity in 2024, as irradiance exceeds 1,400 kWh/m² and land availability is higher than in the northwest, according to KSH.HU. Grid hosting limits now require developers to finance transformer upgrades, costing EUR 200,000 to 400,000 per project, a burden partially offset by the European Investment Bank’s March 2025 credit line. The Hungary renewable energy market size in these four counties already exceeds 5.24 GW, equal to more than one-third of national capacity.
Northwest Hungary is home to the legacy 329 MW wind fleet, concentrated in the Kisalföld corridor, alongside growing behind-the-meter solar installations tied to the Győr and Mosonmagyaróvár automotive hubs. These industrial nodes offer spare high-voltage lines, allowing developers to bypass rural connection queues. Central Hungary, including Budapest, leads in residential rooftops after attracting a large share of the 31,000 EU-supported household systems approved in 2024. Meanwhile, geothermal wells cluster in Szeged, Hódmezővásárhely, and Szentes, anchoring district-heating schemes that could evolve into electricity generation if reservoir temperatures allow.
Cross-border lines with Austria, Slovakia, Romania, and Serbia make Hungary a regional transit hub; however, its export potential is constrained during solar peaks when north–south lines reach their thermal limits. MAVIR’s adoption of imbalance-day-ahead pricing in 2025 should reduce speculative long positions and sharpen dispatch signals, but the effectiveness hinges on synchronous investment in interconnectors, an area highlighted in EIB-financed grid-reinforcement plans. The proposed 1 GW Tisza pumped-storage plant, located near the Romanian border, could supply critical east-west balancing and enhance the Hungary renewable energy market’s flexibility profile if feasibility tests prove favorable.
Regulatory Landscape
Hungary’s renewable market operates within an EU-led energy and climate obligations framework, implemented through national energy law and secondary regulations. The Magyar Energetikai és Közmű-szabályozási Hivatal (MEKH), established under Act XXII of 2013, functions as the independent energy regulator for licensing, supervision, and tariff-related matters, while MAVIR (TSO) manages system operation and grid-connection processes. Licensing is tiered by plant size, with generation projects above 0.5 MW requiring licensing, a simplified combined procedure generally applied for 0.5 MW to 50 MW, and projects above 50 MW typically requiring separate establishment and operation licenses.
Support and market integration rules keep adjusting to system-balancing needs and cost-control priorities. Government Decree 26/2025, effective March 1, 2025, revised the METAR/KAT renewable support framework, enabling eligible renewable generators (generally from 0.5 MW) to participate in a premium (FIP) structure where electricity is sold on the market and supplemented by a premium, subject to compliance requirements. Act XCVI of 2025 adds implementation milestones that affect both developers and network operators, including obligations tied to an energy data platform. The MEKH president is required to publish specified implementing regulations by December 15, 2026, and network licensees must conclude service contracts with the energy data platform operator by December 31, 2026, reinforcing digitalized data reporting and grid transparency requirements.
Competitive Landscape
The Hungary renewable energy market shows moderate fragmentation. MVM Group remains the largest developer-operator, helped by sovereign backing and a EUR 750 million green bond that funds its 3 GW solar target and battery co-location strategy. Chinese EPC outfits, Shanghai Electric, China National Machinery Import & Export, and GCL System Integration, captured roughly 25–30% of 2024 turnkey contracts by offering capital costs 15–20% below European averages, as validated by the 200 MW Tokaj project, which achieved grid parity at under EUR 1 million/MW.
European utilities such as E.ON and RWE Renewables pivot toward long-term corporate PPAs to hedge price risk, exemplified by E.ON’s 100 GWh deal with BMW and RWE’s Kaposvár solar farm. Mid-tier developers, ABO Wind, Photon Energy, and ALTEO Group, have carved defensible niches in expedited permitting, local-content procurement, and O&M services; ABO Wind delivered 80 MW across five sites in 2024, while Photon Energy inked 48 MWp of O&M contracts with REDSIDE. MET Group differentiates through storage; its 40 MW/80 MWh battery achieved a 12% IRR without capacity payments, and the regulatory waiver for dual-use grid connections from 2025 further bolsters its economics.
White-space opportunities span geothermal district heating and agrivoltaics; Audi Győr’s geothermal plant demonstrates industrial scalability, while rising land rents in prime solar zones are steering investors to marginal farmland, where agrivoltaic leases remain inexpensive. The Robin Hood Tax, however, squeezes pure-play IPPs and pushes them into partnership models with utilities that can absorb revenue shocks. Smaller firms, such as NRGene Renewable and Duna Solar, focus on sub-10 MW rooftop and community projects to avoid grid queues, although their cumulative footprint remains under 50 MW.
Hungary Renewable Energy Industry Leaders
MVM Group
MET Holding AG
ALTEO Group
E.ON Hungary
Statkraft Markets GmbH
- *Disclaimer: Major Players sorted in no particular order

Market Opportunities and Future Outlook
System flexibility and grid enablement represent the most actionable whitespace as Hungary’s solar-heavy buildout meets connection queues and merchant price volatility. MAVIR’s award of 440 MW of state-funded batteries in 2024, together with the change allowing co-located batteries to bid into balancing markets under the same grid-connection contract from 2025, gives developers a clearer basis to package storage with generation to strengthen bankability and improve queue positioning. On the grid side, the March 2025 European Investment Bank disbursement for upgrades referenced in the report context, along with EU funding allocations for network reinforcement, supports a workable pipeline for substation, transformer, and connection-related work. This creates scope to focus interconnections on brownfield and industrial nodes, including around Gyor, Kecskemet, and Debrecen, where developers may be able to bypass rural hosting constraints.
A second opportunity corridor is shifting generation mix beyond solar, supported by permitting and policy changes that reopen wind activity and scale geothermal use cases. The 2024 reduction in wind turbine setback distances from 12 km to 700 m, alongside the stated plan to tender at least 700 MW of wind capacity with a scheduled date of August 31, 2026, provides a near-term pathway for repowering and new-build wind tied to system value from evening and winter output. At the same time, geothermal scaling is reinforced by industrial proof points and dedicated funding, including Audi Gyor’s 16 MW geothermal unit commissioned in 2024 and the Jedlik Anyos Program funding pool highlighted in the report context, which supports district-heating expansions and higher-utilization baseload renewable output. Corporate procurement adds a further lane, with E.ON’s 10-year, 100 GWh annual agreement with BMW’s Debrecen plant and other multi-year PPAs cited in the report context indicating continued room for sleeved or utility-intermediated structures that accommodate the Robin Hood Tax while securing long-duration offtake for new projects.
Recent Industry Developments
- April 2026: ALTEO commissioned its sixth electricity storage facility in Gyor, adding a 20 MWh battery asset to its operating portfolio. The commissioning deepens the company’s role in grid-balancing services and reinforces the shift toward pairing renewables with flexible capacity to manage solar-driven volatility.
- March 2025: MVM Group installed a 20 MWh electricity storage facility in Sopronkovesd. The project adds operational flexibility in western Hungary and supports faster integration of additional solar capacity by strengthening local balancing and congestion management capabilities.
- August 2024: MET Group inaugurated the Kaba II Solar Park in eastern Hungary with 23.4 MWp of installed capacity. The commissioning expands utility-scale PV output while showing continued investor focus on buildable, grid-connected solar sites despite rising curtailment and intraday price swings.


Research Methodology Framework and Report Scope
Market Definition and Coverage
For this study, the Hungary renewable energy market is defined as the total installed renewable power capacity connected in Hungary, counted across major renewable technologies and measured in gigawatts.
Scope exclusions: Fossil fuel generation capacity and purely off-grid equipment that is not commissioned for grid supply are not counted in the market total.
Segmentation Overview
- By Technology
- Solar Energy (PV and CSP)
- Wind Energy (Onshore and Offshore)
- Hydropower (Small, Large, PSH)
- Bioenergy
- Geothermal
- Ocean Energy (Tidal and Wave)
- By End-User
- Utilities
- Commercial and Industrial
- Residential
Data Sources, Market Sizing, and Validation
Desk Research
Desk work started with building the baseline picture of Hungary power generation and renewables using public, checkable sources. We reviewed statistics and policy documents from sources such as Eurostat, IRENA, the European Commission energy pages, and publications from the Hungarian energy regulator and the national TSO, which helped us pin down reported capacity series and timing.
Next, the market narrative and assumptions were checked against project and company level signals such as annual reports, investor presentations, grid connection updates, and reputable press coverage. Where needed, a paid subscription focused on company financials and a patent database were used to cross-check ownership changes, development activity, and technology direction without relying on a single dataset. The sources listed above are illustrative only, and other public materials were also used for data collection, validation, and clarification.
Primary Interviews and Surveys
Primary work focused on validating what is actually commissioned versus what is still in planning, and on aligning assumptions such as commissioning lags and curtailment risk. We spoke with a mix of developers, EPC and O&M participants, utilities, commercial buyers, and sector advisors, and feedback was balanced across the main European sub-regions so the model did not lean on one viewpoint.
Distribution of primary research fieldwork respondents
| Company type | Respondent position | Region |
|---|---|---|
| Top tier: 31% | CXOs: 12% | APAC: 48% |
| Mid tier: 54% | Functional/Unit leaders: 42% | EMEA: 32% |
| Smaller Players: 15% | Managers: 46% | Americas: 20% |
Market-Sizing & Forecasting
The core sizing logic uses a top-down approach where official capacity series and grid-connected additions are reconstructed into a consistent installed base for each year, and the total is then rolled up to the country market value in GW. To keep the numbers grounded, we also ran selective bottom-up checks such as sampling announced projects and applying realistic capacity ranges, and then pressure-testing totals with channel feedback.
A few inputs carry most of the sizing weight, so they were handled carefully and documented for repeatability. These include yearly renewable capacity additions, technology mix shifts (especially solar and wind share), permitting and grid connection timelines, repowering or replacement patterns, and policy-driven triggers like auction schedules and support scheme changes. For forecasting, scenario analysis was used because the next few years are sensitive to grid readiness and policy execution, and those variables were validated through expert views before the final curve was set. When project-level details were incomplete, gaps were handled using conservative commissioning ratios by technology and by typical project size, which were then rechecked in follow-up calls.
Data Validation & Update Cycle
Outputs were cross-checked against independent signals such as reported national capacity totals, technology splits, and year-over-year addition patterns, and then variances were reviewed until the drivers were clearly explained. If a modeled jump could not be supported by permitting, grid, or commissioning cues, the assumptions were revisited and experts were re-contacted.
Before sign-off, the model goes through multiple analyst reviews so formulas, units, and year mappings stay consistent. The report is refreshed annually, and interim updates are made when material events occur, such as major policy changes or unusually large commissioning waves. Right before delivery, a final update pass is completed to reflect the latest publicly available developments.
Mordor Intelligence's Hungary Renewable Energy Market Sizing Compared With Other Published Estimates
Published market sizes for Hungary renewables can look far apart because the unit of measurement and what gets counted as renewable supply is not handled the same way across sources. Differences show up quickly when one estimate is built on installed capacity, while another is built on revenues, pipeline expectations, or a broader energy transition scope.
The main gap comes from mixing installed capacity with dollar value reporting, where Mordor Intelligence treats the market as grid connected renewable installed capacity in GW, and it avoids folding in project pipeline value, electricity sales, or equipment revenues into the same headline number.
Benchmark comparison
| Source | Market Size | Gaps in Research Methodology |
|---|---|---|
| Mordor Intelligence | USD 9.61 B (2025) | |
| Industry Listing A | USD 4.74 B (2025) | Uses an installed base figure that appears to count a narrower set of renewable technologies or commissioning statuses, which can understate totals when solar additions are counted differently. |
| Market Publisher B | USD 4.80 B (2026) | Reports a revenue-sized market in USD and applies a longer horizon growth view, which is not directly comparable to a GW based installed capacity model and can shift the headline depending on pricing and scope. |
The table shows that the spread is mainly driven by what is being measured and what sits inside the headline scope. By keeping the market tied to commissioned capacity, and then checking key assumptions like commissioning pace and technology mix with interviews, the final number stays traceable to clear inputs and can be repeated year to year.


Key Questions Answered in the Report
What is the projected capacity of Hungary’s renewables by 2031?
Aggregate renewable capacity is forecast to reach 15.36 GW by 2031, expanding at an 8.16% CAGR.
Which technology currently leads new builds in Hungary?
Solar photovoltaic dominates, representing 90.85% of installed renewable capacity in 2025.
How fast will geothermal energy grow through 2031?
Geothermal installations are expected to expand at a 26.35% CAGR thanks to the Jedlik Ányos funding program and more than 200 high-temperature wells.
Why are corporate PPAs becoming popular among Hungarian industries?
EU sustainability reporting rules, coupled with negative midday power prices, make 10–15-year PPAs a hedge against Scope 2 emissions and tariff volatility.
How does the Robin Hood Tax affect renewable investment?
The tax reduces revenue by up to 41%, shrinking PPA headroom and steering projects toward sleeved structures with incumbent utilities to manage risk.
Page last updated on:






