Supply Chain Big Data Analytics Market Size and Share
Market Overview
| Study Period | 2020 - 2031 |
|---|---|
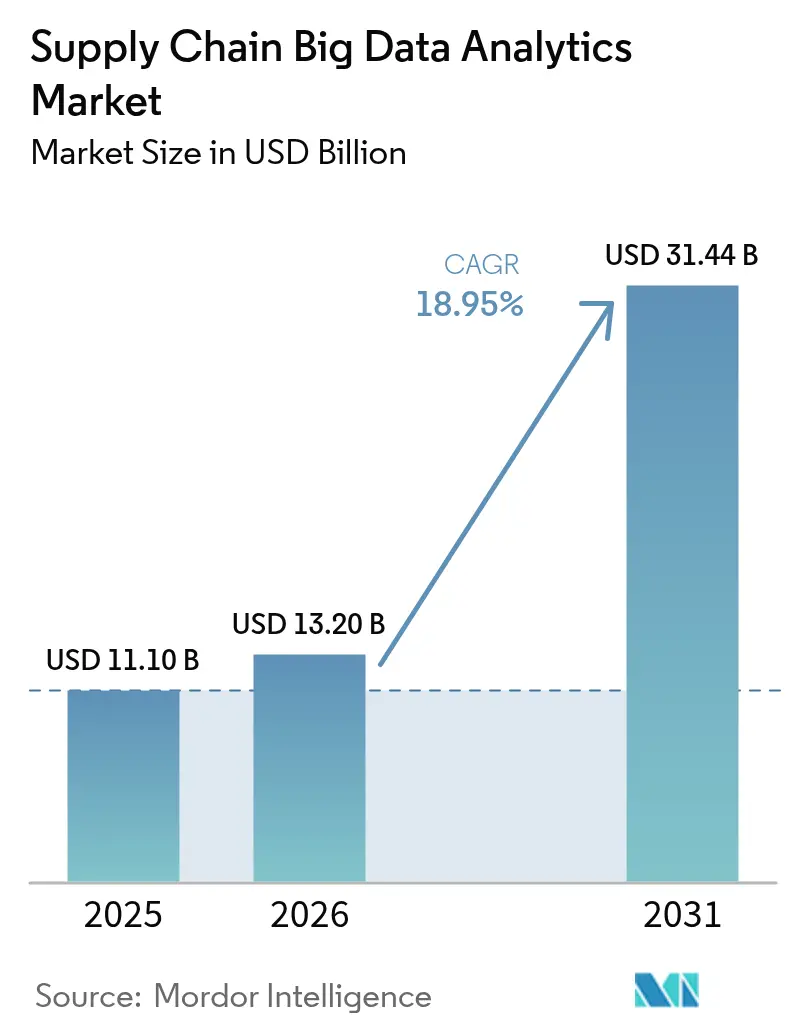
| Market Size (2026) | USD 13.2 Billion |
| Market Size (2031) | USD 31.44 Billion |
| Growth Rate (2026 - 2031) | 18.95% CAGR |
| Fastest Growing Market | Asia Pacific |
| Largest Market | North America |
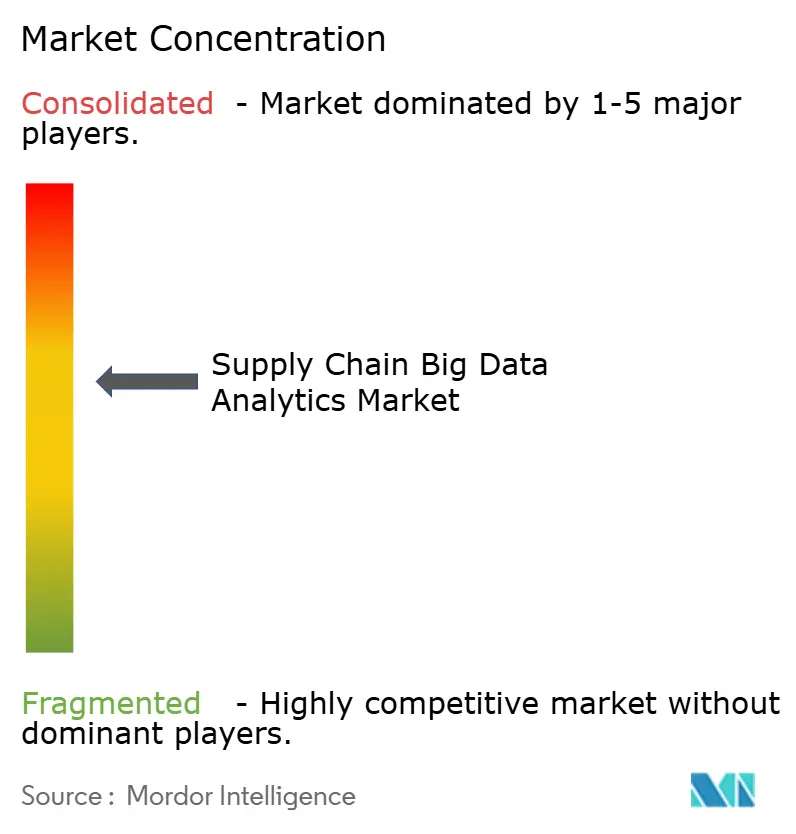
| Market Concentration | Medium |
Major Players *Disclaimer: Major Players sorted in no particular order Image © Mordor Intelligence. Reuse requires attribution under CC BY 4.0. | |
Supply Chain Big Data Analytics Market Analysis by Mordor Intelligence
The Supply Chain Big Data Analytics market size is expected to grow from USD 11.10 billion in 2025 to USD 13.20 billion in 2026 and is forecast to reach USD 31.44 billion by 2031 at 18.95% CAGR over 2026-2031. This momentum reflects surging omni-channel retail complexity, fast-growing IoT telemetry volumes, and the rapid fall in cloud-data-warehouse costs, each pushing enterprises toward real-time, data-driven orchestration. Regulatory mandates such as the EU Deforestation Regulation and the FDA Food Safety Modernization Act Section 204 intensify demand for end-to-end visibility tools that can process multi-tier supplier data. North America presently leads adoption, while Asia Pacific shows the steepest growth curve, driven by manufacturing expansion and e-commerce acceleration. Investment activity remains strong, with large funding rounds for transparency, risk intelligence, and demand-forecasting platforms confirming investor confidence in AI-first analytics propositions.
Key Report Takeaways
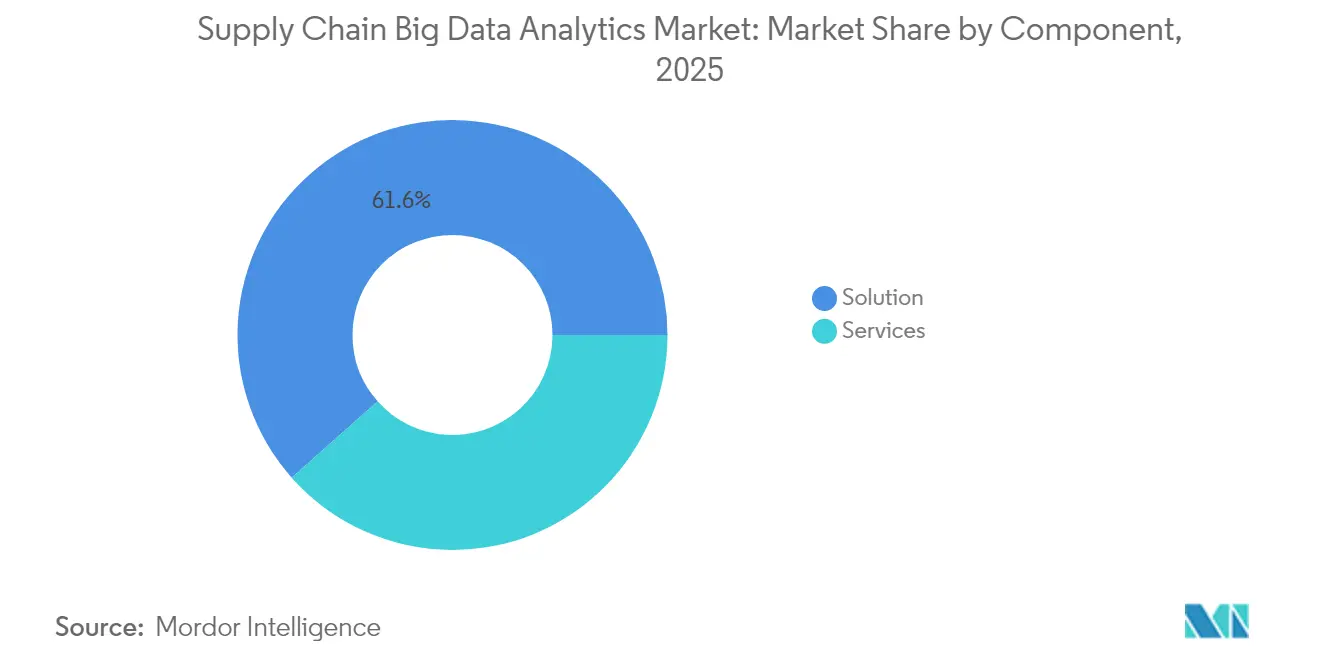
- By component, solution offerings held 61.55% of the supply chain big data analytics market share in 2025, while service-based offerings are projected to have a 19.32% CAGR through 2031.
- By end user, retail led with 33.10% revenue share in 2025; healthcare is advancing at a 20.60% CAGR through 2031.
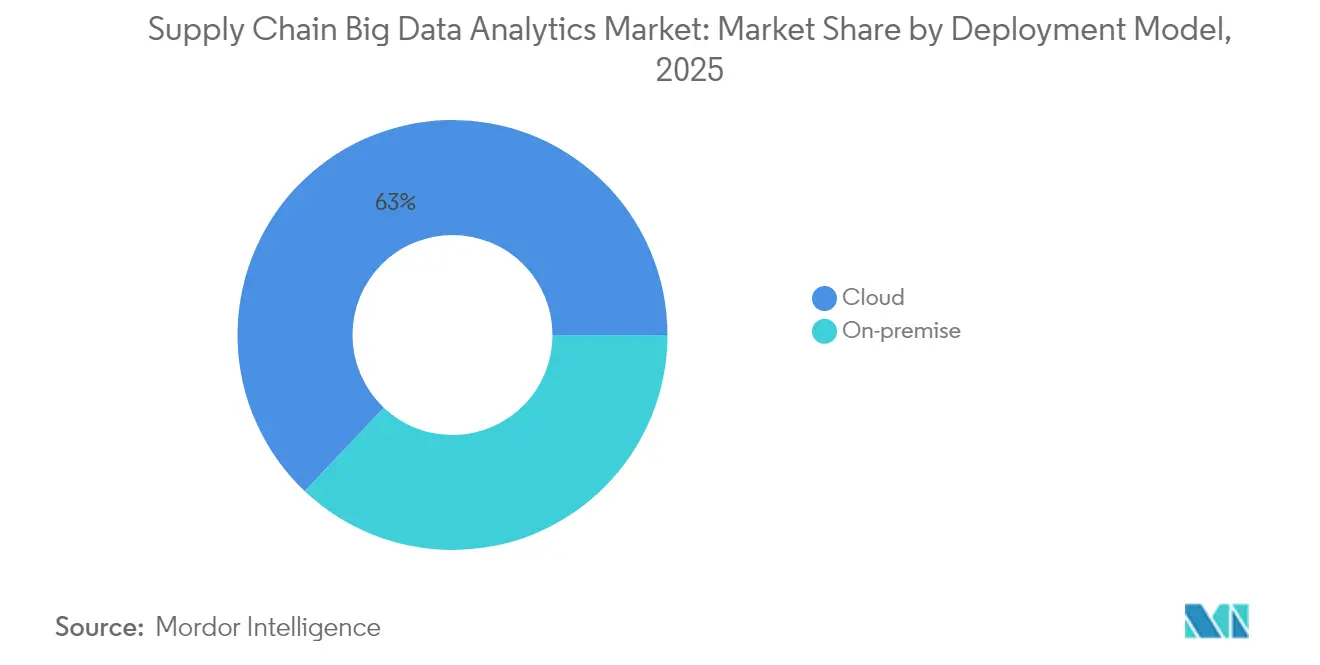
- By deployment model, cloud platforms accounted for 62.95% of the supply chain big data analytics market size in 2025 and are expanding at a 21.60% CAGR to 2031.
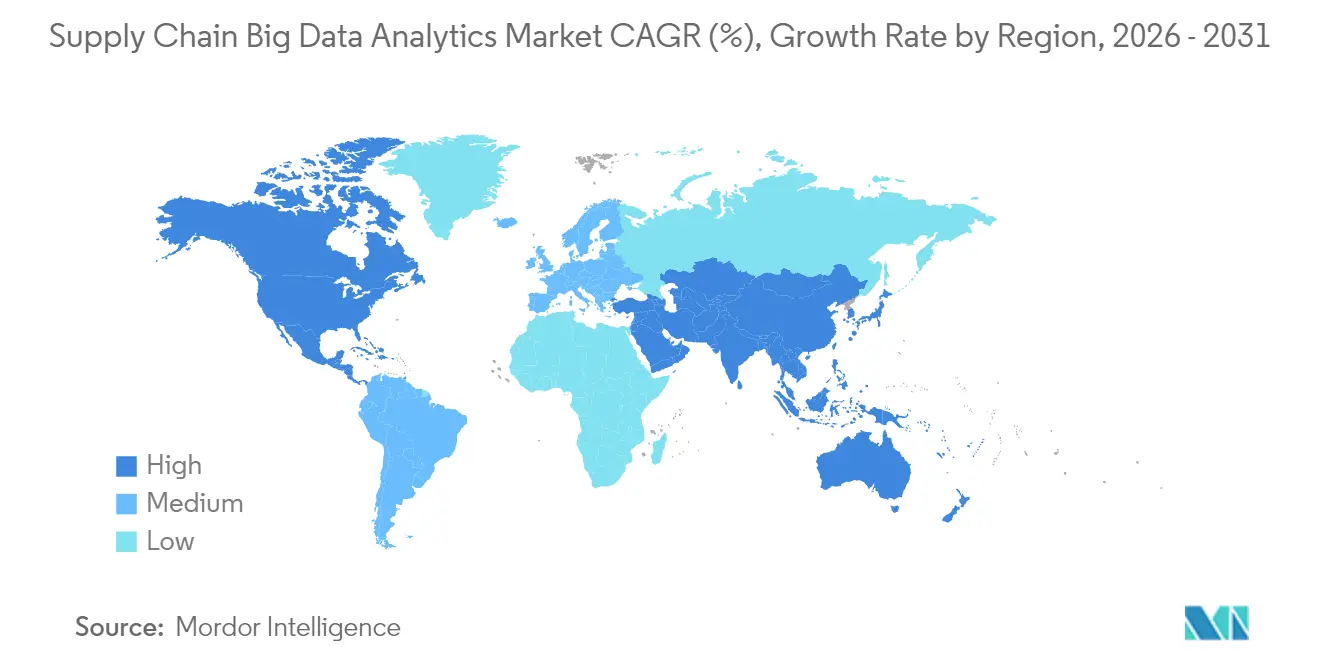
- By geography, North America commanded 42.40% share of the supply chain big data analytics market size in 2025, whereas the Asia Pacific is posting the highest regional CAGR at 21.15% to 2031.
Note: Market size and forecast figures in this report are generated using Mordor Intelligence’s proprietary estimation framework, updated with the latest available data and insights as of 2026.
Global Supply Chain Big Data Analytics Market Trends and Insights
Drivers Impact Analysis*
| Driver | (~) % Impact on CAGR Forecast | Geographic Relevance | Impact Timeline |
|---|---|---|---|
| Surging omni-channel complexity | +3.2% | North America, Europe, spill-over global | Medium term (2-4 years) |
| Proliferation of IoT telemetry in logistics | +2.8% | Asia Pacific core, spill-over North America | Short term (≤2 years) |
| Falling cloud-data-warehouse costs | +2.1% | Global | Short term (≤2 years) |
| Regulatory push for supply-chain traceability | +1.9% | Europe, North America, expanding Asia Pacific | Long term (≥4 years) |
| Rise of digital twin control towers | +1.7% | North America, Europe, early adoption Asia Pacific | Medium term (2-4 years) |
| Carbon-credit-linked freight optimization | +1.5% | Europe leading, North America following | Long term (≥4 years) |
| Source: Mordor Intelligence | |||
Surging Omni-Channel Complexity
Retailers manage store, e-commerce, marketplace, and direct-to-consumer flows simultaneously, generating multi-petabyte data volumes that require real-time inventory algorithms. Walmart and Target each process more than 2.5 petabytes of supply data daily, prompting adoption of integrated planning platforms that synchronize demand signals and cut out-of-stock incidents by 30-40% [1]Editorial Board, “Digital Manufacturing in 2024: Industry 4.0 Paves Path for Business Resilience and Growth,” Manufacturing Today India, manufacturingtodayindia.com.
Proliferation of IoT Telemetry in Logistics
Logistics operators deployed more than 1.2 billion IoT devices in 2024, each sending 25-30 data points per minute. Advanced analytics predicts equipment failures, optimizes fuel through live routing, and assures cold-chain integrity, delivering 20-30% maintenance cost cuts and 95% compliance for temperature-sensitive freight.
Falling Cloud Data-Warehouse Costs
Between 2022-2024, unit costs fell 40-50% as Snowflake, Amazon Redshift, and Google BigQuery competed on price-performance. Mid-market firms now access elastic compute that trims total ownership costs by up to 70% versus on-premise stacks, while halving time-to-insight [2]Product Team, “Snowflake Performance Benchmarks,” Snowflake, snowflake.com . Organizations can now leverage modern cloud platforms for elastic scaling, enabling them to handle peak workloads during demand planning cycles and scale down during regular operations. This shift has led to a significant reduction in total ownership costs, with savings of 60-70% compared to traditional on-premise architectures.
Regulatory Push for Supply-Chain Traceability
The EU Deforestation Regulation and FDA FSMA Section 204 require digital chain-of-custody records, pushing firms toward blockchain-ready analytics that sustain 90%+ compliance and reduce audit prep time by one-quarter. Organizations must now adopt comprehensive visibility systems to monitor products from raw material sourcing to final delivery. This shift generates vast datasets, necessitating advanced analytics for regulatory compliance.
Restraints Impact Analysis*
| Restraint | (~) % Impact on CAGR Forecast | Geographic Relevance | Impact Timeline |
|---|---|---|---|
| Integration and data-quality hurdles | -2.3% | Global, acute in legacy-heavy industries | Medium term (2-4 years) |
| Shortage of analytics talent | -1.8% | North America and Europe, emerging in APAC | Long term (≥ 4 years) |
| High TCO for real-time streaming stacks | -1.4% | Global, particularly SMEs in emerging markets | Short term (≤ 2 years) |
| Cyber-insurance exclusions for data-lake breaches | -1.1% | North America and Europe, expanding globally | Medium term (2-4 years) |
| Source: Mordor Intelligence | |||
Integration and Data-Quality Hurdles
Enterprises juggle 15-25 legacy systems with incompatible schemas, leading to six-to-twelve-month integration delays and forcing teams to spend up to 60% of analytics budgets on data cleansing before realizing value [3]John D. Schulz, “Three Steps Manufacturers Need to Take Before Investing in AI,” SupplyChainBrain, supplychainbrain.com. Data quality issues, such as duplicate records, missing values, inconsistent naming conventions, and outdated information, can diminish analytics accuracy by 20-30%. This undermines confidence in both predictive models and prescriptive recommendations.
Shortage of Analytics Talent
Organizations grapple with a global shortage of data scientists, machine learning engineers, and supply chain analytics specialists, hampering market growth. These roles demand a unique blend of advanced mathematics and in-depth knowledge of logistics, procurement, manufacturing, and distribution. This specialized expertise results in a limited talent pool, driving up salary expectations.
*Our forecasts treat driver/restraint impacts as directional, not additive. The impact forecasts reflect baseline growth, mix effects, and variable interactions.
Segment Analysis
By Component: Solutions Build the Core of Analytics Adoption
Solutions captured 61.55% of the supply chain big data analytics market share in 2025 by bundling procurement planning, manufacturing analytics, and transportation optimization into unified suites. Manufacturing analytics modules gain traction as Industry 4.0 initiatives link shop-floor sensors to predictive models. Transportation tools are equally in demand as e-commerce growth multiplies last-mile deliveries.
The services segment grows at a 19.32% CAGR as enterprises call on system integrators for data migration, model calibration, and round-the-clock support. Hybrid cloud and generative-AI workloads amplify complexity, widening the gap between packaged software and client customization needs.


By End User Industry: Retail Dominance Meets Healthcare Acceleration
Retail accounted for 33.10% of the supply chain big data analytics market size in 2025 as omni-channel leaders embedded AI-driven forecasting that lifts prediction accuracy by up to 30%. Transportation and manufacturing follow, investing heavily in route and plant optimization.
Healthcare is the fastest-growing segment at a 20.60% CAGR. Cold-chain monitoring, pharmaceutical serialization, and strict regulatory audits push hospitals and drug makers toward sensor-rich visibility platforms that secure patient safety while reducing spoilage.
By Deployment Model: Cloud Scaling Sets the Pace
Cloud deployments held 62.95% share of the supply chain big data analytics market size in 2025 and are expanding at 21.60% CAGR, driven by elastic scaling and consumption-based pricing that aligns spend with peaks in S and OP cycles. Global control towers now leverage embedded AI services for predictive ETAs and automated exception handling.
On-premise environments remain where data sovereignty or latency constraints matter. Hybrid and edge architectures bridge plant-floor processing with cloud-level scenario simulations, protecting sensitive data while enabling global optimization.
Geography Analysis
North America led with 42.40% of the supply chain big data analytics market share in 2025, owing to early digital-twin pilots and a mature cloud landscape. US manufacturers extend analytics into nearshored Mexican plants to improve quality yields, while Canadian energy operators optimize pipeline maintenance through predictive models.
Asia Pacific is growing at a 21.15% CAGR. China funds smart-factory roll-outs and cross-border e-commerce corridors that demand high-speed analytics. India accelerates retail and pharma use cases, whereas Japan and South Korea refine automotive and electronics supply chains through AI-powered scheduling. Government incentives and cloud-native startups make adoption cost-effective.
Europe maintains steady uptake under stringent sustainability and data-privacy rules. German auto and machinery exporters rely on plant-level analytics to protect global competitiveness. UK retailers integrate AI demand-planning tools to navigate volatile consumer sentiment, while EU-wide traceability laws spur investment in blockchain-enabled visibility platforms.

Competitive Landscape
The supply chain big data analytics market features moderate concentration. Enterprise software giants SAP, IBM, Oracle, and Microsoft bundle analytics with existing ERP or cloud contracts, leveraging account control. Pure-play vendors Blue Yonder, Manhattan Associates, and Kinaxis focus on deep optimization for planning and fulfillment. All parties now embed generative AI copilots as baseline functionality.
Strategic alliances reshape competition. Kinaxis partnered with ExxonMobil to co-develop energy-sector planning tools, while OMP piloted generative AI with Fortune 500 firms to speed scenario modeling. Vendors increasingly quantify outcomes, inventory turns, service levels, and CO₂ cuts to differentiate beyond feature parity.
Venture-backed disruptors Altana, Impact Analytics, and Everstream Analytics target transparency, demand sensing, and risk intelligence niches, drawing sizeable funding that presses incumbents to accelerate merger and acquisitions or white-label integrations. Consolidation is expected among providers unable to meet escalating client expectations for autonomous decision support.
Supply Chain Big Data Analytics Industry Leaders
IBM Corporation
Oracle Corporation
SAP SE
Kinaxis Inc.
Microsoft Corporation
- *Disclaimer: Major Players sorted in no particular order

Recent Industry Developments
- March 2025: Kinaxis launched “Planning One for Infor CloudSuite” to combine ERP and AI-driven orchestration for discrete manufacturers.
- January 2025: Blue Yonder released AI-powered planning updates covering 8,000 workstreams across demand, supply, and IBP.
- October 2024: Kinaxis signed a co-development deal with ExxonMobil to create energy-sector planning solutions.
- May 2024: Manhattan Associates unveiled Manhattan Active Supply Chain Planning with embedded GenAI assistants.
- May 2024: OMP enabled Kraft Heinz’s intelligent supply chain through its Unison Planning platform.


Global Supply Chain Big Data Analytics Market Report Scope
Supply chain analytics solutions can aid enterprises in achieving growth, enhancing profitability, and increasing market shares by utilizing derived insights for making strategic decisions. These solutions can also offer a holistic view of the supply chain and help enhance sustainability, reduce inventory costs, and accelerate time-to-market for products in the long run. The Supply Chain Big Data Analytics Market is segmented by Type (Solution, Service), End User (Retail, Manufacturing, Transportation and Logistics, Healthcare, Other End Users), and Geography (North America, Europe, Asia Pacific, Latin America, and Middle East and Africa)
The market sizes and forecasts are provided in terms of value (USD million) for all the above segments.
| Solution | Supply-Chain Procurement and Planning Tools |
| Sales and Operations Planning | |
| Manufacturing Analytics | |
| Transportation and Logistics Analytics | |
| Inventory Planning and Optimization | |
| Service | Professional Services |
| Support and Maintenance |
| Retail |
| Transportation and Logistics |
| Manufacturing |
| Healthcare |
| Other end-user Industries (Consumer-Packaged Goods, Energy and Ultilities, etc.) |
| On-premise |
| Cloud |
| North America | United States |
| Canada | |
| Mexico | |
| South America | Brazil |
| Argentina | |
| Rest of South America | |
| Europe | United Kingdom |
| Germany | |
| France | |
| Italy | |
| Rest of Europe | |
| Asia Pacific | China |
| Japan | |
| South Korea | |
| India | |
| Rest of Asia Pacific | |
| Middle East and Africa | United Arab Emirates |
| Saudi Arabia | |
| South Africa | |
| Rest of Middle East and Africa |
| By Component | Solution | Supply-Chain Procurement and Planning Tools |
| Sales and Operations Planning | ||
| Manufacturing Analytics | ||
| Transportation and Logistics Analytics | ||
| Inventory Planning and Optimization | ||
| Service | Professional Services | |
| Support and Maintenance | ||
| By End User Industry | Retail | |
| Transportation and Logistics | ||
| Manufacturing | ||
| Healthcare | ||
| Other end-user Industries (Consumer-Packaged Goods, Energy and Ultilities, etc.) | ||
| By Deployment Model | On-premise | |
| Cloud | ||
| By Geography | North America | United States |
| Canada | ||
| Mexico | ||
| South America | Brazil | |
| Argentina | ||
| Rest of South America | ||
| Europe | United Kingdom | |
| Germany | ||
| France | ||
| Italy | ||
| Rest of Europe | ||
| Asia Pacific | China | |
| Japan | ||
| South Korea | ||
| India | ||
| Rest of Asia Pacific | ||
| Middle East and Africa | United Arab Emirates | |
| Saudi Arabia | ||
| South Africa | ||
| Rest of Middle East and Africa | ||


Key Questions Answered in the Report
What is the current value of the supply chain big data analytics market?
The market stands at USD 13.2 billion in 2026 and is on track to reach USD 31.44 billion by 2031.
Which region is growing fastest for supply chain big data analytics?
Asia Pacific is expanding at a 21.15% CAGR due to manufacturing growth, e-commerce expansion, and supportive government policies.
Which deployment approach dominates new analytics projects?
Cloud platforms account for 62.95% of 2025 revenue and continue to outpace on-premise alternatives as enterprises favor elastic scaling and pay-as-you-go pricing.
Which industry vertical leads in adoption?
Retail held 33.10% of 2025 revenue by leveraging analytics to manage omni-channel complexity and improve inventory accuracy.
Why are services growing faster than software solutions?
The 19.32% CAGR in services reflects rising demand for system integration, data cleaning, and AI model tuning that enterprises often lack in-house expertise to perform.
What is a key restraint on market growth?
Integration and data-quality issues can delay projects by up to a year and absorb as much as 60% of analytics budgets, slowing broader adoption.
Page last updated on:


