
Household Robots Market Size and Share
Market Overview
| Study Period | 2020 - 2031 |
|---|---|
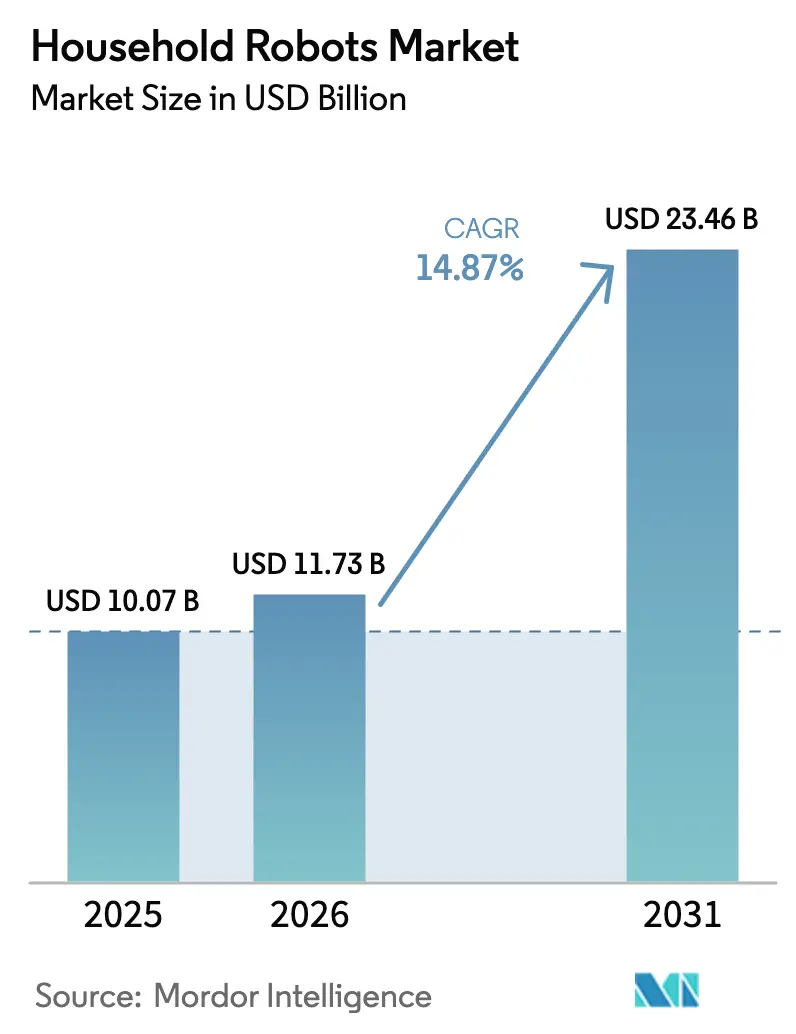
| Market Size (2026) | USD 11.73 Billion |
| Market Size (2031) | USD 23.46 Billion |
| Growth Rate (2026 - 2031) | 14.87 % |
| Fastest Growing Market | Middle East |
| Largest Market | Asia Pacific |
| Market Concentration | Medium |
Major Players *Disclaimer: Major Players sorted in no particular order Image © Mordor Intelligence. Reuse requires attribution under CC BY 4.0. | |
Household Robots Market Analysis by Mordor Intelligence
The household robots market size is expected to increase from USD 10.07 billion in 2025 to USD 11.73 billion in 2026 and reach USD 23.46 billion by 2031, growing at a CAGR of 14.87% over 2026-2031. Sustained demand for time-saving appliances among dual-income families, rapid population aging in developed nations, and smart-home ecosystem integration are steering growth. Commercially proven vacuum and mopping models remain the category gateway, yet social and companion robots are moving from pilot projects to mainstream retail shelves. Cost deflation in LiDAR, brushless motors, and lithium-ion batteries is shrinking entry-level price points without diluting margins, while premium SKUs leverage AI mapping, self-emptying docks, and hot-water mop washing to justify higher ticket values. On the supply side, Chinese manufacturers strengthen vertical integration in battery cells and rare-earth magnet recycling, accelerating feature diffusion and shortening product refresh cycles. Macroeconomic headwinds around rare-earth element sourcing, as well as consumer anxieties over data privacy, persist but do not outweigh structural drivers that favor continued adoption.
Key Report Takeaways
- By product type, robotic vacuum cleaners led with 47.83% revenue share in 2025, while companion and social robots are projected to expand at a 16.31% CAGR through 2031.
- By application, robotic vacuum and mopping held 54.79% of 2025 demand; companionship and social-interaction use cases are forecast to grow at a 17.02% CAGR to 2031.
- By mobility, mobile platforms captured 88.76% of 2025 revenue and are expected to advance at a 14.96% CAGR through 2031.
- By connectivity, Wi-Fi-enabled models accounted for 66.73% of 2025 shipments and will rise at a 15.27% annual pace, outpacing Bluetooth and Zigbee alternatives.
- By pricing tier, the USD 501-1,000 band represented 45.68% of 2025 unit volume, yet the above-USD 1,000 segment is on track for 15.86% yearly growth.
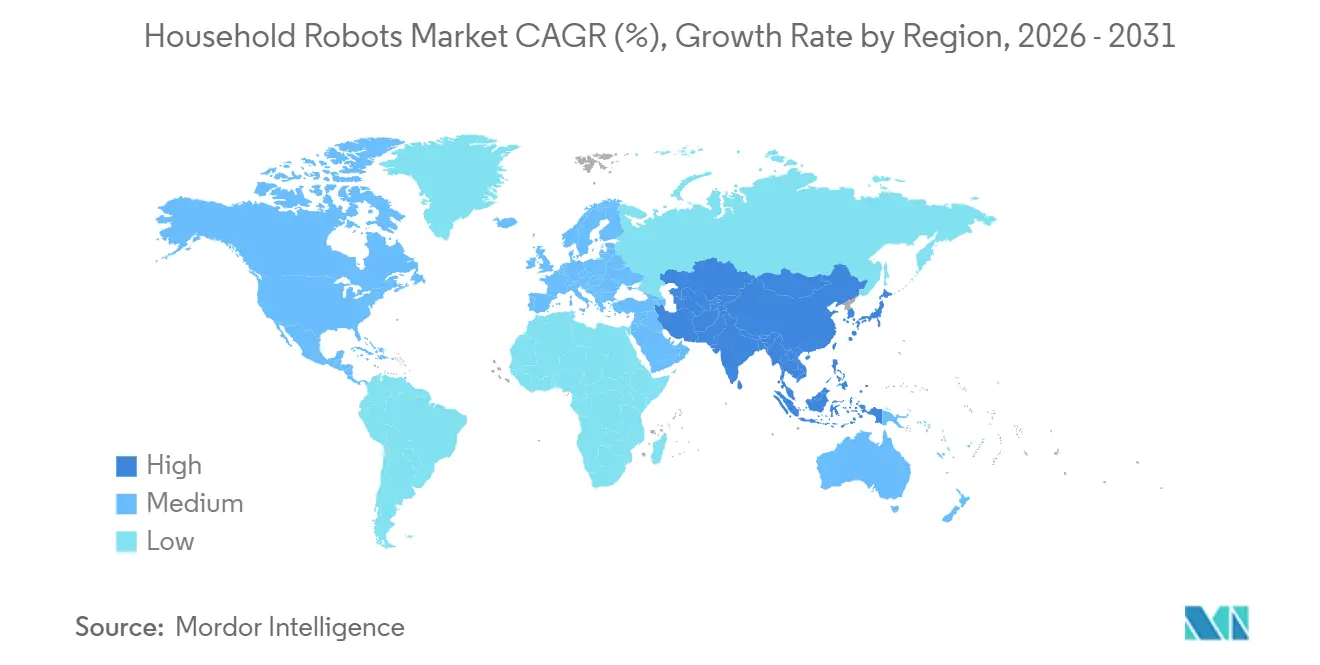
- By geography, Asia Pacific generated 38.64% of 2025 sales while the Middle East is positioned for the fastest regional expansion at a 16.06% CAGR through 2031.
Note: Market size and forecast figures in this report are generated using Mordor Intelligence’s proprietary estimation framework, updated with the latest available data and insights as of January 2026.
Market Trends and Insights
Drivers Impact Analysis of Household Robots Market*
| Driver | (~) % Impact on CAGR Forecast | Geographic Relevance | Impact Timeline |
|---|---|---|---|
| Growing R&D Investments and Expanding Application Range | +3.2% | Global with focus in China, United States, Japan | Medium term (2-4 years) |
| Rapid Urbanization and Rising Dual-Income Households | +2.8% | Asia Pacific core, spill-over to Middle East and Latin America | Long term (≥ 4 years) |
| Declining Prices of Sensors and Battery Technologies | +2.5% | Global, cost benefits centered in Asia Pacific | Short term (≤ 2 years) |
| Growth of Smart Home Ecosystems and IoT Interoperability | +2.3% | North America and Europe, expanding to Asia Pacific cities | Medium term (2-4 years) |
| Government Incentives for Elderly Care Robotics in Select Countries | +1.9% | Japan, South Korea, selected EU states | Long term (≥ 4 years) |
| Emergence of Robot-as-a-Service Subscription Pricing | +1.4% | North America and Europe pilots, gradual Asia Pacific uptake | Medium term (2-4 years) |
| Source: Mordor Intelligence | |||
Growing R&D Investments and Expanding Application Range
Global research spending is shifting toward dexterous manipulation beyond floor cleaning. Stanford University’s 2025 BEHAVIOR benchmark showed only 38% completion across 1,000 household tasks, highlighting untapped upside in folding laundry, loading dishwashers, and assisting mobility-impaired residents. China’s Ministry of Industry and Information Technology earmarked CNY 10 billion (USD 1.4 billion) in 2025 for humanoid R&D with a household focus. Japan widened its long-term care subsidy to cover 50% of eligible robot costs, catalyzing adoption in private residences. Google DeepMind released Gemini Robotics APIs in 2025, enabling natural-language task planning across third-party platforms.[1]Google DeepMind, “Gemini Robotics APIs,” deepmind.google These initiatives enlarge the household robots market by transforming one-function vacuums into multi-task home assistants.
Rapid Urbanization and Rising Dual-Income Households
Urban density and evolving family structures increase willingness to automate chores. United Nations data place the global urban share at 57% in 2024 with Asia growing fastest.[2]UN DESA, “World Urbanization Prospects 2024,” un.org Time-use surveys show that U.S. dual-income families now dedicate under 4 hours weekly to housework, reinforcing demand for autonomous devices. Domestic brands in China recorded domestic robot sales growth above 20% in 2025, evidencing rising local purchasing power. In Dubai, penetration reached 23% versus a 12% global baseline, reflecting strong expatriate adoption. These demographic realities ensure resilient unit growth for the household robots market.
Declining Prices of Sensors and Battery Technologies
Component deflation lets mid-range models inherit premium features. Time-of-flight depth sensors dropped from USD 12 in 2022 to USD 4.5 in 2025. Lithium-ion battery packs fell to USD 115 per kWh in 2024, upholding 90-minute runtimes in sub-USD 600 robots. TDK’s solid-state microbattery triples energy density at similar weight, cutting fire risk in residential settings. European magnet recycling programs reduced brushless motor costs by 18% from 2023-2025. Lower bills of material allow vendors to seed price-sensitive markets without sacrificing gross margins.
Growth of Smart Home Ecosystems and IoT Interoperability
Household robots are now integral nodes inside whole-home automation architectures. The Connectivity Standards Alliance launched Matter 1.0 in 2024, simplifying multi-brand device pairing. IEEE 2951-2025 established baseline cybersecurity criteria, elevating consumer trust. Samsung SmartThings and Apple HomeKit approved 47 and 38 robot models respectively in 2025. Voice-assistant compatibility reached 82% of Wi-Fi robots shipped in 2025, boosting daily engagement as users issue granular cleaning commands. Ecosystem lock-in raises switching costs and will sustain premium ASPs.
Restraints Impact Analysis of Household Robots Market*
| Restraint | (~) % Impact on CAGR Forecast | Geographic Relevance | Impact Timeline |
|---|---|---|---|
| High Initial Purchase Cost for Advanced Models | -1.8% | Global, most acute in emerging markets | Short term (≤ 2 years) |
| Safety and Privacy Concerns Among Consumers | -1.5% | North America and Europe, emerging in Asia Pacific | Medium term (2-4 years) |
| Supply Chain Volatility for Rare-Earth Permanent Magnets | -1.2% | Global, heavy China exposure | Medium term (2-4 years) |
| Lack of Standardized Home-Robot Regulatory Framework | -0.9% | Worldwide, fragmented rules | Long term (≥ 4 years) |
| Source: Mordor Intelligence | |||
High Initial Purchase Cost for Advanced Models
Premium robots above USD 1,000 remain out of reach for median-income households in India, Brazil, and Indonesia where discretionary appliance budgets hover under USD 400 annually.[3]World Bank, “Global Consumption Database,” datatopics.worldbank.org Replacement batteries priced at USD 80-150 and motor assemblies at USD 120-200 add lifecycle costs that retard repeat purchases. U.S. households earning under USD 50,000 show a nine percent purchase conversion rate despite high interest. Sub-USD 250 Chinese models record 32% return rates due to basic navigation shortcomings, further eroding category confidence. Until financing options mature or bill-of-materials costs fall further, mass uptake in lower-income regions lags.
Safety and Privacy Concerns Among Consumers
High-profile breaches erode trust in camera-equipped robots. The U.S. Federal Trade Commission penalized Amazon’s Ring division in 2023 for unauthorized video access, raising consumer alertness. A December 2024 Bluetooth exploit affecting 1.2 million Ecovacs Deebot units prompted a firmware recall. Europe’s Cyber Resilience Act now mandates 5-year patch coverage, inflating compliance costs by up to 12%.[4]European Commission, “Cyber Resilience Act,” ec.europa.eu Physical incidents, such as a 2024 minor burn in South Korea, draw outsized media coverage. Manufacturers offering local-only processing see 12-18% AI accuracy trade-offs, illustrating a persistent performance-privacy dilemma.
*Our forecasts treat driver/restraint impacts as directional, not additive. The impact forecasts reflect baseline growth, mix effects, and variable interactions.
Household Robots Market Segment Analysis
By Product Type:
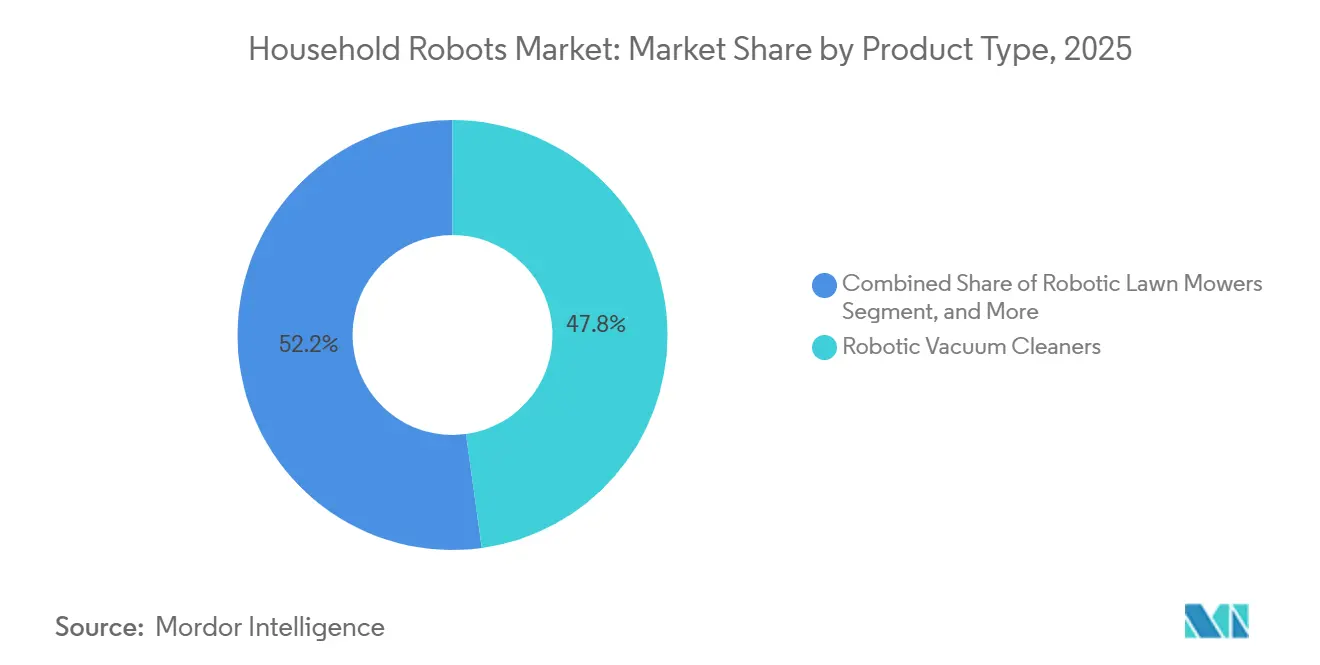
Companion Robots Outpace Cleaning DevicesRobotic vacuum cleaners generated 47.83% of 2025 revenue for the household robots market share, yet companion and social robots are projected to rise at a 16.31% CAGR through 2031. Growth reflects advanced cognitive engagement, fall detection, and medication reminders that appeal to aging populations in Japan and South Korea. Daily engagement rates of 90% for ElliQ pilots among seniors validate commercial readiness.[5]Intuition Robotics, “ElliQ Engagement Data,” elliq.com Chinese suppliers Roborock, Ecovacs, and Dreame captured 62% of shipments in 2025 through aggressive pricing, confirming that vacuum hardware is commoditizing. Lawn mowers and pool cleaners remain niche at 18% volume but benefit from labor shortages and rising wages in suburban North America and Europe. Premium mowing units equipped with RTK-GPS remove perimeter wires, widening the addressable yard segment.
A second wave of functionality is already visible in patent filings related to folding laundry, loading dishwashers, and manipulating fragile items. Dyson, Samsung, and Toyota Research Institute lead filings for multi-fingered grippers, suggesting robots will soon pivot from single-task tools to holistic home assistants. Vendors that master tactile sensing will capture outsized revenue once manipulation crosses cost-performance thresholds acceptable to mainstream consumers.



By Application:
Companionship Surges as Loneliness Epidemic IntensifiesVacuum and mopping dominated 54.79% of 2025 demand, yet companionship and social interaction use cases will grow at 17.02% per year. The U.S. Surgeon General identified loneliness as a public health crisis in 2024, opening reimbursement channels that subsidize companion robots for seniors. Medicare Advantage pilots covering ElliQ rentals mark an early inflection. Lawn mowing robots target 38 million large-yard U.S. households; penetration is gated by state-level supervision rules that limit overnight operation. Pool cleaning remains clustered in California, Florida, Texas, and Australia where high chemical and labor costs justify robotic ownership.
Clinical validation drives the next adoption curve. A 2024 Stanford study recorded 28% loneliness reduction among seniors using social robots, matching outcomes from group therapy. Robotic vacuum models that combine wet and dry cleaning now command 41% of purchases, showing users favor consolidated chores in one run. Features such as UV-C sterilization in pool cleaners reduce chemical usage, speaking to environmentally conscious buyers. Window-cleaning and gutter-cleaning robots remain experimental at under 2% share, but patents in these domains jumped 34% in 2024, indicating an emerging long-tail of niche applications.
By Mobility:
Autonomous Navigation Dominates as Stationary Models StagnateMobile robots generated 88.76% of 2025 revenue and will sustain 14.96% growth as mapping costs drop and solid-state batteries raise endurance. Structured-light cameras and LiDAR sensors now retail under USD 6 per unit, reducing collision incidents by two-thirds compared with 2023 models. The household robots market size for mobile platforms will continue to expand as network effects let units double as security patrols or air-quality monitors, maximizing homeowner ROI.
Stationary robots face commoditization pressure with limited differentiation. Sub-USD 200 window cleaners see high churn, and countertop assistants cannot traverse multilevel layouts. Commercial niches, including hotel lobby greeters and retail disinfecting units, provide some refuge but do not offset residential stagnation. Advancements in SLAM algorithms promise wider-area household coverage once solid-state batteries triple current energy density by 2027.
By Connectivity:
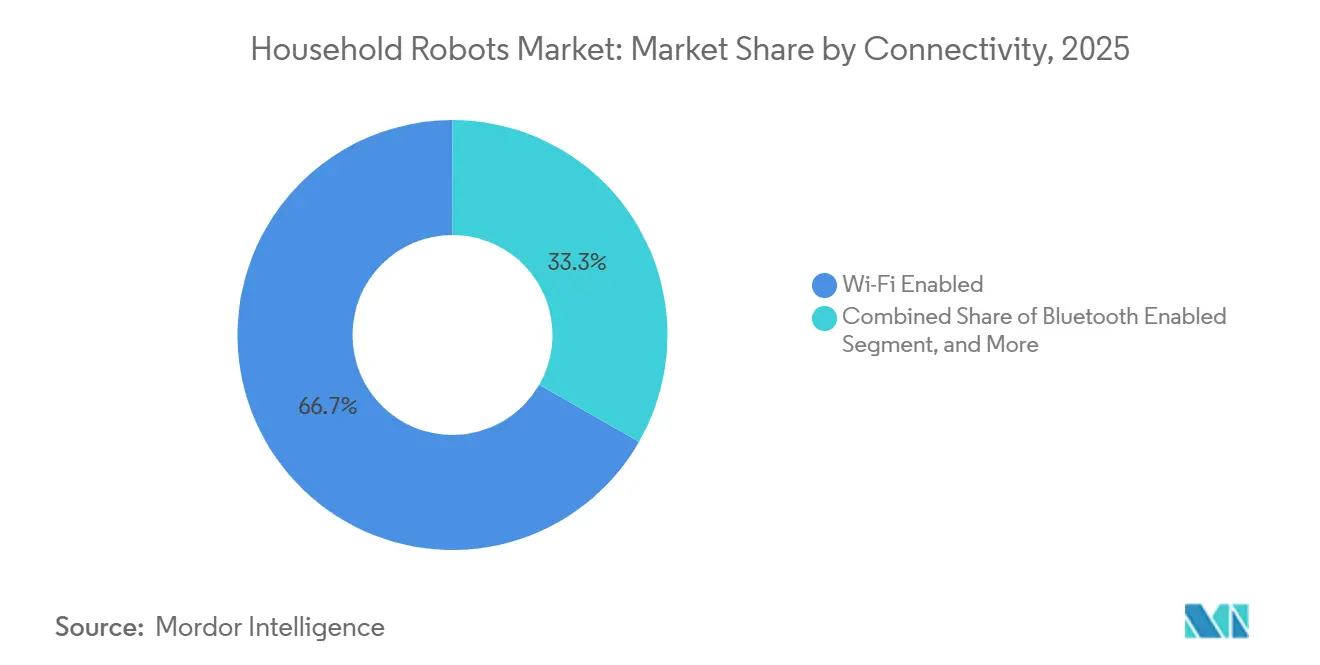
Wi-Fi Protocols Cement Ecosystem Lock-InWi-Fi-enabled models captured 66.73% of global shipments in 2025 and will grow 15.27% annually as Matter protocol adoption climbs. Households increasingly expect robots to receive over-the-air updates and integrate with voice assistants. IEEE 2951-2025 compliance raised Wi-Fi module costs by USD 2.8 but lowered breach probabilities and customer-support burden.
Bluetooth models serve budget tiers yet suffer range limits that restrict off-site control. ZigBee claims a 2% niche among enthusiasts seeking low-power mesh networks though hub costs constrain mass uptake. Non-connected models are declining at 3% annually but may find new life with 4G LTE modules in markets lacking fixed broadband.
By Pricing Tier:
Premium Segment Accelerates as Feature Bundling Justifies UpsellingThe USD 501-1,000 bracket held 45.68% of 2025 unit volume, yet models above USD 1,000 will expand 15.86% annually. Self-emptying docks raise ASPs by USD 180-250 but compress user intervention from weekly to monthly. AI obstacle recognition reached 94% accuracy on pet waste and cables, a leap that lowers returns and increases brand loyalty.
Hot-water mop washing at 60°C removes bacteria, attracting hygiene-focused buyers in Japan and South Korea. Entry-level units below USD 500 add app control but retain bump-and-run navigation, covering only 62% of floor area per cycle, limiting future upgrades unless hardware sophistication rises.
Geography Analysis
APAC Household Robots Market
Asia Pacific produced 38.64% of 2025 sales for the household robots market, driven by China’s 18.2 million-unit output and Japan’s subsidy-backed elderly-care demand. China’s vertically integrated supply chain in battery cells, motors, and LiDAR sensors lowers bill-of-materials cost and accelerates feature trickle-down into mid-range SKUs. Japan’s Ministry of Health subsidy covers 60% of approved robot costs up to JPY 1 million (USD 6,700), propelling home adoption after institutional pilots validated efficacy.
North America and Europe Household Robots Market
North America contributed 28% of 2025 revenue. Replacement cycles shortened to 3-4 years as early adopters upgraded to models with self-emptying docks and AI vision. Premium vendors pivot toward Robot-as-a-Service subscriptions that spread costs over time and raise lifetime value. Europe owned 22% of 2025 demand, with Germany, France, and the United Kingdom enforcing strict standby power limits below 0.5 watts. The EU Ecodesign Directive lengthens product lifespans to 7 years, raising initial bill-of-materials but appealing to sustainability-minded buyers.
MEA and South America Household Robots Market
The Middle East will post a 16.06% CAGR through 2031, fastest worldwide. United Arab Emirates and Saudi Arabia embed IoT-enabled appliances in new master-planned communities funded by sovereign wealth investments. South America’s 12% share is capped by 18-35% import tariffs, inflating retail prices and narrowing the buyer pool to upper-income urban households. Africa remains nascent, though South Africa, Nigeria, and Kenya show rising penetration as sub-USD 250 models reach aspirational buyers and broadband coverage widens.

Regulatory Landscape
Household robots operate in a fragmented, but increasingly defined, compliance environment across product safety, cybersecurity, and performance benchmarking. In North America, UL requirements are a common pathway for consumer robot safety, and the ANSI/CAN/UL 3300 revision (April 16, 2025) added updated ageing tests on motors, clarified emergency-stop requirements, and expanded obstacle-recognition testing considerations for AI-enabled robots. These updates affect design validation and time-to-market for connected floor-care devices.
In Europe, conformity assessment obligations for AI-enabled machines are being clarified. The European Commission advanced a May 2026 Digital Omnibus proposal that positions embedded-AI machinery primarily under the EU Machinery Regulation (Regulation (EU) 2023/1230) rather than duplicative treatment under the EU AI Act, while the Machinery Regulation becomes applicable on January 14, 2027 and introduces third-party conformity assessment triggers for certain AI safety functions. Performance transparency is also being standardized through IEC publications, including EN IEC 62849:2026 (published January 16, 2026) on household robot performance evaluation methods for obstacle avoidance, navigation, and energy consumption, supporting more comparable claims across brands and retailers.
Value Chain Analysis
The household robots value chain begins with upstream components such as LiDAR and vision modules, time-of-flight sensors, brushless motors, gearboxes, bearings, batteries and BMS, plastics and metal frames, and embedded compute and connectivity modules. From there, ODM/OEM design, assembly, and quality validation lead into distribution through mass retail, e-commerce marketplaces, and installer-led routes for integrated home solutions. China continues to be central to hardware sourcing and industrialization, with manufacturing clusters repurposing established consumer-electronics capacity (precision motors and sensors) for robotics actuators and joints, which shortens iteration cycles for cleaning robots and adjacent home-service platforms.
At the midstream stage, differentiation increasingly comes from software stacks (mapping, object recognition, OTA update pipelines) and serviceability, while procurement and supplier qualification for mechanical parts such as bearings and motion actuators has become a practical bottleneck alongside cost and availability of core electronics. Downstream, the chain is widening beyond standalone devices as collaborations and ecosystem integration pull robots into broader home-appliance and smart-home platforms, and vendors use high-profile product launches to build distribution and after-sales service networks. This approach is visible in new-generation floor-care introductions from iRobot (July 2026) and concept-to-ecosystem demonstrations by Roborock and LG at CES 2026.
Competitive Landscape
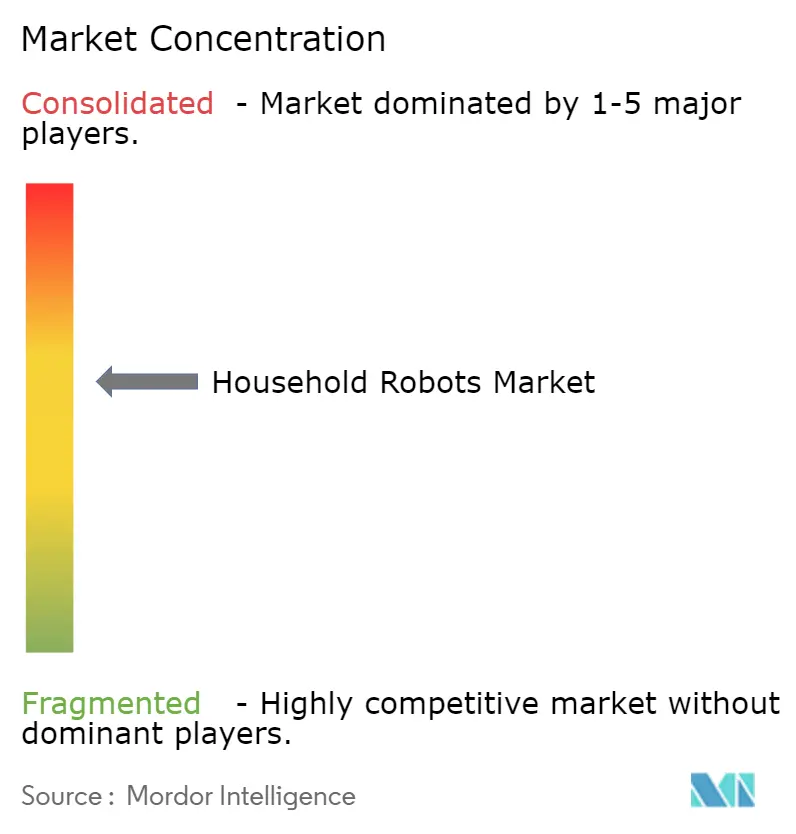
The household robots market is moderately concentrated, with the top five players accounting for 52% of 2025 revenue. Roborock, Ecovacs, and Dreame leverage vertical integration to undercut competitors by 20-30% while matching feature sets, forcing iRobot to focus on premium AI navigation and subscription services. Husqvarna and Maytronics lead lawn and pool applications, but cross-category expansion is erasing historical silos. Samsung and LG integrate robots into broad smart-home ecosystems to lock in recurring service revenues.
Patent filings for manipulation tasks rose 41% in 2024, led by Dyson, Samsung, and Toyota Research Institute, foreshadowing a pivot beyond cleaning. Disruptors such as Standard Bots offer USD 99-per-month subscriptions bundling hardware, upgrades, and on-site service, mirroring SaaS economics and raising valuation multiples. Agility Robotics pilots multi-purpose humanoid platforms, threatening single-function devices after 2028 once unit economics converge. Compliance speed differs by region: U.S. UL certifications complete in 3-4 months, whereas European CE marking takes up to 9 months, granting first movers accelerated access in select markets. Twelve brands exited the sub-USD 400 vacuum tier in 2024 as margin compression intensified, signaling impending consolidation.
Household Robots Industry Leaders
iRobot Corporation
Neato Robotics Inc.
Samsung Electronics Co. Ltd
Panasonic Holdings Corporation
Ecovacs Robotics Co. Ltd.
- *Disclaimer: Major Players sorted in no particular order
Household Robots Market Companies Covered in this Report
- iRobot Corporation
- Roborock Technology Co. Ltd.
- Ecovacs Robotics Co. Ltd.
- Samsung Electronics Co. Ltd.
- LG Electronics Inc.
- Panasonic Holdings Corporation
- Husqvarna Group
- Maytronics Ltd.
- Neato Robotics Inc.
- SharkNinja Operating LLC
- ILIFE Innovation Ltd.
- Blue Frog Robotics SAS
- bObsweep Inc.
- Dyson Technology Ltd.
- Xiaomi Corporation
- Dreame Technology Co. Ltd.
- Miele and Cie. KG
- Kärcher GmbH and Co. KG
- UBTECH Robotics Inc.
- SoftBank Robotics Group Corp.

Market Opportunities and Future Outlook
White space is developing as household robots expand from single-function cleaners into interoperable home agents and embedded appliances. Ecosystem-level hooks are becoming more explicit, supported by smart-home interoperability momentum (Matter) and expanding model approvals inside leading platforms. At the same time, cybersecurity and patch-life requirements (including EU obligations for multi-year support) are pushing vendors to monetize software and services alongside hardware. The most direct near-term commercialization still concentrates in floor care, where premiumization such as AI mapping, object recognition, and self-maintenance docks is already established. Adjacent opportunities are also emerging around robots embedded into furniture and built-in formats.
A set of 2026 proof points shows where vendors and industry bodies are directing investment toward commercialization and standardization. In March 2026, the China Household Electrical Appliances Association inaugurated a Special Committee for Household Service Robots, indicating coordinated work on specifications, testing, and commercialization pathways for domestic service robots. In April 2026, Bosch Home Appliances and Ecovacs advanced an embedded approach with a kitchen-integrated built-in vacuum and mop robot, extending the addressable market beyond portable devices into fitted kitchens and home renovation cycles. Manufacturers are also building data pipelines ahead of broader in-home deployment, as shown by LG converting its Yangjae R&D Campus into a robot data factory using 100 CLOiD units (June 2026), aimed at improving robustness in real environments and reducing edge-case failures.
Recent Industry Developments in Household Robots Market
- July 2026: iRobot announced new floor-care products for North America, including the Roomba Electro Plus and a new generation of Roomba robot vacuums. The refresh expands feature coverage across price bands, strengthening iRobot's ability to defend share against fast-cycle competitors while emphasizing differentiated cleaning and maintenance automation.
- September 2025: BSH Home Appliances Group and Ecovacs Group entered a strategic global partnership to co-develop robotic floor-cleaning solutions, highlighted by a co-developed built-in robot vacuum concept for kitchen furniture. The move extends household robotics into integrated appliances and renovation-linked purchase journeys, creating a new pathway beyond standalone robot vacuums.
- December 2024: A Bluetooth exploit affecting about 1.2 million Ecovacs Deebot units prompted a firmware recall. The incident elevated consumer and regulator scrutiny of connected household robots and increased the importance of secure OTA update pipelines and longer-term patch commitments in product positioning.


Household Robots Market Report Scope and Research Methodology
Market Definition and Coverage
This market covers robots designed mainly for home use that help with routine household tasks, such as cleaning and basic assistance. It also covers devices sold as finished units to end users through retail and online channels.
Scope exclusions: We exclude industrial, warehouse, medical, and defense robots. We also exclude professional service robots used mainly in commercial facilities.
Segments Covered in This Report
- By Product Type
- Robotic Vacuum Cleaners
- Robotic Lawn Mowers
- Robotic Pool Cleaners
- Companion and Social Robots
- Other Product Types
- By Application
- Robotic Vacuum and Mopping
- Lawn Mowing
- Pool Cleaning
- Companionship and Other Applications
- By Mobility
- Stationary Robots
- Mobile Robots
- By Connectivity
- Wi-Fi Enabled
- Bluetooth Enabled
- ZigBee and Other Protocols
- Non-Connected Robots
- By Pricing Tier
- Below USD 500
- USD 501 - 1,000
- Above USD 1,000
- By Geography
- North America
- United States
- Canada
- Mexico
- South America
- Brazil
- Argentina
- Rest of South America
- Europe
- Germany
- France
- United Kingdom
- Italy
- Spain
- Russia
- Rest of Europe
- Asia-Pacific
- China
- Japan
- South Korea
- Taiwan
- India
- ASEAN
- Australia and New Zealand
- Rest of Asia-Pacific
- Middle East
- Saudi Arabia
- United Arab Emirates
- Turkey
- Israel
- Rest of Middle East
- Africa
- South Africa
- Nigeria
- Kenya
- Egypt
- Rest of Africa
- North America
Data Sources, Market Sizing, and Validation
Desk Research
Desk research is used to set the boundaries of what counts as a household robot and to build a clean starting dataset before the model is run. We rely on public sources such as International Federation of Robotics publications, U.S. Census and Bureau of Economic Analysis series on consumer spending, World Bank macro indicators, UN Comtrade trade flows for relevant robot and appliance categories, and standards and guidance notes from bodies such as ISO and IEC.
The model is then supported with secondary materials including company annual reports, earnings transcripts, investor presentations, product documentation, and credible press coverage on shipments and pricing. Where needed, we also use paid subscriptions for company financials and intelligence, news and financials, patent databases, and shipment-level import and export records to check directionally whether volumes and pricing align with adoption. The sources listed here are illustrative, and we used additional public and subscription sources for cross-checks and clarification.
Primary Interviews and Surveys
Primary work is used to verify what is actually being bought for home use, how products are priced by tier, and how connectivity and mobility features affect average selling prices over time. We speak with product owners, channel participants, component ecosystem contacts, and industry specialists across APAC, EMEA, and the Americas, so assumptions from desk research can be challenged and then narrowed down.
Distribution of primary research fieldwork respondents
| Company type | Respondent position | Region |
|---|---|---|
| Top tier: 36% | CXOs: 14% | APAC: 49% |
| Mid tier: 46% | Functional/Unit leaders: 32% | EMEA: 29% |
| Smaller Players: 18% | Managers: 54% | Americas: 22% |
Market-Sizing & Forecasting
Sizing starts with a top-down build, where household robot demand is reconstructed using regional adoption signals and category-level value pools, then mapped into the in-scope product and application set. We corroborate totals with selective bottom-up approximations, such as sampled price by tier multiplied by estimated unit volumes. We also run channel checks on mix shifts and use supplier-side indicators when public information allows, which helps us adjust totals when early model outputs look overstretched.
Key inputs include the share of homes purchasing robot vacuums and mopping devices, replacement cycles for cleaning robots, pricing tier mix (below USD 500, USD 501-1,000, and above USD 1,000), penetration of connected robots by protocol (Wi-Fi, Bluetooth, ZigBee, and non-connected), and the split between mobile and stationary formats. We also track regional macro factors that influence consumer spending and import dependence, since cross-border flows can change reported value when currency and sourcing patterns shift.
For forecasting, scenario analysis is used to convert expected adoption and price paths into revenue outcomes, since household robots can change with feature upgrades, promotions, and new use cases such as companion and social robots. When a country-level volume proxy is weak, we fill gaps with regional benchmarks and then re-check the implied prices and growth rates with primary feedback before finalizing the curve.
Data Validation & Update Cycle
Validation is done through multiple checks so the final series stays consistent with independent signals and basic market logic. We compare outputs against external indicators such as trade movement, consumer electronics demand direction, and public shipment commentary, and then review any variance that appears too large for a single year.
If a major assumption shifts, for example a step-up in pricing tied to connectivity upgrades or a sudden change in channel mix, the team re-contact relevant interviewees and re-runs the sensitivity. Each report is refreshed annually, and interim adjustments are made when material events occur that can noticeably change demand, pricing, or supply. Before delivery, a final analyst pass is completed so clients receive an updated view rather than a prior version.
Mordor Intelligence's Household Robots Market Size Versus Other Published Estimates
Published market sizes for household robots can vary even when the topic sounds similar, because researchers may count different product boundaries, use different base years, and convert currencies in different ways. Differences also show up when one estimate leans more on shipment trends, while another leans more on spending assumptions, which can move the value up or down.
By tracking pricing tiers, connectivity mix, and mobility splits inside the model, Mordor Intelligence keeps the 2026 value tied to in-scope household use cases. Some other estimates widen the basket to adjacent consumer robotics categories or apply faster price and adoption ramps. In practice, the gaps usually stem from what is counted as a household robot (for example, whether companion and social robots are included), the time period used for normalization, and how quickly ASPs are assumed to rise as features are added.
Benchmark comparison
| Source | Market Size | Gaps in Research Methodology |
|---|---|---|
| Mordor Intelligence | USD 11.73 B (2026) | |
| Global Consultancy A | USD 13.90 B (2025) | Uses an earlier base year and a broader household robot definition that appears to emphasize high-growth assistance and leisure categories, which can lift the value even before applying the forecast curve. |
| Industry Publisher B | USD 7.68 B (2024) | Anchors the market to a smaller starting year and often reflects more conservative adoption and pricing progression, which can understate premium-tier mix and connected feature uplift in the near term. |
The spread in values is mainly explained by scope boundaries, base-year choice, and how pricing mix is treated as robots move from basic cleaning into higher-feature connected devices. Our approach stays repeatable because each step links back to observable demand signals, clear product inclusions, and a practical set of checks that can be re-run when conditions change.


Key Questions Answered in the Report
What is the current household robots market size?
The household robots market size is USD 11.73 billion in 2026 and is forecast to reach USD 23.46 billion by 2031.
How fast is the household robots market growing?
The market is expanding at a 14.87% CAGR through 2031, driven by dual-income households, aging populations, and smart-home integration.
Which segment is growing fastest within household robots?
Companion and social robots show the fastest growth, projected at a 16.31% CAGR between 2026-2031 due to rising demand for eldercare and emotional engagement.
Why are Wi-Fi enabled household robots preferred?
Wi-Fi models integrate with voice assistants and receive over-the-air updates, capturing 66.73% of 2025 shipments and growing at 15.27% annually.
Which region will post the highest growth?
The Middle East is expected to lead regional growth with a 16.06% CAGR through 2031, supported by smart-city investments and luxury home automation demand.
What challenges limit adoption in emerging markets?
High upfront prices above USD 1,000 and limited financing options restrain penetration among middle-income households in India, Brazil, and Indonesia.
Page last updated on:





