Hospitality Robots Market Size and Share
Market Overview
| Study Period | 2020 - 2031 |
|---|---|
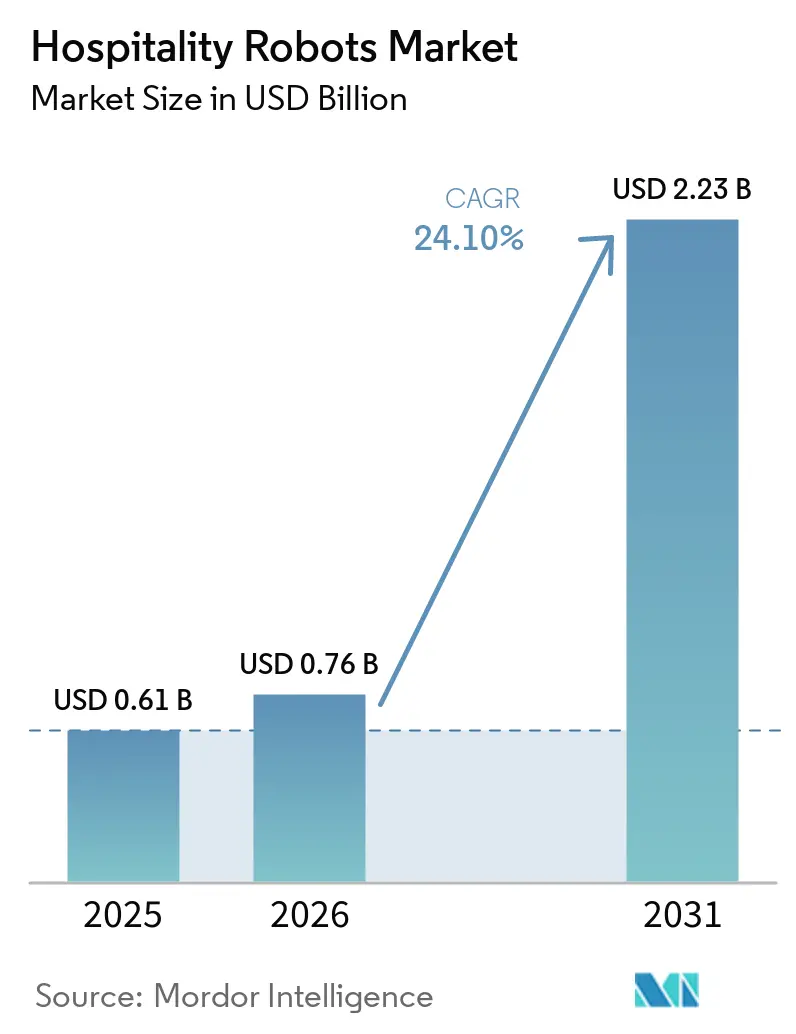
| Market Size (2026) | USD 0.76 Billion |
| Market Size (2031) | USD 2.23 Billion |
| Growth Rate (2026 - 2031) | 24.10% CAGR |
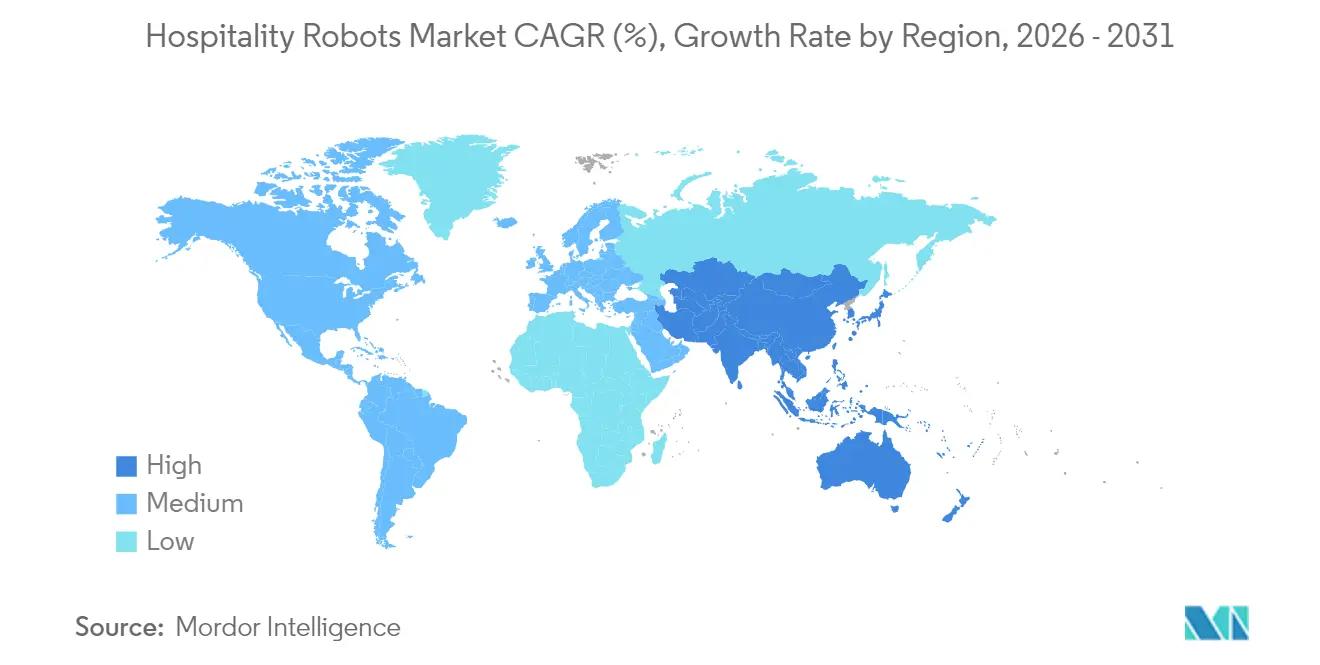
| Fastest Growing Market | Asia-Pacific |
| Largest Market | North America |
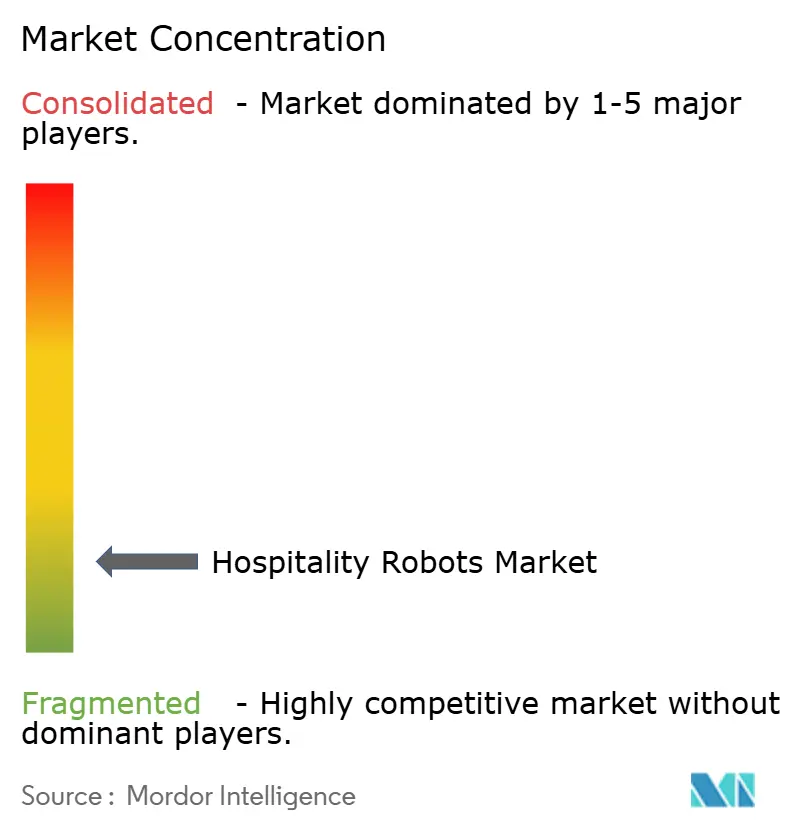
| Market Concentration | Low |
Major Players *Disclaimer: Major Players sorted in no particular order Image © Mordor Intelligence. Reuse requires attribution under CC BY 4.0. | |
Hospitality Robots Market Analysis by Mordor Intelligence
The hospitality robots market size was valued at USD 0.61 billion in 2025 and estimated to grow from USD 0.76 billion in 2026 to reach USD 2.23 billion by 2031, at a CAGR of 24.10% during the forecast period (2026-2031). This robust trajectory reflects operators’ strategic pivot toward automation-driven service delivery, a response to persistent labor shortages and travelers’ growing preference for low-touch interactions. Across upscale hotels, branded quick-service restaurants, and destination resorts, decision-makers increasingly view robots as the physical extension of broader digital-first service strategies. Heightened competition accelerates adoption, with operators valuing robots’ round-the-clock consistency, data-collection capability, and brand-differentiation potential. Suppliers, in turn, emphasize elevator integration, AI-powered fleet management, and compliance with safety standards that ease property-level risk assessments.
Key Report Takeaways
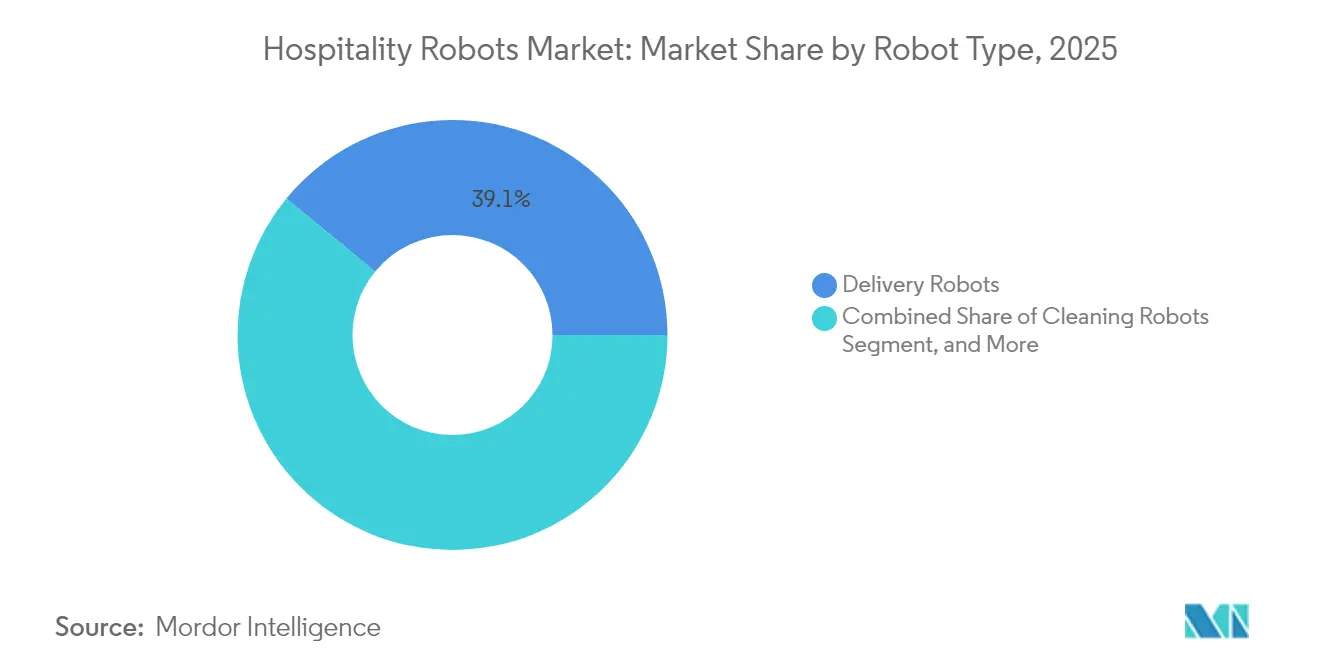
- By robot type, delivery systems led with a 39.05% hospitality robots market share in 2025, while security and surveillance platforms are projected to advance at a 26.1% CAGR through 2031.
- By component, hardware accounted for 59.12% of the hospitality robots market size in 2025, and software is projected to grow at a 25.05% CAGR to 2031.
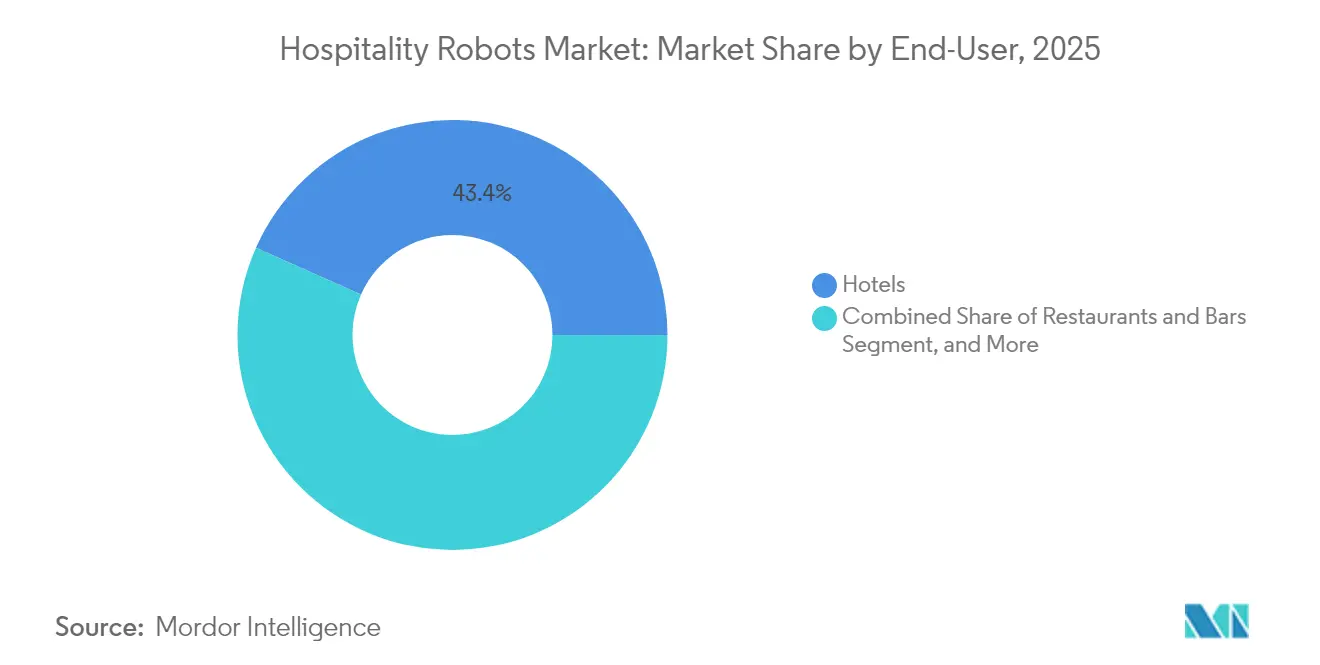
- By end-user, hotels captured 43.35% of the revenue in the hospitality robots market in 2025; restaurants and bars are expected to register a 26.05% CAGR through 2031.
- By deployment, front-of-house held 57.25% of the hospitality robots market implementations in 2025, whereas back-of-house is forecast to expand at a 25.12% CAGR up to 2031.
- By geography, North America dominated the hospitality robots market with a 37.70% share in 2025, while the Asia Pacific is expected to advance at a 25.8% CAGR toward 2031.
Note: Market size and forecast figures in this report are generated using Mordor Intelligence’s proprietary estimation framework, updated with the latest available data and insights as of 2026.
Global Hospitality Robots Market Trends and Insights
Drivers Impact Analysis*
| Driver | (~) % Impact on CAGR Forecast | Geographic Relevance | Impact Timeline |
|---|---|---|---|
| Growing penetration of digital and automation technologies | +4.2% | Global; early gains in North America, Europe, Asia Pacific | Medium term (2-4 years) |
| Post-pandemic labor shortages in hospitality | +6.8% | Global; acute in North America and Europe | Short term (≤ 2 years) |
| Declining sensor and component prices | +3.1% | Global; manufacturing benefits concentrated in Asia Pacific | Long term (≥ 4 years) |
| Surge in demand for contact-less guest experiences | +5.4% | Global; premium properties leading adoption | Short term (≤ 2 years) |
| Government incentives for service-robot adoption | +2.9% | Asia Pacific, Europe, selective North American regions | Medium term (2-4 years) |
| Edge-AI enabling real-time on-premise analytics | +2.3% | Global; technology-forward markets first | Long term (≥ 4 years) |
| Source: Mordor Intelligence | |||
Growing Penetration of Digital and Automation Technologies
Widespread digital transformation programs are pushing operators toward robotics as they seek unified, data-driven service models. Properties that integrate robots with cloud-based hotel and hospitality management software report 15%-30% uplifts in operational metrics such as room-service punctuality and housekeeping turnaround.[1]“Digital Transformation in Hospitality Operations,” Hotel Management, hotelmanagement.net Fleet-management dashboards provide managers with real-time location and task status, enabling proactive load balancing between robots and human staff. As IoT sensors and building-management systems expose their APIs, robots receive granular inputs on elevator availability, banquet hall occupancy, and environmental conditions, thereby improving task efficiency. At the same time, data captured through onboard cameras and lidar builds anonymized heat maps of guest traffic, allowing for the precise scheduling of staff where human touch delivers the most value. Suppliers highlight edge-AI modules that process images locally, reducing latency and addressing data-sovereignty concerns in Europe and parts of Asia.
Post-Pandemic Labour Shortages in Hospitality
Turnover rates remained 76% higher than pre-2020 levels in 2024 for food-service and lodging businesses.[2]“Restaurant Industry Labor Shortage Report 2024,” National Restaurant Association, restaurant.org Managers consequently reassigned human staff to high-value interactions and deployed robots to handle repetitive workloads, including corridor deliveries, table busing, and corridor vacuuming. Properties using delivery robots have documented 20%-35% reductions in manual room-service runs, freeing attendants to focus on upselling or loyalty-program engagement at the front desk. In kitchens, semi-autonomous fry stations maintain output during shift gaps, ensuring consistent ticket times across service peaks, thereby maintaining consistency throughout service periods. These productivity gains mitigate wage-pressure risks and stabilize service quality in markets where immigration policy tightens the supply of seasonal workers.
Surge in Demand for Contact-less Guest Experiences
Industry surveys show 68% of travelers prefer minimal-contact service touchpoints, a pattern that persists beyond immediate health concerns.[3]“Guest Preferences for Contactless Service Survey,” Hospitality Technology, hospitalitytech.com Robots satisfy this requirement by providing zero-contact room-service delivery, automated check-in guidance, and self-navigating luggage carts. Operators record higher Net Promoter Scores when robots are introduced alongside digital keys, because guests perceive a consistent technology narrative across the stay. In luxury resorts, robots additionally act as novelty entertainment, reading children’s stories or escorting groups to themed events, thereby enhancing experiential value while avoiding crowding at concierges.
Government Incentives for Service-Robot Adoption
Fiscal instruments accelerate adoption, particularly among mid-market chains. Japan’s SME Labor-Saving Investment Subsidy reimburses as much as JPY 15 million (USD 100,000) per property, offsetting two to three delivery units’ purchase cost [METI.GO.JP]. Italy’s Piano Transizione 5.0 earmarks EUR 6.3 billion (USD 6.9 billion) to digitalize the service industries, expanding the addressable market for robot vendors in the European Union. Singapore channels USD 60 million through its National Robotics Program, funding pilot deployments in hawker center cleaning and mid-scale hotels. Such programs ease capital constraints, shorten payback periods, and create domestic reference sites that spur neighboring operators to follow suit.
Restraints Impact Analysis*
| Restraint | (~) % Impact on CAGR Forecast | Geographic Relevance | Impact Timeline |
|---|---|---|---|
| High upfront CAPEX for small operators | -3.7% | Global; particularly affecting independent properties | Medium term (2-4 years) |
| Interoperability and integration issues with legacy PMS | -2.1% | Global; legacy system concentration in established markets | Short term (≤ 2 years) |
| Data-privacy concerns in guest-facing use-cases | -1.8% | Europe (GDPR), North America, expanding globally | Long term (≥ 4 years) |
| Limited ROI outside tier-1 properties | -2.4% | Global; mid-market and economy segments | Medium term (2-4 years) |
| Source: Mordor Intelligence | |||
High Upfront CAPEX for Small Operators
Purchase prices ranging from USD 15,000 to USD 50,000 per robot deter family-owned inns and independent cafés, which operate on razor-thin margins.[4]“Technology Investment Challenges for Independent Operators,” Restaurant Business, restaurantbusinessonline.com Financing solutions are emerging in subscription robotics and revenue-sharing models, but adoption outside chain networks remains uneven. Small operators also face training overheads; lacking in-house IT teams, they often outsource maintenance to third-party integrators, thereby increasing the total cost of ownership. Vendors responding to this barrier now bundle multi-year service agreements, while leasing packages align payments with projected labor savings, yet the economics still favor larger properties with multi-unit rollouts.
Interoperability and Integration Issues with Legacy PMS
Many properties run PMS versions installed more than a decade ago; these systems lack RESTful APIs for real-time exchange of robot data. Integration projects, therefore, involve adding middleware, which extends timelines by an extra three to six months and increases deployment costs. The inability to push dynamic elevator calls or sync housekeeping status reduces autonomy and risks service gaps. Recognizing this pain point, hotel groups are increasingly tying robot RFPs to broader cloud-PMS migrations, bundling both capital projects in a single fiscal cycle.
*Our forecasts treat driver/restraint impacts as directional, not additive. The impact forecasts reflect baseline growth, mix effects, and variable interactions.
Segment Analysis
By Robot Type: Security Robots Drive Next-Wave Adoption
Delivery units retained a 39.05% slice of the hospitality robots market in 2025, underscoring their rapid ROI and straightforward workflow integration. Security and surveillance platforms, however, are expected to accelerate at a 26.1% CAGR to 2031, buoyed by property insurers’ favorable premiums for sites employing active monitoring. These robots patrol lobbies and parking structures, streaming 360-degree video to centralized command centers and triggering real-time alerts when they detect suspicious patterns. In parallel, reception robots guide travelers through multilingual check-in steps, while cleaning robots tackle corridor vacuuming and UV-C disinfection of meeting rooms. Demonstrations of food-preparation robots, including Richtech’s ADAM bartender at CES 2024, validate robotics’ potential even in skilled culinary tasks.
A tightening regulatory framework ensures safe cohabitation between humans and autonomous machines. UL 3320 certification now serves as a procurement prerequisite for many full-service hotel chains, particularly in North America, thereby reinforcing the competitive advantage of compliant vendors. As safety standards mature, property owners anticipate broader integration, positioning robots as an indispensable pillar of forthcoming smart-hotel blueprints. Throughout the forecast horizon, diversified portfolios delivery, security, cleaning, and guidance will insulate suppliers from demand swings in any one application cluster, supporting stable contribution margins even as component costs decline.


By Component: Software Intelligence Accelerates Market Evolution
Hardware accounted for 59.12% of 2025 spending, as operators paid for chassis, battery, and sensor assemblies crucial to robot autonomy. Yet the software layer is scaling fastest, advancing at a 25.05% CAGR, because AI-driven route optimization, natural language processing, and predictive maintenance algorithms unlock the full value of physical assets. Vendors are packaging over-the-air updates that extend the functional life of units; fleet-management portals push new behaviors without mechanical alteration, shifting revenue toward high-margin recurring licenses. For operators, analytics dashboards consolidate performance metrics across delivery, cleaning, and security fleets, offering enterprise-wide insights that inform staffing decisions.
The services slice, including installation, training, and 24/7 remote support, remains the smallest but strategically critical. As multi-property hotel groups roll out robots chain-wide, demand rises for certified technicians able to calibrate lidar units, integrate PMS APIs, and coordinate compliance inspections. Partnerships with regional systems integrators accelerate this capability build-out, particularly in Latin America and the Middle East, where localized support mitigates reputational risk associated with downtime during high-occupancy periods.
By End-User: Restaurants Accelerate Robotic Integration
Hotels claimed 43.35% of 2025 revenue, reflecting their head start, longer asset-refresh cycles, and larger average property footprints. Restaurants and bars, however, demonstrate the steepest curve, expanding at 26.05% CAGR. Table-runner robots reduce server foot traffic and expedite meal delivery, which is crucial in formats challenged by staffing gaps. High-volume quick-service chains deploy busing robots that shuttle dirty dishes to centralized wash areas, trimming back-of-house congestion. Travel hubs, airports, cruise ships, and theme parks are experimenting with bilingual guidance robots that handle wayfinding in multiple languages, improving throughput and reducing staff intervention.
Specialty venues, ranging from sports arenas to exhibition centers, utilize robots for crowd management and enhanced guest engagement. These deployments create brand-storytelling opportunities: robots perform gamified scavenger hunts or serve signature cocktails, differentiating experiences. The resulting visibility fuels word-of-mouth marketing that amplifies adoption among mid-market operators seeking novelty without compromising operational stability.
By Deployment: Back-of-House Applications Gain Momentum
Front-of-house use cases accounted for 57.25% of 2025 implementations, as management teams could easily quantify the guest-experience benefits. However, back-of-house use cases are growing at a 25.12% CAGR as operators recognize automation’s ability to stabilize workflows that are otherwise difficult to staff. Autonomous scrubbers sanitize banquet kitchens overnight, while inventory robots scan storerooms, reconciling consumption with purchasing data to ensure accuracy. Such behind-the-scenes efficiency directly improves profit margins without altering the visible service atmosphere. Housekeeping teams pilot UV-C disinfection robots that deep-clean rooms during standard turnover windows, supporting stricter hygiene pledges in upscale chains.
System integrators now bundle mixed deployments front and back into unified ROI dashboards. Connecting laundry robots to housekeeping schedules, for instance, aligns linen processing with room availability targets, thereby reducing late checkout incidents. As these cross-departmental gains accumulate, multi-property operators allocate larger portions of annual capital budgets to integrated fleets rather than isolated pilot projects.
Geography Analysis
North America’s dominant 37.70% share mirrors its history of early pilots and strong venture capital backing. Chain agreements allow suppliers to scale rapidly: Relay Robotics’ multi-property installations improve the utilization of hotel elevators optimized for robot APIs. Canadian operators are focusing on security robots for parking lots at roadside properties, addressing safety concerns during labor shortages. Mexican resort corridors utilize bilingual delivery robots that enhance room-service basket sizes by displaying digital upsell prompts.
Asia Pacific’s 25.8% CAGR underlines a convergence of policy support, manufacturing efficiencies, and guest tech affinity. In China, most three-star and above hotels deploy at least one service robot, and domestic brands such as Ninebot roll out metropolitan marketing campaigns to normalize robot-delivered amenities. Japan’s aging population intensifies labor gaps in the hotel industry, and robots now handle late-night ramen deliveries in business hotels. Singapore’s Changi hospitality cluster trials multi-function guidance robots that integrate with airport systems, creating seamless transitions from the arrival gate to the hotel lobby.
Europe balances GDPR-driven privacy requirements with environmental imperatives. German properties demand on-premise data processing, pushing vendors to enable edge-AI models that bypass cloud uploads. French boutique hotels emphasize design aesthetics, selecting robots with customizable exteriors that align with brand themes. Spain’s coastal resorts deploy outdoor-rated security robots that patrol pool decks, freeing staff for guest-engagement activities.

Competitive Landscape
The hospitality robots market is moderately fragmented, with no entity commanding more than a mid-single-digit share of the revenue. Specialized firms such as Bear Robotics compete alongside electronics majors that leverage supply-chain strengths. Innovation centers on AI perception stacks, battery-swappable architectures, and elevator-API libraries. Partnerships multiply: In March 2024, Bear Robotics secured USD 60 million in Series C funding from LG Electronics, pairing startup software agility with enterprise-grade manufacturing.
Regional integrators shape competitive dynamics. In the Asia Pacific, Ninebot collaborates with hotel groups in Beijing and Shanghai to deploy service fleets across multiple properties, while in Europe, Alphadroid extends its Radisson partnership to additional countries. Compliance capability serves as a market gatekeeper: UL 3320 certification accelerates vendor short-listing for kitchen robots, and ISO 13482 adherence builds trust among risk-averse operators. Price pressure persists as Chinese manufacturers achieve economies of scale; however, vendors differentiate themselves via localized support, user-interface languages, and hotel-brand alignment packages.
Looking ahead, vendors with multi-modal portfolios, delivery, security, cleaning, and food preparation are likely to capture bundled-contract opportunities from chains seeking single-source solutions. Conversely, niche players that perfect one application may thrive by licensing autonomy stacks to OEM partners, illustrating a dual-track consolidation and specialization pattern within the ecosystem.
Hospitality Robots Industry Leaders
Relay Robotics Inc.
LG Electronics Inc.
Bear Robotics Inc.
Ninebot Limited
Connected Robotics Inc.
- *Disclaimer: Major Players sorted in no particular order

Recent Industry Developments
- March 2025: Circus SE signed a framework deal with the Mangal franchise to roll out 500 CA-1 autonomous food-service robots from fall 2025, laying the groundwork for what could become the first fully automated quick-service chain across up to 2,400 restaurants in Germany, broader Europe, Turkey, and Japan.
- March 2025: Marriott International, LG Electronics, and RobotLAB entered an exclusive U.S. partnership that begins with a 24/7 room-service robot now working at the Renaissance Dallas Hotel and includes planned deployments at additional Marriott locations nationwide.
- March 2025: Pudu Robotics introduced the FlashBot Arm, a commercial humanoid robot equipped with mechanical arms that can operate elevators, an advance the company says could trim USD 1.8 billion in elevator-control costs worldwide each year.
- February 2025: KEENON Robotics joined forces with the Furama Hotel Chiang Mai to open Thailand’s first smart hotel, integrating DINERBOT, BUTLERBOT, KLEENBOT C30, and S100 heavy-load robots for fully automated front- and back-of-house operations.
- January 2025: Bear Robotics has closed a USD 81 million Series B round led by IMM Investment, bringing the total funding to USD 117 million to accelerate new product development and expand further into global hospitality markets.


Global Hospitality Robots Market Report Scope
Robotic systems are developed to execute a particular set of accurate, repetitive, and unparalleled tasks efficiently and with minimal human intervention. In the hospitality field, the robot's main aim is to speed up and enhance the overall guest experience; hence robot adoption has been growing in recent years.
The study analyzes various trends and factors impacting the growth of the hospitality robots market. To convey detailed insights, the study segments the market based on the type of robots used in the hospitality sector, the primary end users of hospitality robots, and various geographical regions. A section analyzing the impact of COVID-19 on the hospitality robots market is also a part of the study. The market sizes and forecasts are provided in terms of value (USD million) for all the above segments.
| Reception and Mobile Guidance Robots |
| Delivery Robots |
| Cleaning Robots |
| Food-Preparation Robots |
| Security and Surveillance Robots |
| Hardware |
| Software |
| Services |
| Hotels |
| Restaurants and Bars |
| Travel and Tourism Operators |
| Recreational Facilities, Events and Attractions |
| Front-of-House |
| Back-of-House |
| North America | United States |
| Canada | |
| Mexico | |
| South America | Brazil |
| Argentina | |
| Rest of South America | |
| Europe | Germany |
| United Kingdom | |
| France | |
| Italy | |
| Spain | |
| Rest of Europe | |
| Asia Pacific | China |
| Japan | |
| India | |
| South Korea | |
| South-East Asia | |
| Rest of Asia Pacific | |
| Middle East | Saudi Arabia |
| United Arab Emirates | |
| Turkey | |
| Rest of Middle East | |
| Africa | South Africa |
| Nigeria | |
| Rest of Africa |
| By Robot Type | Reception and Mobile Guidance Robots | |
| Delivery Robots | ||
| Cleaning Robots | ||
| Food-Preparation Robots | ||
| Security and Surveillance Robots | ||
| By Component | Hardware | |
| Software | ||
| Services | ||
| By End-User | Hotels | |
| Restaurants and Bars | ||
| Travel and Tourism Operators | ||
| Recreational Facilities, Events and Attractions | ||
| By Deployment | Front-of-House | |
| Back-of-House | ||
| By Geography | North America | United States |
| Canada | ||
| Mexico | ||
| South America | Brazil | |
| Argentina | ||
| Rest of South America | ||
| Europe | Germany | |
| United Kingdom | ||
| France | ||
| Italy | ||
| Spain | ||
| Rest of Europe | ||
| Asia Pacific | China | |
| Japan | ||
| India | ||
| South Korea | ||
| South-East Asia | ||
| Rest of Asia Pacific | ||
| Middle East | Saudi Arabia | |
| United Arab Emirates | ||
| Turkey | ||
| Rest of Middle East | ||
| Africa | South Africa | |
| Nigeria | ||
| Rest of Africa | ||


Key Questions Answered in the Report
What is the projected revenue for hospitality robots in 2031?
The market is forecast to reach USD 2.23 billion by 2031, supported by a 24.10% CAGR.
Which robot type is expanding fastest inside hotels and resorts?
Security and surveillance robots are advancing at a 26.1% CAGR as properties strengthen safety monitoring.
Why are restaurants adopting robotics more aggressively after 2024?
Robots cut repetitive table-runner tasks and maintain throughput, helping operators manage staffing gaps and enhance guest experience.
How do government incentives influence adoption in Asia Pacific?
Subsidies in Japan, Singapore, and China reduce upfront costs, enabling mid-market chains to deploy robots earlier in the investment cycle.
What integration hurdle slows down legacy hotel groups?
Outdated PMS platforms often lack APIs, adding middleware costs and elongating deployment timelines by several months.
Which components generate recurring revenues for suppliers?
Software subscriptions and analytics dashboards provide ongoing income as operators seek data-driven fleet management.
Page last updated on:


