
Hormone Replacement Therapy Market Size and Share
Market Overview
| Study Period | 2020 - 2031 |
|---|---|
| Market Size (2026) | USD 27.56 Billion |
| Market Size (2031) | USD 37.07 Billion |
| Growth Rate (2026 - 2031) | 6.12% CAGR |
| Fastest Growing Market | Asia-Pacific |
| Largest Market | North America |
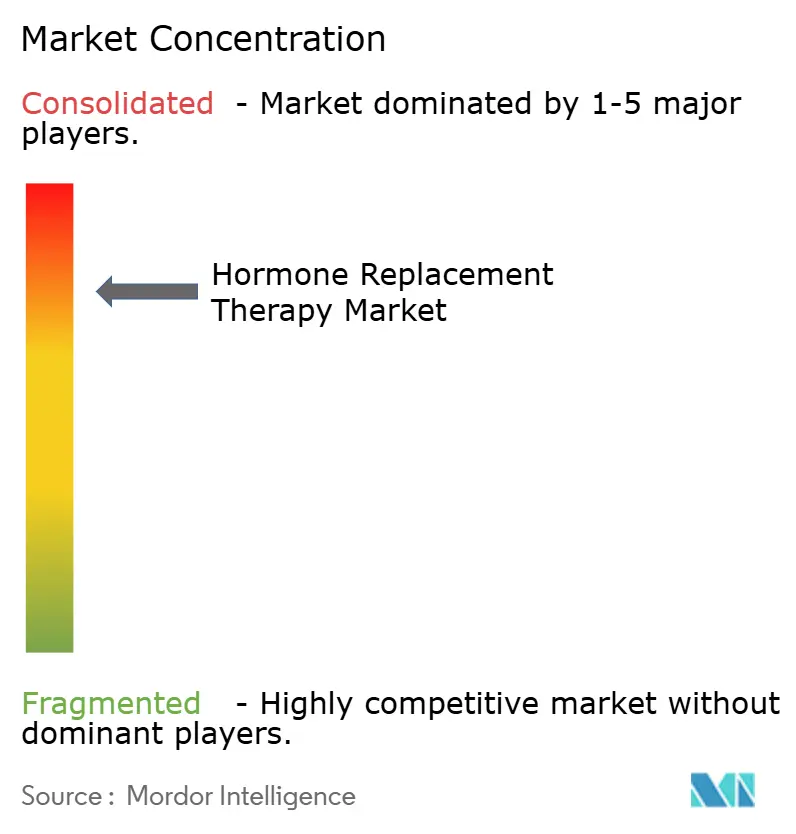
| Market Concentration | High |
Major Players *Disclaimer: Major Players sorted in no particular order Image © Mordor Intelligence. Reuse requires attribution under CC BY 4.0. | |
Hormone Replacement Therapy Market Analysis by Mordor Intelligence
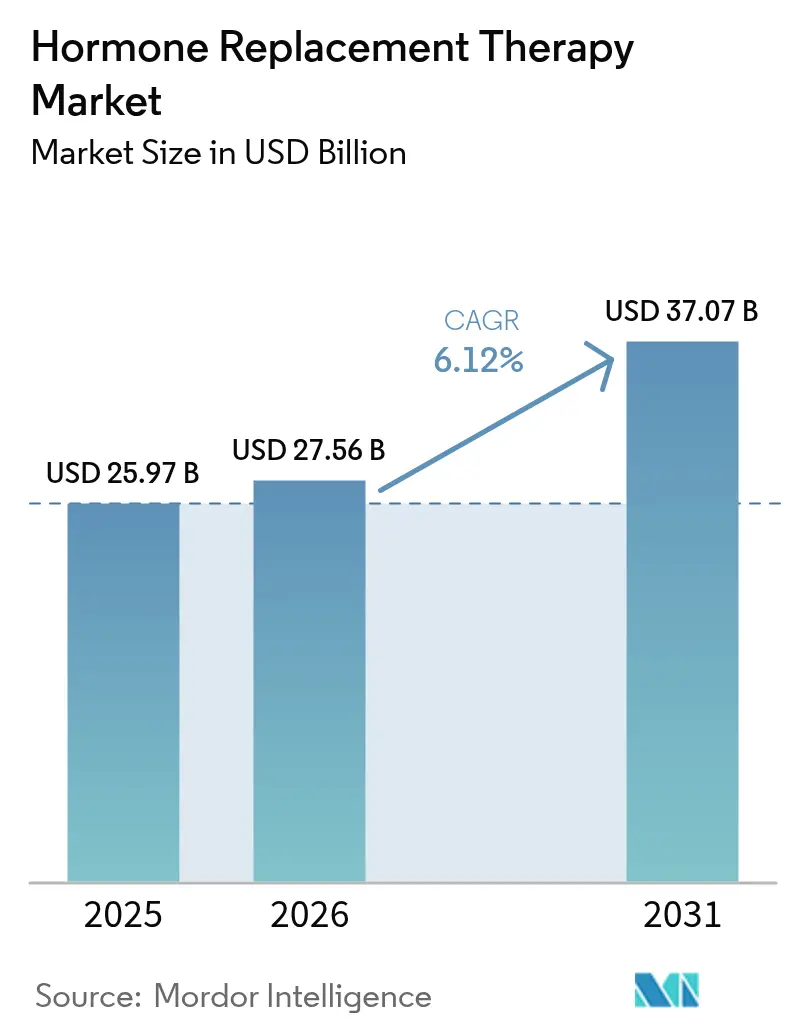
The hormone replacement therapy market size was valued at USD 25.97 billion in 2025 and estimated to grow from USD 27.56 billion in 2026 to reach USD 37.07 billion by 2031, at a CAGR of 6.12% during the forecast period (2026-2031). Demand grows in line with an aging demographic—women over 50 are projected to exceed 1.2 billion by 2030. Follow-up findings from the Women’s Health Initiative now distinguish risks across individual formulations, restoring physician confidence and widening candidate pools for treatment[1]Women’s Health Initiative Investigators, “Health Risks and Benefits of Estrogen,” JAMA, jamanetwork.com. Rapid telehealth adoption removes geographic barriers, while direct-to-consumer platforms deliver up to 90% cost savings and accelerate first-time user adoption. Reimbursement pathways keep expanding, as seen in Medicare coverage for medically necessary transgender regimens, which establishes precedents for broader hormonal care reimbursement models. Innovation attention has shifted toward non-hormonal neurokinin antagonists and tissue-selective modulators, positioning the hormone replacement therapy market for sustained mid-single-digit growth despite periodic safety debates and upcoming patent cliffs.
Key Report Takeaways
- By therapy type, estrogen therapies led with 42.10% revenue share in 2025, while parathyroid hormone recorded the fastest 8.23% CAGR forecast through 2031.
- By route of administration, oral delivery held 39.85% of the hormone replacement therapy market share in 2025; transdermal systems are projected to expand at 7.58% CAGR to 2031.
- By indication, menopause accounted for 47.80% share of the hormone replacement therapy market size in 2025, whereas hypoparathyroidism is advancing at a 8.90% CAGR through 2031.
- By distribution channel, hospital pharmacies controlled 52.10% revenue in 2025, yet online/direct-to-consumer channels are growing at 8.35% CAGR between 2026-2031.
- By geography, North America commanded 38.20% share in 2025, and Asia-Pacific is forecast to post the quickest 7.12% CAGR through 2031.
Note: Market size and forecast figures in this report are generated using Mordor Intelligence’s proprietary estimation framework, updated with the latest available data and insights as of 2026.
Market Trends and Insights
Drivers Impact Analysis of Hormone Replacement Therapy Market*
| Drivers Impact Analysis | (~) % Impact on CAGR Forecast | Geographic Relevance | Impact Timeline |
|---|---|---|---|
| Surging post-menopausal population | +1.8% | Global, led by Asia-Pacific and North America | Long term (≥ 4 years) |
| Rapid adoption of bio-identical hormones | +1.2% | North America and EU, expanding in Asia-Pacific | Medium term (2-4 years) |
| Tele-health BHRT subscription models | +0.9% | North America core, spill-over to developed markets | Short term (≤ 2 years) |
| Pipeline of micro-dosed & tissue-selective SERMs/SARMs | +0.7% | Global, with early uptake in North America and EU | Long term (≥ 4 years) |
| Wearable transdermal patch innovations & long-acting injectables | +0.6% | Global, with strongest traction in Europe and North America | Medium term (2-4 years) |
| Source: Mordor Intelligence | |||
Surging Post-Menopausal Population & Life-Expectancy Gains
Demographic momentum is enlarging the potential treatment pool as women now spend roughly one-third of their lives post-menopause. Workforce productivity losses, such as Japan’s USD 12 billion annual burden tied to unmanaged menopausal symptoms, nudge healthcare payers and employers toward proactive hormone care programs. Integrated longevity initiatives in public health strategies are creating sustained demand that moves beyond symptom relief toward long-term preventive regimens.
Rapid Adoption of Bio-Identical Hormone Formulations
Clinical evidence shows micronized progesterone and estradiol combinations exhibit lower cardiometabolic and oncologic risk than earlier conjugated equine estrogens, enabling 20-30% premium pricing and faster uptake among health-conscious mid-life women. TherapeuticsMD’s BIJUVA approval set a regulatory benchmark and, with patent protection to 2032, provides a defensible niche for innovators. Capacity expansion through acquisitions, exemplified by Biote’s purchase of 503B compounding facilities, secures supply while standardizing quality.
Expanding Tele-Health BHRT Subscription Models
The HRT Club illustrates how subscription models priced at USD 99 per year can trim overall therapy costs by up to 90%, adding 3,000 members across 42 states within months of launch. Weight-loss providers that already prescribe GLP-1 agents are entering hormone services, leveraging cross-selling opportunities supported by research suggesting enhanced outcomes when the two therapies are combined. Regulators are beginning to draft hybrid oversight requirements to ensure continuity of care.
Pipeline of Micro-Dosed & Tissue-Selective SERMs/SARMs
Late-stage assets such as Bayer’s elinzanetant, a dual neurokinin-1/3 receptor antagonist now under FDA review with a July 2025 decision date, aim to deliver vasomotor relief without systemic estrogen exposure. Parallel development of selective estrogen receptor degraders and modulators promises formulations targeting bone, cognition, and cardiovascular health separately, widening eligible patient sub-groups.
Restraints Impact Analysis of Hormone Replacement Therapy Market*
| Restraints Impact Analysis | (~) % Impact on CAGR Forecast | Geographic Relevance | Impact Timeline |
|---|---|---|---|
| Cancer-risk perception post-WHI | -1.1% | North America and EU | Medium term (2-4 years) |
| High lifetime therapy cost & few generics | -0.8% | Global, largest drag in emerging markets | Long term (≥ 4 years) |
| Patent-cliff & pricing pressure on legacy estrogen brands | -0.7% | Global, with highest impact in North America and EU | Medium term (2-4 years) |
| Tightening environmental rules on endocrine-active emissions | -0.5% | EU core, spreading to other regulated markets | Long term (≥ 4 years) |
| Source: Mordor Intelligence | |||
Cancer-Risk Perception After WHI & Follow-Up Studies
Though 21-year follow-up data indicate estrogen-only regimens reduce breast cancer incidence by 23% and mortality by 40%, the original 2002 WHI headlines still shape public opinion. Recent FDA boxed warnings, such as that applied to non-hormonal fezolinetant, keep safety debates visible and complicate physician messaging. Professional societies have updated positions to allow therapy beyond age 65 with individualized counseling, yet broad adoption hinges on continuous educational outreach.
High Lifetime Therapy Cost & Lack of Generic Bio-Identicals
Bio-identical combinations protected until 2032 hold back generic entry and sustain price premiums, limiting affordability in self-pay markets. While Medicare has improved transgender coverage, menopausal regimens still face budgetary hesitation. Direct-pay telehealth partly narrows the gap for affluent users, but lower-income populations in emerging economies remain underserved.
*Our forecasts treat driver/restraint impacts as directional, not additive. The impact forecasts reflect baseline growth, mix effects, and variable interactions.
Hormone Replacement Therapy Market Segment Analysis
By Therapy:
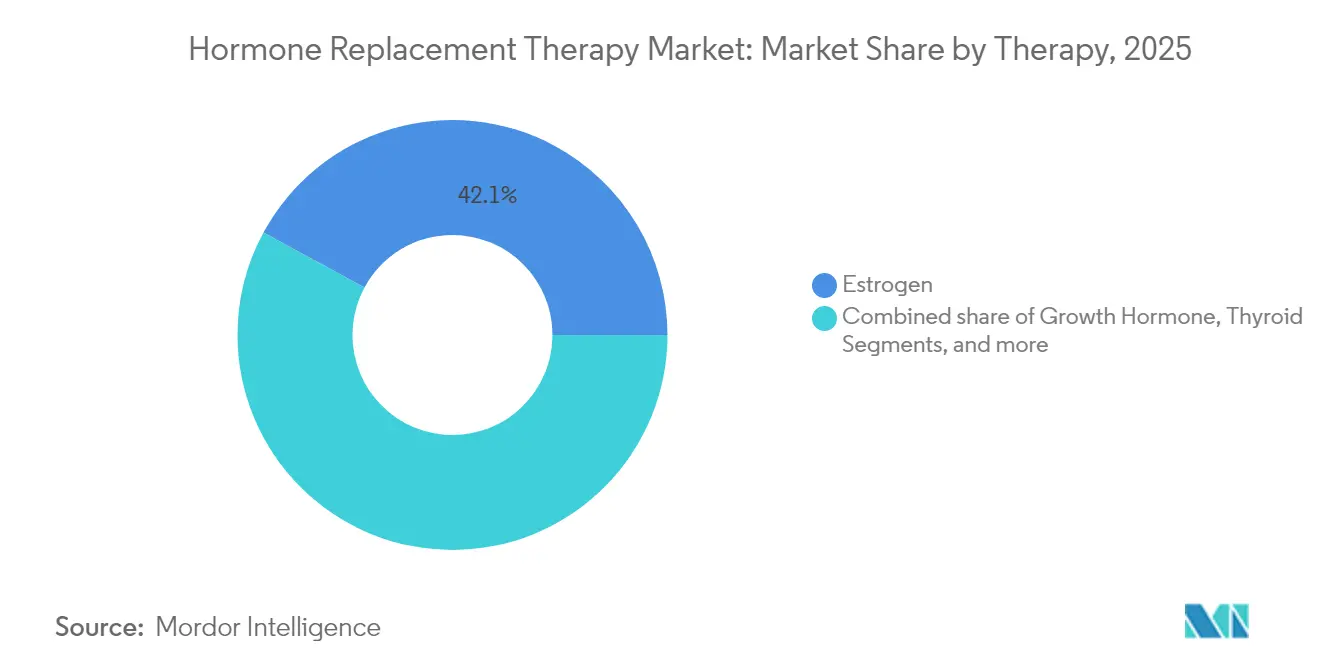
Estrogen Dominance Amid Parathyroid EmergenceEstrogen products retained 42.10% of 2025 revenue, underlining their central position in the hormone replacement therapy market. The parathyroid segment, however, is charting an 8.23% CAGR through 2031 as newer indications surface, pushing the hormone replacement therapy market size toward diversified growth corridors. Specialized products such as YORVIPATH for chronic hypoparathyroidism command premium pricing and underscore the shift from broad symptom control to targeted organ support.
Precision-oriented pipelines pair micro-dosed estrogens with tissue-selective modulators to serve nuanced patient profiles. Companies with multi-hormone portfolios are well positioned, whereas single-product players risk share attrition. Testosterone demand is dampened by heightened cardiovascular labeling while growth hormone continues steady uptake among longevity-focused consumers.



By Route of Administration:
Oral Convenience Versus Transdermal InnovationOral regimens held 39.85% share in 2025 and remain widely prescribed owing to convenience. Transdermal patches and gels, buoyed by a 7.58% forecast CAGR, offer consistent plasma levels without first-pass metabolism, helping the hormone replacement therapy market transition toward personalized dosing. Novartis’s Estradot micro-patch illustrates how miniaturized systems elevate compliance.
Long-acting injectables such as MIT’s SLIM microcrystal technology hint at quarterly or semi-annual dosing horizons. Vaginal and intrauterine devices continue to address local genitourinary symptoms with minimal systemic exposure, adding breadth to delivery choices.
By Indication:
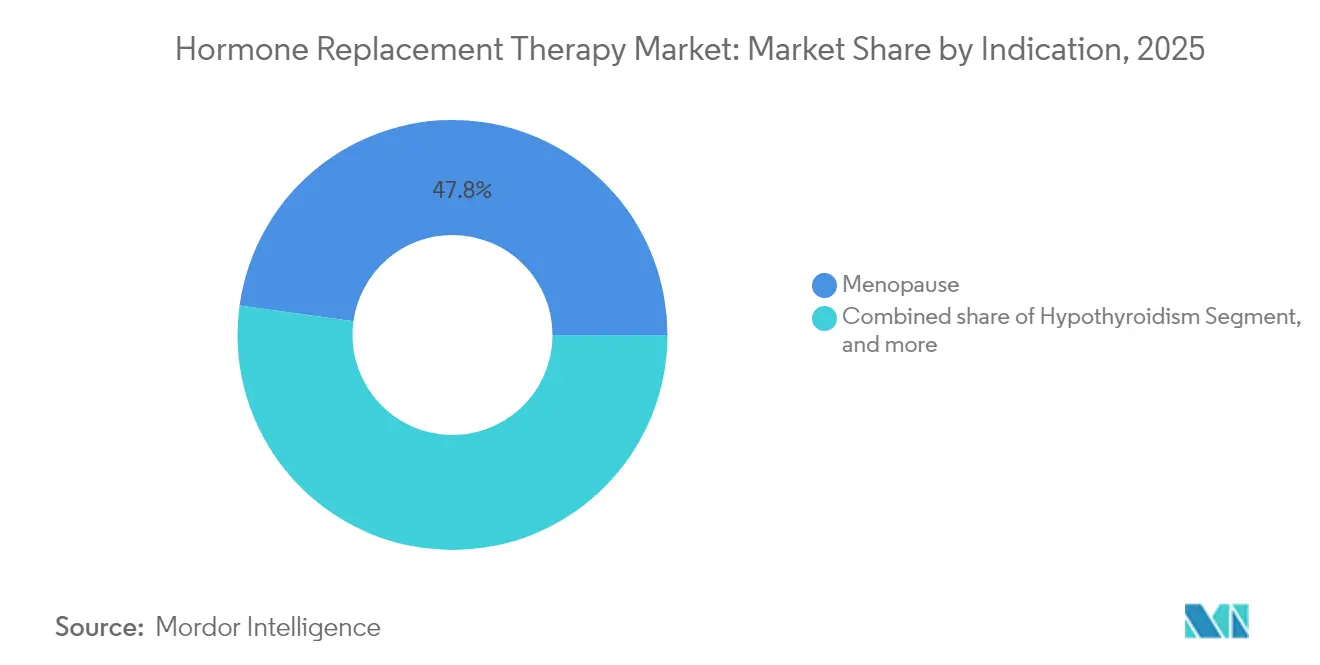
Menopause Dominance Challenged by Specialized ApplicationsMenopausal symptom treatment represented 47.80% of 2025 turnover, yet hypoparathyroidism’s 8.90% CAGR signals where the hormone replacement therapy market share could rebalance in the coming years. Broader diagnostic adoption for thyroid and growth hormone deficiencies keeps those niches resilient, while policy-driven expansion of gender-affirming care introduces entirely new patient cohorts.
Research exploring hormonal influences on biological aging may lengthen treatment duration, extending profitability per patient. For vasomotor symptoms in cancer survivors, non-hormonal agents under development provide alternatives, widening therapeutic combinations available to oncologists and endocrinologists.
By Distribution Channel:
Hospital Pharmacy Control Faces Digital DisruptionHospital dispensaries kept 52.10% of revenue in 2025, reflecting ingrained prescribing practices. Online platforms, however, are advancing at an 8.35% CAGR as streamlined onboarding attracts untreated populations, contributing disproportionately to overall hormone replacement therapy market growth. Retail pharmacies occupy a balanced middle ground by coupling walk-in convenience with insurance billing familiarity.
Direct-to-consumer operators leverage artificial intelligence to refine dosage and shipping cadence. Pharmaceutical manufacturers now juggle multichannel rollouts, ensuring quality oversight in telehealth settings while preserving institutional relationships in traditional care settings.
Geography Analysis
North America Hormone Replacement Therapy Market
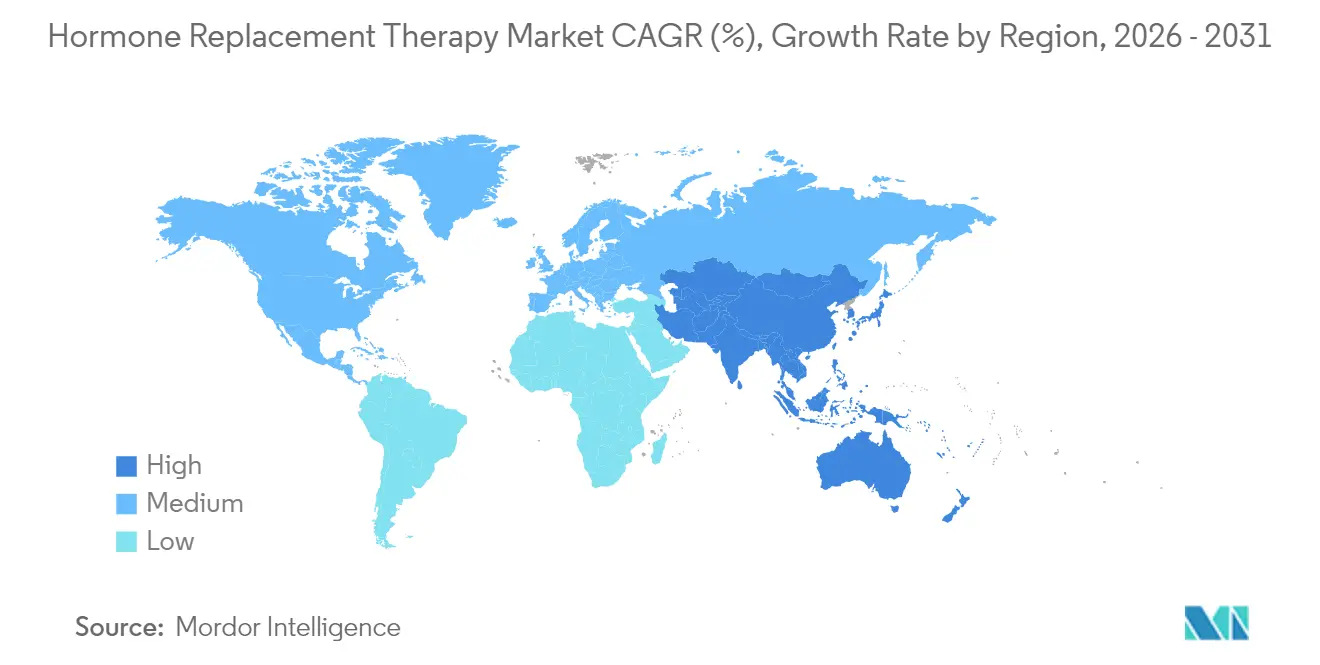
North America sustained 38.20% share in 2025 owing to strong reimbursement frameworks, FDA guidance clarity, and an ecosystem that supports rapid telehealth scaling. Medicare’s precedent on gender-affirming coverage signals how policy can unlock new segments. Generic estradiol gel approvals improve affordability, though upcoming patent expiries may pressure established brands.
APAC Hormone Replacement Therapy Market
Asia-Pacific is projected to grow at 7.12% CAGR through 2031. Rising urban incomes, aging populations, and shifting cultural perceptions on women’s health underpin uptake, while corporate Japan quantifies menopause-related absenteeism at USD 12 billion annually, spurring employer-financed wellness offerings. Regulatory pilots in China for gender-affirming therapies and increasing Indian middle-class purchasing power collectively expand the hormone replacement therapy market footprint across the region.
EMEA and South America Hormone Replacement Therapy Market
Europe shows steady, guideline-driven demand yet faces cost-effectiveness scrutiny by health technology assessment bodies. Tough environmental rules on endocrine-active emissions influence production costs, with the European Medicines Agency mandating statewide monitoring ema. Emerging regions across the Middle East, Africa, and South America present growth runways but require localization strategies that align with diverse cultural and regulatory landscapes.
Mordor Intelligence provides coverage of the hormone replacement therapy market across other key regional markets, including North America, each with their regulatory frameworks and demand patterns.

Regulatory Landscape
Hormone replacement therapies are regulated primarily as prescription drugs, with additional requirements when delivery systems are integral to product performance. In the United States, the FDA oversees labeling and postmarket safety communications, and for drug-device combinations it coordinates through the Center for Drug Evaluation and Research and the Center for Devices and Radiological Health.
In Europe, the EMA provides guidance for clinical investigations and fixed-combination products, while national policies can affect affordability, including Ireland’s Menopause Products Regulations 2025 (June 2025), which exempt menopause products from prescription charges. In February 2026, the FDA approved labeling changes for six menopausal hormone therapy products to update safety information and clarify benefit-risk considerations. Generic entry and lifecycle management are also shaped by regulator-issued development guidance. In December 2025, the FDA issued draft product-specific guidance supporting ANDA submissions for estradiol vaginal inserts, along with revised draft guidance for estradiol vaginal tablets, which can standardize expectations around bioequivalence and user-focused performance for locally acting products.
Competitive Landscape
Competition centers on differentiated science rather than pure scale. Bayer, Pfizer, Novartis, and other multinationals channel resources into tissue-selective modulators and non-hormonal receptor antagonists, illustrated by Bayer’s elinzanetant, projected as a multi-billion-dollar opportunity pending FDA approval. Mid-tier firms pursue consolidation: Cosette’s USD 430 million purchase of Mayne Pharma’s women’s health assets added 12 patent-protected brands including BIJUVA and IMVEXXY, expanding its reach across oral, vaginal, and combination products[3]Cosette Pharmaceuticals Press Release, “Acquisition of Mayne Pharma Women’s Health Portfolio,” ncbiotech.org.
Start-ups disrupt distribution through subscription telehealth, while biotech innovators employ AI-guided dosage algorithms and advanced polymer patches. Patent cliffs loom over legacy estrogens, freeing room for biosimilar entrants. Companies that integrate diversified delivery technologies with precision formulation pipelines stand best positioned to capture incremental hormone replacement therapy market share as therapy personalization accelerates.
Hormone Replacement Therapy Industry Leaders
Pfizer Inc.
Novo Nordisk A/S
Bayer AG
Abbott Laboratories
Merck KGaA
- *Disclaimer: Major Players sorted in no particular order
Hormone Replacement Therapy Market Companies Covered in this Report
- Abbott Laboratories
- Bayer
- Eli Lilly and Company
- Roche
- Merck
- Mylan Viatris
- Novartis
- Novo Nordisk
- Pfizer
- Amgen
- Abbvie
- Hisamitsu Pharma
- Endo International
- TherapeuticsMD
- BioTE Medical
- Viatris
- Ascend Therapeutics
- Acerus Pharma
- Johnson & Johnson
- Teva Pharmaceutical Industries

Market Opportunities and Future Outlook
A near-term opportunity is the introduction of new branded and generic building blocks across vaginal and oral segments, which supports broader regimen tailoring in menopause care. In March 2026, the European Commission granted marketing authorization for Gedeon Richter’s FYLREVY (estetrol tablet) for estrogen deficiency symptoms in postmenopausal women, widening patient choice beyond legacy estrogen profiles within regulated channels.
On access and affordability, April 2026 U.S. FDA final approval for Glenmark’s progesterone vaginal inserts (bioequivalent to Endometrin) adds a lower-cost progesterone option that can be paired with estrogen regimens in clinical practice when endometrial protection is needed. Delivery-led differentiation continues to stand out, especially for drug-device combination formats that improve adherence and help reduce exposure to supply volatility. Virtual and direct-to-consumer care models have also shifted distribution dynamics, and product strategies aligned with combination-product expectations, including performance, human factors, and device master file readiness where applicable, can reduce adoption friction in regulated markets. Recent clinical and product activity around transdermal and vaginal delivery, alongside ongoing FDA activity on labeling and generic development guidance for estradiol formats, continues to support innovation focused on user-friendly delivery systems and patient-specific dosing in mainstream prescription HRT.
Recent Industry Developments in Hormone Replacement Therapy Market
- June 2026: Ivim Health launched a women's hormone health program featuring the HormoneIQ assessment tool and HypoSpray, a transdermal estradiol prescription formulation addressing estrogen patch shortages. The rollout links virtual care with a transdermal delivery option and shows how access models and delivery technology are being used to streamline onboarding.
- February 2026: The Indian market expansion follows Dr. Reddy's Laboratories' acquisition of the Progynova and Cyclo-Progynova trademarks from Mercury Pharma Group Limited, reinforcing regional portfolio consolidation around established HRT brands. The acquisition could alter local brand availability and change commercialization intensity in a large, underserved menopause population base.
- October 2024: The FDA approved estradiol gel 0.06%, with clinical data cited for hot-flash reduction over a short initiation window. This approval broadened regulated transdermal estrogen options and increased competitive pressure on legacy formats where convenience and dose titration influence persistence.


Hormone Replacement Therapy Market Report Scope and Research Methodology
Market Definition and Coverage
This market covers prescription hormone replacement therapies used to restore or supplement human hormone levels, and it is measured as the value of drug sales across major geographies during the study period.
Scope exclusions: Non-prescription nutraceutical hormone products, veterinary hormones, puberty blockers used in gender-affirming care, and compounded bio-identical formulations dispensed by compounding pharmacies are excluded.
Segments Covered in This Report
- By Therapy
- Estrogen
- Growth Hormone
- Thyroid
- Testosterone
- Parathyroid
- By Route of Administration
- Oral
- Parenteral
- Transdermal
- Vaginal/Intra-uterine
- Implantable Pellets
- By Indication
- Menopause
- Hypothyroidism
- Growth Hormone Deficiency
- Other Indications
- By Distribution Channel
- Hospital Pharmacy
- Retail Pharmacy
- Online/Direct-to-Consumer Clinics
- Geography
- North America
- United States
- Canada
- Mexico
- Europe
- Germany
- United Kingdom
- France
- Italy
- Spain
- Rest of Europe
- Asia-Pacific
- China
- Japan
- India
- Australia
- South Korea
- Rest of Asia-Pacific
- Middle East & Africa
- GCC
- South Africa
- Rest of Middle East & Africa
- South America
- Brazil
- Argentina
- Rest of South America
- North America
Data Sources, Market Sizing, and Validation
Desk Research
Desk work starts with building a clean picture of the treated population and therapy usage, before we attach pricing and sales assumptions. We rely on public health and payer signals, such as CDC health statistics, NIH resources, FDA drug labels and safety communications, and WHO demographic and aging datasets, which help frame demand and usage boundaries.
To keep the inputs practical, we also review sources such as OECD health indicators, peer-reviewed clinical literature, investor presentations, and annual filings of manufacturers for evidence on product launches, label changes, and channel shifts. Where available, we use paid subscriptions for company financials and intelligence, patent databases, and shipment-level import and export views to cross-check supply signals and timing. These examples are not exhaustive, and many other public and paid sources are also referenced to collect data, validate assumptions, and clarify open questions.
Primary Interviews and Surveys
Primary work focuses on confirming real-world prescribing and access patterns, then refining our inputs for therapy mix, average course duration, and pricing progression. We interview and survey stakeholders such as clinicians, pharmacists, payers, distributors, and product managers across APAC, EMEA, and the Americas, so secondary signals can be checked, gaps can be filled, and key assumptions can be tested before finalizing the market model.
Distribution of primary research fieldwork respondents
| Company type | Respondent position | Region |
|---|---|---|
| Top tier: 28% | CXOs: 14% | APAC: 52% |
| Mid tier: 52% | Functional/Unit leaders: 26% | EMEA: 30% |
| Smaller Players: 20% | Managers: 60% | Americas: 18% |
Market-Sizing & Forecasting
Sizing is built using a top-down and bottom-up logic, with the main build starting from a treated-patient demand pool and therapy utilization rates, which are then converted into value using observed pricing and channel splits. The top-down side uses country-level demographic aging trends, menopause and hypogonadism prevalence references, diagnosis and treatment rates, and route-of-administration mix to reconstruct expected therapy volumes.
Totals are then checked with selective bottom-up approximations, such as sampling branded therapy packs and typical doses to estimate annual consumption, followed by applying average selling price ranges by region and channel to see if the implied revenue looks realistic. Inputs that matter most in this market include prescription switching between oral and transdermal products, reimbursement and copay changes, safety-related demand shifts, telehealth-driven access changes, and generic entry effects on price erosion. Forecasting is done using scenario analysis anchored to primary feedback on adoption and payer behavior, and it is supported with trend-based smoothing for stable lines where usage changes slowly. When direct data is thin for smaller countries, we bridge gaps using peer market analogs based on age structure, healthcare spend per capita, and similarity in reimbursement rules, and the assumptions are rechecked through expert calls.
Data Validation & Update Cycle
Outputs are validated through multiple checks so the final numbers do not rely on one single assumption. We compare modeled totals against independent signals, such as therapy class sales trends discussed in filings, public prescription and access indicators where available, and regional pricing bands, then review outliers before sign-off.
If a large variance is seen by country, therapy class, or channel, the assumptions are reopened and the most sensitive inputs are re-tested through follow-up outreach. Reports are refreshed annually, and interim updates are made when material events occur, such as label changes, major reimbursement updates, or notable product launches. Before delivery, a final review pass is completed so the client receives the most current view based on the latest verified information.
Mordor Intelligence's Hormone Replacement Therapy Market Size Compared With Other Published Estimates
Published market sizes for hormone replacement therapy can look far apart even when the topic sounds the same, because each study sets its own rules on what products to count, which patient groups to include, and which year is treated as the anchor. Differences also come from how prices are handled across channels and how quickly assumptions are refreshed after safety, payer, or generic-entry events.
The main gap comes from whether compounded bio-identical formulations and non-prescription hormone supplements are counted, and in Mordor Intelligence's model, only prescription hormone-replenishing drugs sold through tracked channels are included while those adjacent categories are left out to avoid double counting and inflated demand. Other drivers include whether the model is built from treated population and dosing patterns versus broader endocrine therapy revenue pools, along with how currency conversion timing and assumed price erosion from generics are applied.
Benchmark comparison
| Source | Market Size | Gaps in Research Methodology |
|---|---|---|
| Mordor Intelligence | USD 27.56 B (2026) | |
| Global Consultancy A | USD 19.04 B (2026) | Uses a narrower included-revenue view tied more tightly to selected therapy classes and indications, and it may apply more conservative channel coverage and faster price erosion assumptions, which lowers the 2026 value. |
| Industry Analytics B | USD 23.58 B (2024) | Reports a different base year and can blend historical endocrine treatment revenue with HRT, and with limited visibility into route mix shifts and payer-driven access, the conversion to therapy value can land lower than a treated-cohort build. |
Across the three figures, the spread is explained mostly by scope choices, base year differences, and how therapy mix and pricing are translated into revenue. By keeping inputs tied to visible demand drivers such as treated cohorts, dosing patterns, and channel-level pricing logic, the resulting estimate stays easier to trace and repeat when assumptions need to be updated.


Key Questions Answered in the Report
What is the current market size of hormone therapies?
The hormone replacement therapy market size was USD 27.56 billion in 2026 and is projected to reach USD 37.07 billion by 2031.
Which region leads global revenue?
North America held 38.20% of 2025 revenue, supported by favorable reimbursement and robust telehealth infrastructure.
Which therapy type is growing the fastest?
Parathyroid hormone products are forecast to expand at an 8.23% CAGR through 2031 due to broadened clinical use.
How are online platforms influencing access?
Direct-to-consumer services cut costs by up to 90% and are growing at an 8.35% CAGR, reshaping distribution dynamics.
What are the main safety concerns that limit uptake?
Persistent cancer-risk perceptions dating back to early WHI headlines continue to suppress therapy initiation despite new evidence clarifying lower risks for certain formulations.
Which innovation could redefine delivery convenience?
Long-acting injectable microcrystal depots under development at MIT signal a future of quarterly or semi-annual dosing intervals, enhancing adherence.
Page last updated on:






