
Hong Kong Used Car Market Size and Share
Market Overview
| Study Period | 2020 - 2031 |
|---|---|
| Forecast Data Period | 2026 - 2031 |
| Base Year Market Size (2025) | USD 1.82 Billion |
| Market Size (2026) | USD 1.97 Billion |
| Market Size (2031) | USD 2.94 Billion |
| Growth Rate (2026 - 2031) | 8.32 % |
| Market Concentration | Medium |
Major Players *Disclaimer: Major Players sorted in no particular order Image © Mordor Intelligence. Reuse requires attribution under CC BY 4.0. | |
Hong Kong Used Car Market Analysis by Mordor Intelligence
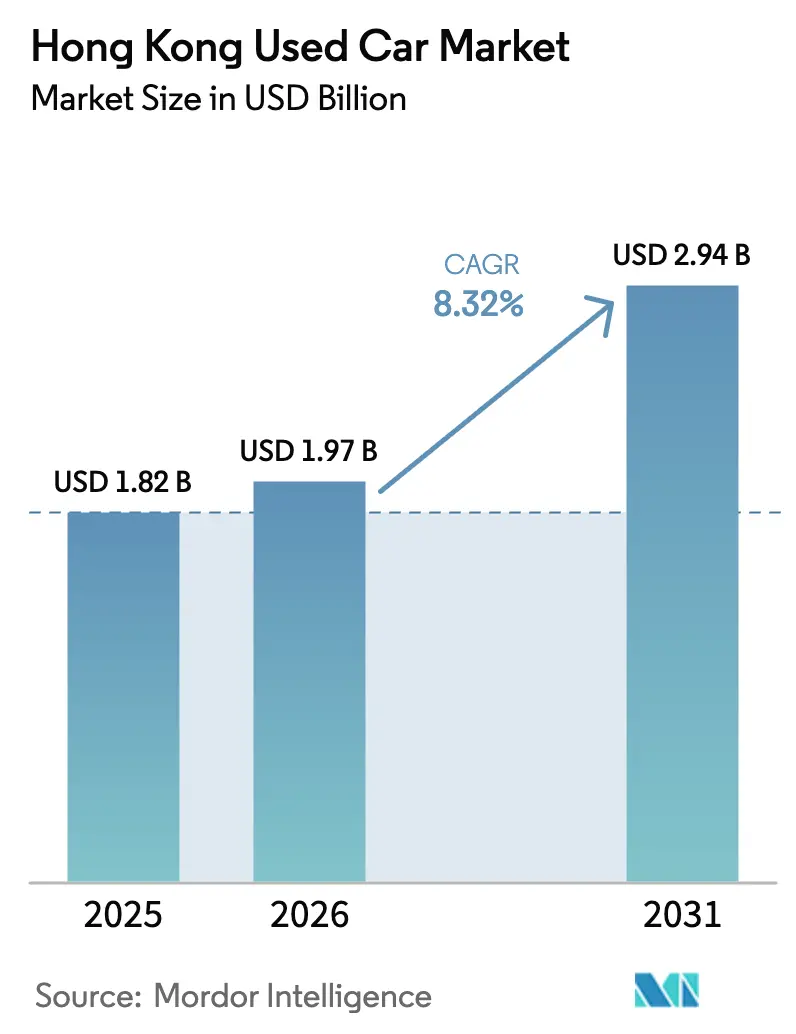
The Hong Kong used car market size was valued at USD 1.82 billion in 2025 and estimated to grow from USD 1.97 billion in 2026 to reach USD 2.94 billion by 2031, at a CAGR of 8.32% during the forecast period (2026-2031). Robust income levels, rapid electrification, and an increasingly digital retail environment position the Hong Kong used car market for sustained growth. City-wide EV incentives accelerate replacement cycles, while cross-border inventory flows under the Greater Bay Area framework increase vehicle variety and price competition. Organized dealers strengthen their footprint as consumers favor professional warranties and transparent vehicle-history checks. However, residual-value uncertainty for electric vehicles, scarce parking, and high tunnel tolls continue to cap demand elasticity.
Key Report Takeaways
- By vehicle type, sedans led with 35.02% of Hong Kong used car market share in 2025, while sport-utility vehicles are projected to advance at a 7.05% CAGR to 2031.
- By vendor type, organized vendors held 57.05% share of the Hong Kong used car market size in 2025 and are set to grow at 6.55% annually through 2031.
- By fuel type, petrol cars retained 62.58% share of the Hong Kong used car market size in 2025; battery-electric units are expanding at a 13.25% CAGR.
- By vehicle age, 3-5 years cohort captured 38.74% of Hong Kong used car market share in 2025, whereas the the 0-2 years bracket is rising fastest at a 9.85% CAGR.
- By price segment, cars priced above USD 30,000 commanded 28.55% of the Hong Kong used car market size in 2025 and are growing at 9.42% CAGR.
- By sales channel, offline segment accounts for 49.88% of the Hong Kong used car market size in 2025, online platforms are climbing at a 10.10% CAGR, confirming omnichannel uptake.
- By ownership, multi-owner units accounted for 65.72% of the Hong Kong used car marke share in 2025; first-owner resales are growing at 9.25% CAGR.
Note: Market size and forecast figures in this report are generated using Mordor Intelligence’s proprietary estimation framework, updated with the latest available data and insights as of 2026.
Hong kong contributes to a system defined not by any single country or region but by the interaction of many. The global used car market data by Mordor Intelligence represents that combined structure.
Hong Kong Used Car Market Trends and Insights
Drivers Impact Analysis*
| Driver | (~) % Impact on CAGR Forecast | Geographic Relevance | Impact Timeline |
|---|---|---|---|
| Rising Prices of New Vehicles | +2.8% | Hong Kong Island, Kowloon, New Territories | Medium term (2-4 years) |
| Online Used-Car Platforms' Penetration | +2.1% | Central, Tsim Sha Tsui, Sha Tin | Short term (≤ 2 years) |
| EV-Related Tax Incentives | +1.9% | New Territories, Kowloon | Medium term (2-4 years) |
| Cross-Border Inventory Flows | +1.2% | Shenzhen Bay, Lok Ma Chau border areas | Long term (≥ 4 years) |
| Digital Financing and E-Payment | +0.8% | Central, Admiralty, Causeway Bay | Short term (≤ 2 years) |
| Corporate-Fleet Downsizing | +0.6% | Central Business District, Kwun Tong | Medium term (2-4 years) |
| Source: Mordor Intelligence | |||
Rising Prices of New Vehicles
Higher first-registration tax brackets escalate new-car prices, steering value-minded buyers toward pre-owned alternatives. Scrappage-linked EV incentives of up to HKD 287,500 increase list prices for new electric models, widening the price gulf vis-à-vis used petrol sedans[1]Martin Choi, “Which are the top EV brands and bestselling models in Hong Kong?” South China Morning Post, scmp.com. Extended delivery lead-times caused by semiconductor shortages further redirect demand, especially within the USD 30,000-plus bracket that already holds 28.83% share. Currency swings affecting import costs heighten new-car sticker prices, reinforcing the appeal of the Hong Kong used car market.
Growing Penetration of Online Used-Car Platforms
Investor-backed platforms roll out AI-driven inspections, instant loan approvals, and home-delivery services, propelling online transactions at a double-digit pace. Smartphone ubiquity allows buyers to browse inventory and secure digital financing in minutes, compressing the purchase journey. Offline dealers respond with hybrid models, adding live-chat and virtual showrooms to preserve reach. The convenience and perceived transparency of e-commerce drive the Hong Kong used car market toward a digitally dominated future.
EV-Related Tax Incentives Stimulating Trade-ins
First-registration tax concessions valid to March 2026 accelerate trade-ups as early adopters chase newer battery technology. Used BEV listings grow at 14.03% CAGR, supported by the government target of 100% electric new-car sales by 2030. Conventional cars trade at steeper discounts, enabling budget buyers to enter the Hong Kong used car market, while lightly-used EVs command premium pricing due to supply scarcity and incentive spill-overs.
Cross-Border Inventory Flows Within Greater Bay Area
Tariff-free movement of vehicles between Hong Kong and Guangdong fosters arbitrage on luxury models and diversifies stock pools. Dealers exploit price differentials and currency spreads, although regulatory alignment on southbound driving quotas remains unfinished[1]. Long-run harmonization promises deeper inventory and leaner logistics costs, further globalizing the Hong Kong used car market.
Restraints Impact Analysis*
| Restraint | (~) % Impact on CAGR Forecast | Geographic Relevance | Impact Timeline |
|---|---|---|---|
| Trust and Transparency Concerns | -1.8% | Kowloon, New Territories | Short term (≤ 2 years) |
| Scarce Parking and High Ownership Costs | -1.4% | Hong Kong Island, Central, Tsim Sha Tsui | Long term (≥ 4 years) |
| EV Residual-Value Uncertainty | -0.9% | New Territories, Tseung Kwan O | Medium term (2-4 years) |
| Stricter Inspection and Compliance Cost | -0.7% | All regions | Medium term (2-4 years) |
| Source: Mordor Intelligence | |||
Trust and Transparency Concerns
Limited vehicle-history databases and inconsistent inspection standards fuel buyer skepticism. Although certified programs and return policies emerge, reputation-building requires time. Multi-owner cars dominate at 66.03%, but each additional handoff complicates valuation and negotiation. Strengthened consumer-protection statutes are still evolving, restraining shorter-term momentum in the Hong Kong used car market.
Scarce Parking and High Ownership Costs
Peak-hour tunnel tolls hit HKD 60 and core-district parking exceeds HKD 3,000 per month, inflating total cost of ownership. High fixed outlays dissuade marginal buyers, concentrating demand among households with secured parking or employer subsidies. While the Hong Kong used car market gains from affluent patrons, overall penetration stalls under these structural headwinds.
*Our forecasts treat driver/restraint impacts as directional, not additive. The impact forecasts reflect baseline growth, mix effects, and variable interactions.
Segment Analysis
By Vehicle Type: Sedans Lead Despite SUV Momentum
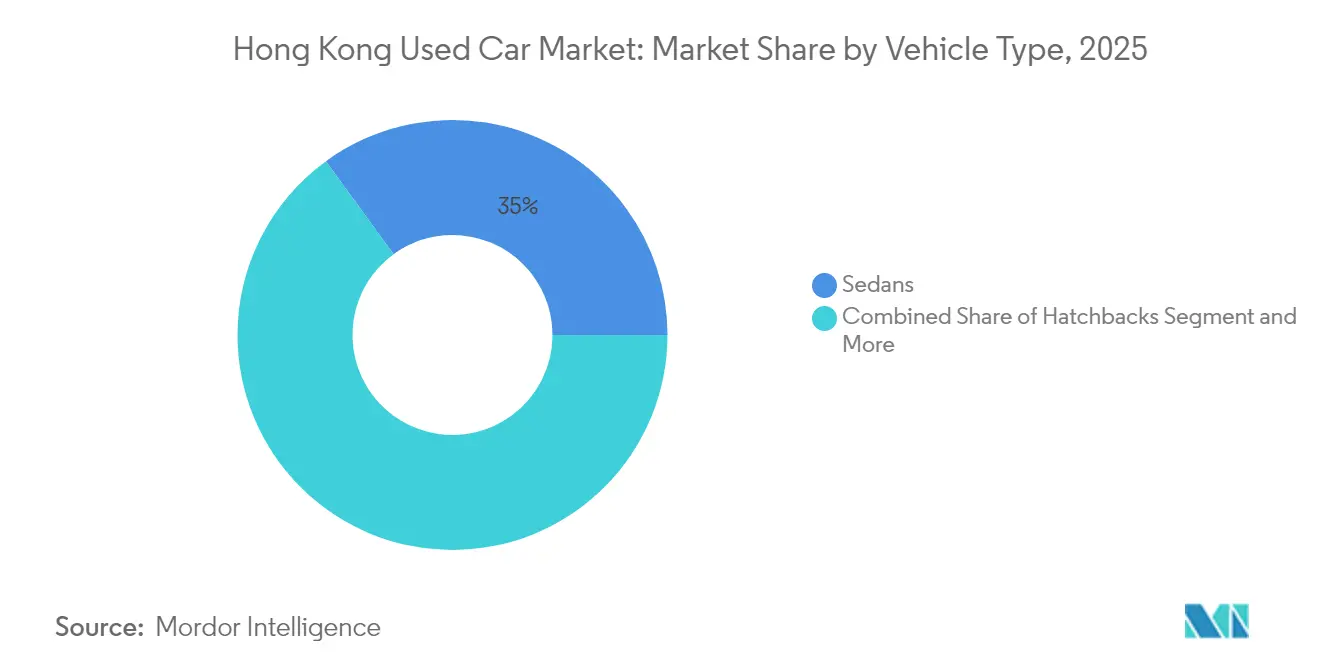
Sedans retained a 35.02% slice of the Hong Kong used car market in 2025, thanks to intuitive maneuverability in dense urban grids. Compact footprints support ease of parking, sustaining demand among commuter households. Sport-utility vehicles, however, are pacing ahead at 7.05% CAGR through 2031 as families seek taller seating, advanced safety suites, and upmarket styling. Hybrid mini-SUVs and emerging electric seven-seaters broaden appeal beyond luxury buyers. Hatchbacks stay relevant for novice drivers valuing low running costs. MPVs satisfy niche multi-generational travel, while convertibles and coupes populate prestige lanes at premium price points.
Modern SUVs integrate fold-flat seating, panoramic roofs, and Level 2 driver assists, narrowing the practicality gap with sedans. Expanded lane-keeping and park-assist systems lower accident risk, enhancing insurer appetite and buyer confidence. Dealers leverage augmented-reality showrooms to demonstrate cabin flexibility, nudging upgrades. Sedans nonetheless retain executive-fleet loyalty, aiding steady turnover in corporate off-lease channels. The dual-play of practicality and incentive-loaded EV SUVs ensures both body styles coexist and power total volume growth in the Hong Kong used car market.



By Vendor Type: Organized Channels Gain Market Share
Organized vendors controlled 57.05% of the Hong Kong used car market size in 2025, charting 6.55% annual growth. Branded showrooms deploy standardized 160-point inspections and offer one-year power-train coverage, fortifying trust. Transparent, algorithm-driven pricing shields buyers from negotiation fatigue, drawing digitally savvy millennials. Scale advantages deliver wider vehicle selection and integrated financing, reinforcing repeat patronage. Unorganized players lose ground as compliance costs rise and reputation metrics amplify competitive gaps.
Franchise alliances with OEMs inject certified-pre-owned badges that promise factory-grade refurbishment. Cross-selling of maintenance plans and insurance elevates margins, funding further network expansion. Social-media marketing funnels high-intent leads directly into booking engines, trimming acquisition costs. Although corner-lot dealers persist in value segments, rising consumer expectations tilt share toward structured players, cementing organized dominance in the Hong Kong used car market.
By Fuel Type: Petrol Dominance Faces Electric Disruption
Petrol vehicles still held 62.58% share of the Hong Kong used car market size in 2025, yet BEVs are outrunning at a 13.25% CAGR. Diesel demand slips amid clean-air directives and urban low-emission zones. Hybrids bridge the tech confidence gap for hesitant adopters, though their relative tax-benefit erosion tempers acceleration.
Battery replacement warranties and falling kilowatt-hour costs cushion resale-value fears, nudging cautious shoppers over the line. Petrol models remain favoured by long-distance chauffeurs due to broader refuelling infrastructure, sustaining baseline throughput. Nevertheless, electric disruption will continue siphoning share as battery swap stations edge into the New Territories, steering fuel mix transformation within the Hong Kong used car market.
By Vehicle Age: Premium on Newer Models
Cars aged 3-5 years attracted 38.74% of Hong Kong used car market share in 2025, offering factory warranty overlap alongside steep initial depreciation savings. Meanwhile, the 0-2 years cohort is accelerating at 9.85% CAGR as affluent drivers upgrade to fresh EV platforms and over-the-air software feature packs. Dealers lease back nearly-new units, enhancing affordability while maintaining inventory churn.
Six-to-eight-year cars garner attention from price-sensitive households but must clear stringent annual inspections. Units older than 12 years wrestle with parts scarcity and higher failure rates, prompting many owners to export or scrap instead of reselling locally. The up-trend toward newer vintages elevates average transaction value and compresses warranty claim exposure, ultimately boosting profitability across the Hong Kong used car market.
By Price Segment: Premium Vehicles Drive Growth
Cars priced above USD 30,000 delivered 28.55% of the Hong Kong used car market size in 2025 and outpaced all brackets at 9.42% CAGR. The affluent landscape, dominated by finance and professional-services executives, underpins the appetite for near-luxury badges. Buyers capture high-spec trims at 30-40% discounts to new-car MSRP, while dealers enjoy healthier gross margins.
The USD 20,000-29,999 range remains the mainstream battleground, blending residual warranty with family-friendly features. Sub-USD 5,000 units appeal primarily to commercial couriers or entry-level learners willing to shoulder maintenance uncertainties. Elevated ownership expenses encourage rationalization toward higher-quality stock, channeling dollars into vehicles that justify parking and toll outlays, thus shaping price-led stratification inside the Hong Kong used car market.

By Sales Channel: Digital Transformation Accelerates
Offline dealerships still hold 49.88% of the Hong Kong used car market in 2025, yet online transactions are rising at a 10.10% CAGR as mobile-first consumers pursue frictionless experiences. Virtual walkarounds, 360-degree imaging, and doorstep test drives defuse distrust, while embedded fintech approvals collapse loan processing from days to minutes.
Hybrid models merge tactile reassurance of physical lots with digital discovery, offering click-to-collect services. Auction platforms capture wholesale liquidity, helping dealers trim aging inventory. OEM-backed e-stores surface certified stock, tightening brand-loyalty loops. End-to-end digitization cements scale for the Hong Kong used car market, particularly as young buyers treat smartphones as the default showroom.
By Ownership: Multi-Owner Vehicles Dominate
Two-plus-owner cars represented 65.72% of the Hong Kong used car market in 2025, attesting to long-life-cycle utilization. Competitive insurance packages and improved build quality have stretched functional life, legitimizing higher hand transfer volumes. While perceived risk rises with each change, inspection tech and transparent service logs mitigate concerns.
First-owner resales, expanding at 9.25% CAGR, capture premium positioning by advertising known history and lower wear. Corporations cycling fleets every three years feed this supply, enabling predictable maintenance patterns for secondary buyers. Ownership history emerges as a decisive filter within digital listings, elevating confidence and shortening decision windows in the Hong Kong used car market.
Geography Analysis
Central districts on Hong Kong Island concentrate premium demand. Finance professionals earning high disposable incomes gravitate toward luxury sedans and compact electric SUVs despite HKD 60 peak tunnel charges. Parking scarcity compels investment in smaller footprints or private bays bundled with upmarket residences, sustaining elevated average deal sizes for the Hong Kong used car market.
Kowloon serves a mixed demographic, with families prioritizing practicality and affordability. Organized dealerships cluster in Mong Kok and Tsim Sha Tsui, leveraging dense footfall and MTR connectivity. The area’s role as a logistics node eases cross-border transfers, supporting inventory diversity. Digitally adept millennials embrace e-commerce, reinforcing a 6.55% organized-vendor CAGR. Trust-building initiatives, including video inspections and seven-day return windows, resonate strongly, further integrating Kowloon into the Hong Kong used car market.
The new territories register the highest growth arc, spurred by expanding satellite towns and easier on-street parking. Proximity to Shenzhen Bay and Lok Ma Chau encourages bilateral trade, enriching stock, especially of right-hand-drive EVs. Government charging grants for housing estates reduce range anxiety and lift BEV turnover. Family-centric buyers opt for SUVs and MPVs for weekend outings, strengthening the region’s influence on volume growth within the Hong Kong used car market.
The used car market is analyzed by Mordor Intelligence across multiple other geographies, with in-depth regional assessments available for Africa. This is complemented by country-specific insights for Myanmar, Sri Lanka, Kenya, New Zealand, Norway, Switzerland, Belgium, and Nigeria, reflecting various localized market behavior and policy environments' coverage.
Regulatory Landscape
Used-vehicle transactions in Hong Kong sit within a registration and licensing framework run by the Transport Department under the Road Traffic Ordinance (Cap. 374). For imported used vehicles, the Transport Department requires a pre-registration examination to verify roadworthiness and compliance with noise and exhaust-emission standards. This is supported by prescribed submissions, including form TD22, proof of third-party risk insurance, and export documentation from the country of origin.
Environmental compliance is overseen by the Environmental Protection Department, which requires emissions and noise evidence during the pre-registration process. That adds time and cost sensitivity for cross-border and overseas sourcing. Regulatory rollouts and compliance practicalities also show up through industry coordination with government via trade bodies such as the Motor Traders Association of Hong Kong, which engages the EPD and relevant policy bureaux.
Value Chain Analysis
Hong Kong used-car supply is supported by trade-ins at OEM-franchised dealers, off-lease and corporate fleet rotations, and imported stock that must clear Transport Department pre-registration checks before first registration and licensing. Franchised distributor networks and organized dealer groups handle procurement and refurbishment, with certified programs such as DCH Certified Used Car operating within Hong Kong Motor City to standardize inspection and warranty packaging and reduce buyer uncertainty.
Downstream, third-party inspection and verification services reinforce transaction trust. Hong Kong Motor Inspection (HKMI) is one example that complements dealer-led checks. Financing and insurance partners work alongside dealer and platform channels to complete the purchase journey, while trade associations act as coordination nodes across the market. The Motor Traders Association of Hong Kong represents distributor and trader interests, and the Service Managers Association interfaces within the automotive trade and coordinates with the Electrical and Mechanical Services Department (EMSD) on EV workshop registration and standards, which is increasingly relevant as used EV volumes expand.
Competitive Landscape
Market concentration remains moderate, with DCH Motors, Zung Fu, and VINS Motors collectively holding a subtle market share. Digital disruptors scale swiftly by blending AI diagnostics, seamless financing, and post-sale guarantees, pressuring traditional dealer economics. Strategic acquisitions, such as a leading platform integrating a local classified portal in 2024, signal accelerating consolidation.
Top dealers hedge residual-value risk by offering battery-health certificates on used EVs, enhancing pricing power. Cross-border sourcing teams exploit arbitrage in Guangdong, importing late-model luxury SUVs to satisfy domestic margin targets. Franchise dealers leverage parent-brand tooling to refurbish and remarket trade-ins under certified umbrellas, lifting trust metrics among risk-averse customers.
Smaller independents carve niches in kei cars, collector classics, or budget vans, where personalized service trumps scale. Technology adoption gaps widen cost curves; AI-enabled dynamic pricing confers an edge to larger platforms. Over the medium term, partnership ventures with ride-hailing companies and subscription fleets promise fresh downstream demand, sustaining momentum in the Hong Kong used car market.
Hong Kong Used Car Industry Leaders
VIN’S MOTORS COMPANY LTD
Kam Lung Motor Group
Zung Fu Limited
Hong Kong Motor City
DCH Motors Limited
- *Disclaimer: Major Players sorted in no particular order


Market Opportunities and Future Outlook
A key whitespace in Hong Kong is scalable trust infrastructure for used EVs and higher-value used cars. Residual-value concerns and uneven inspection practices create friction for buyers, especially when verification is not consistent across sellers. This supports demand for standardized, third-party verified inspection and battery-health disclosures bundled into certified offerings, building on the shift toward organized vendors and visible certified inventories, such as DCH Certified Used Car within Hong Kong Motor City listing a certified stock base of over 100 vehicles.
Another opportunity is in import and cross-border sourcing execution. Compliance-heavy pre-registration requirements, including Transport Department examinations and Environmental Protection Department emissions and noise documentation, reward operators that can industrialize documentation, testing, and vehicle-conditioning workflows. As trade bodies such as the Motor Traders Association of Hong Kong continue engagement with regulators on implementation schedules, dealers and platforms that align early with evolving compliance and EV workshop standards, including EMSD-linked workshop readiness coordinated within the trade, can differentiate on turnaround time, warranty coverage, and aftersales capability as the used-vehicle mix becomes more electrified.
Recent Industry Developments
- June 2026: Zung Fu Company Limited's Commercial Vehicles team participated in HKIE EV technical sharing session on New Energy Commercial Vehicles - Practical Deployment Experience in Hong Kong. The session highlights NEV deployment practices in Hong Kong's commercial segment and supports grid charging strategy and fleet electrification capabilities for Hong Kong NEV growth.
- June 2026: Zung Fu Company Limited's DENZA named official Green Mobility Partner for the 28th ANOC General Assembly to be held in Hong Kong (Dec 2026). The partnership places DENZA and Zung Fu in a high-visibility context and may support fleet deals and warranty-driven used EV demand.
- April 2026: Zung Fu Company Limited participated in the BYD APAC Dealer Conference 2026 in Shenzhen, representing the DENZA General Distributorship in HK and reviewing fast-charging and Blade Battery tech. The Hong Kong DENZA branding and charging technology adoption alignment reinforces ties within the Hong Kong EV ecosystem and helps accelerate deployment of fast-charging technology for the Hong Kong used EV segment.


Research Methodology Framework and Report Scope
Market Definition and Coverage
For this study, the Hong Kong used car market is measured as the value generated from transactions of pre-owned passenger and commercial vehicles that are bought and sold within Hong Kong through organized and unorganized selling channels.
Scope exclusions: We exclude brand-new vehicle sales, long-term rentals and leasing revenues, and pure service revenues that are not bundled into the used vehicle transaction value.
Segmentation Overview
- By Vehicle Type
- Hatchbacks
- Sedans
- Sport-Utility Vehicles (SUVs)
- Multi-Purpose Vehicles (MPVs)
- Others (convertibles, coupes, crossovers, sports cars)
- By Vendor Type
- Organised
- Unorganised
- By Fuel Type
- Petrol
- Diesel
- Hybrid (HEV and PHEV)
- Battery-Electric (BEV)
- LPG / CNG / Others
- By Vehicle Age
- 0 to 2 Years
- 3 to 5 Years
- 6 to 8 Years
- 9 to 12 Years
- Above 12 Years
- By Price Segment
- Below USD 5,000
- USD 5,000 to USD 9,999
- USD 10,000 to USD 14,999
- USD 15,000 to USD 19,999
- USD 20,000 to USD 29,999
- USD 30,000 and Above
- By Sales Channel
- Online
- Digital Classified Portals
- Pure-play e-Retailers
- OEM-Certified Online Stores
- Offline
- OEM-Franchised Dealers
- Multi-brand Independent Dealers
- Physical Auction Houses
- Online
- By Ownership
- First-owner Resale
- Multi-owner
Data Sources, Market Sizing, and Validation
Desk Research
Desk research was used to set the starting point for demand signals and pricing context in Hong Kong, and then to keep definitions consistent across years. We mainly relied on official transport and registration statistics, customs trade records for vehicles, and inflation and consumer indicators so the model does not mix non-comparable series.
Public sources that helped anchor the model included Hong Kong Transport Department registration and licensing statistics, Hong Kong Census and Statistics Department macro and household indicators, and Hong Kong Customs and Excise Department trade releases. We also used International Energy Agency (IEA) data for EV adoption context and World Bank macro series to cross-check the economic direction. In addition, we reviewed listed-company filings and investor presentations from relevant distributors and dealers, plus reputable press coverage on used-car pricing, EV incentives, and cross-border flows. Where needed, we used paid subscriptions for company financials and intelligence, news and financials, and automotive car sales datasets to validate revenue ranges and the timing of market shifts. The sources listed here are illustrative rather than exhaustive, and additional public and paid references were used to collect data, validate assumptions, and clarify open questions during the study.
Primary Interviews and Surveys
Primary work was used to confirm what drives transaction value in Hong Kong, especially how stock availability, consumer financing, and warranty expectations change realized pricing. We spoke with a mix of dealer groups, independent dealers, vehicle import and remarketing participants, lenders and insurers tied to auto financing, and channel specialists covering both physical lots and online listings. These conversations helped us close gaps and test assumptions across the territory.
Distribution of primary research fieldwork respondents
| Company type | Respondent position |
|---|---|
| Top tier: 32% | CXOs: 15% |
| Mid tier: 51% | Functional/Unit leaders: 32% |
| Smaller Players: 17% | Managers: 53% |
Market-Sizing & Forecasting
Sizing starts with a top-down build where vehicle ownership and scrappage patterns are used to reconstruct the active used-vehicle turnover pool, which is then converted into value using price-band and age-band mixes. To keep the totals realistic, we corroborate this with selective bottom-up checks, such as sampled listing price bands adjusted for typical negotiation gaps, dealer throughput benchmarks, and channel checks on common commissions and add-ons.
Key inputs used in the model include annual used-vehicle turnover intensity (as a share of the circulating vehicle park), import and re-export signals that affect available inventory, the mix shift toward EVs and hybrids that changes residual values, average selling price movement by vehicle age bracket, and financing availability that impacts purchase conversion. Where direct volume signals were thin for a slice, gaps were handled by using conservative mix assumptions that were tested through interviews and then checked against total registrations and affordability indicators.
For forecasting, scenario analysis was used with a base case shaped by expert views on supply normalization, EV incentive continuity, and household spending direction. The outputs were then checked against expected changes in turnover rate and ASP movement so the forecast stays explainable and repeatable year to year.
Data Validation & Update Cycle
Validation is done in layers so the final number is not driven by one data series. Our analysts compare the modeled value trend against independent signals such as vehicle registration movements, observable price-band shifts, and changes in inventory availability, and then investigate any large variances before final sign-off.
If an input changes sharply, such as a policy change affecting EV adoption, a sudden financing tightening, or a noticeable break in pricing, the team re-contacts selected participants to confirm whether the shift is temporary or structural. Reports are refreshed annually, and interim updates are made when material events can change the near-term trajectory. Before delivery, a final review pass is completed so clients receive the latest consistent view across definitions, assumptions, and calculations.
Mordor Intelligence's Hong Kong Used Car Market Size Measured Against Other Published Estimates
Published market sizes for Hong Kong used cars can look different because groups do not always count the same transaction types, and because pricing assumptions vary widely in a fast-moving market. Differences also show up when one estimate leans more on listings and stated prices, while another is anchored on realized transaction behavior and turnover.
By tracking turnover derived from registration-linked signals, checking age and price-band mixes, and refreshing realized ASPs from dealer and lender inputs, Mordor Intelligence keeps the estimate aligned to in-territory resale transactions instead of using unadjusted asking prices or including re-exported units twice.
Benchmark comparison
| Source | Market Size | Gaps in Research Methodology |
|---|---|---|
| Mordor Intelligence | USD 1.82 B (2025) | |
| Trade Portal A | USD 1.72 B (2025) | Often leans on advertised listing prices and a narrower dealer-heavy view, which can undercount informal transfers and miss negotiation-driven price reductions in final sale value. |
| Industry Blog B | USD 2.10 B (2026) | Commonly rolls forward value using aggressive ASP growth and assumes higher turnover from EV-driven replacement, with limited checks against registration trends and inventory constraints. |
The spread mainly comes from how turnover is reconstructed and how selling prices are normalized from what is advertised to what is typically realized. When scope is limited to certain channels or prices are not adjusted for discounts and mix shifts, market value can move up or down quickly. Using consistent inclusion rules, repeatable turnover logic, and interview-validated pricing checks helps keep the number transparent and easier to defend.


Key Questions Answered in the Report
What is the current size of the Hong Kong used car market?
The market is valued at USD 1.97 billion in 2026 and is projected to reach USD 2.94 billion by 2031.
Which vehicle type leads sales in the Hong Kong used car market?
Sedans led with 35.02% share, while SUVs are the fastest growing at a 7.05% CAGR.
How quickly are online sales channels growing?
Online transactions are expanding at a 10.10% CAGR, reflecting rapid digital adoption.
What impact do EV incentives have on the Hong Kong used car market?
Tax concessions valid until 2026 spur trade-ins and push battery-electric vehicle listings to a 13.25% CAGR.
Which vendor segment is gaining ground?
Organized dealers hold 57.05% share and are growing at 6.55% annually, aided by warranties and transparent pricing.
Page last updated on:


 Your data is secure and never sold or shared.


