Canada Used Car Market Size and Share
Market Overview
| Study Period | 2019 - 2031 |
|---|---|
| Forecast Data Period | 2026 - 2031 |
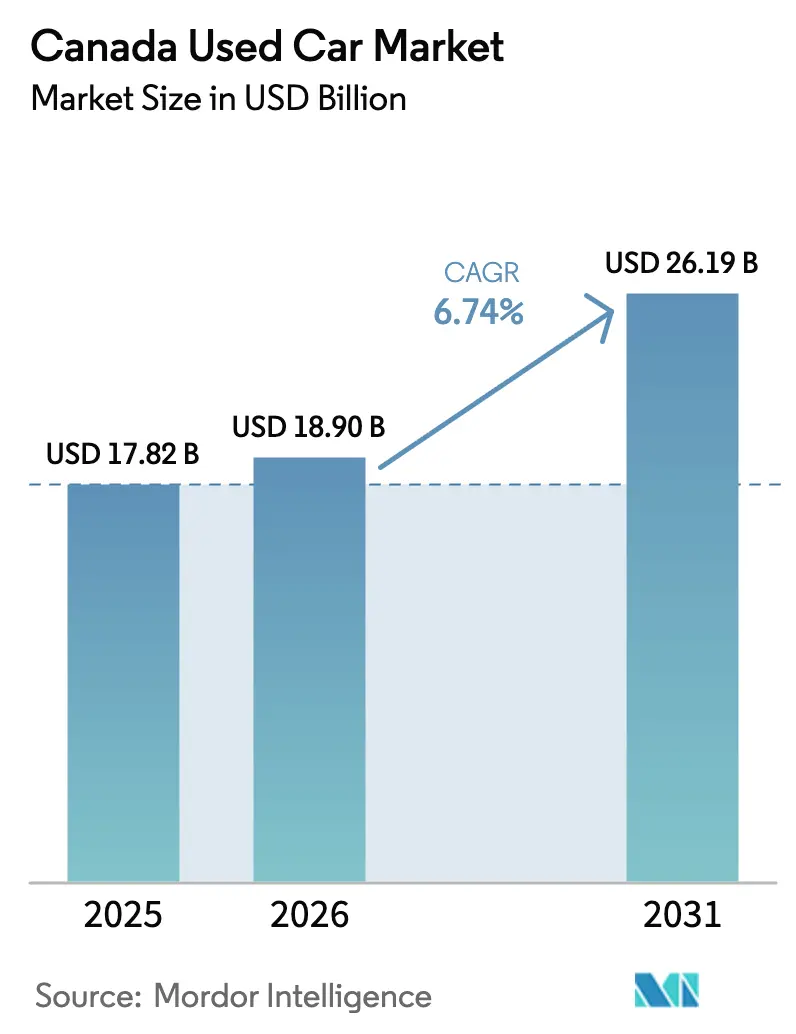
| Base Year Market Size (2025) | USD 17.82 Billion |
| Market Size (2026) | USD 18.90 Billion |
| Market Size (2031) | USD 26.19 Billion |
| Growth Rate (2026 - 2031) | 6.74% CAGR |
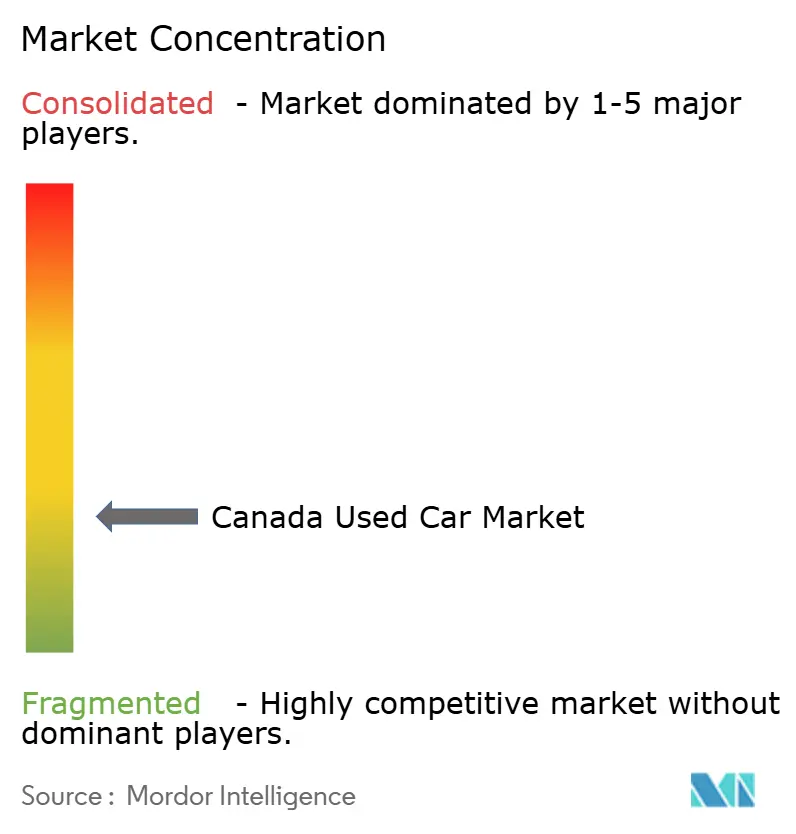
| Market Concentration | Low |
Major Players *Disclaimer: Major Players sorted in no particular order Image © Mordor Intelligence. Reuse requires attribution under CC BY 4.0. | |
Canada Used Car Market Analysis by Mordor Intelligence
The Canadian used car market size was valued at USD 17.82 billion in 2025 and estimated to grow from USD 18.90 billion in 2026 to reach USD 26.19 billion by 2031, at a CAGR of 6.74% during the forecast period (2026-2031). Structural growth stems from organized digital platforms rather than a mere rebound from pandemic-era supply shocks. The spread of AI-powered search tools, used by 17% of shoppers in 2025, has compressed research cycles and rewarded retailers that publish real-time pricing and inspection data. At the same time, battery-health diagnostics have alleviated residual-value concerns surrounding used EVs, while OEM-backed certified pre-owned (CPO) programs convert lease returns into high-margin inventory. Consolidation among franchise groups, such as AutoCanada, alongside FINTRAC’s new anti-money laundering rules, is reducing compliance costs while improving overall trust. Demand fundamentals remain solid because public transit coverage outside the cores of Toronto, Montréal, and Vancouver is still limited, thereby anchoring private-vehicle ownership.
Key Report Takeaways
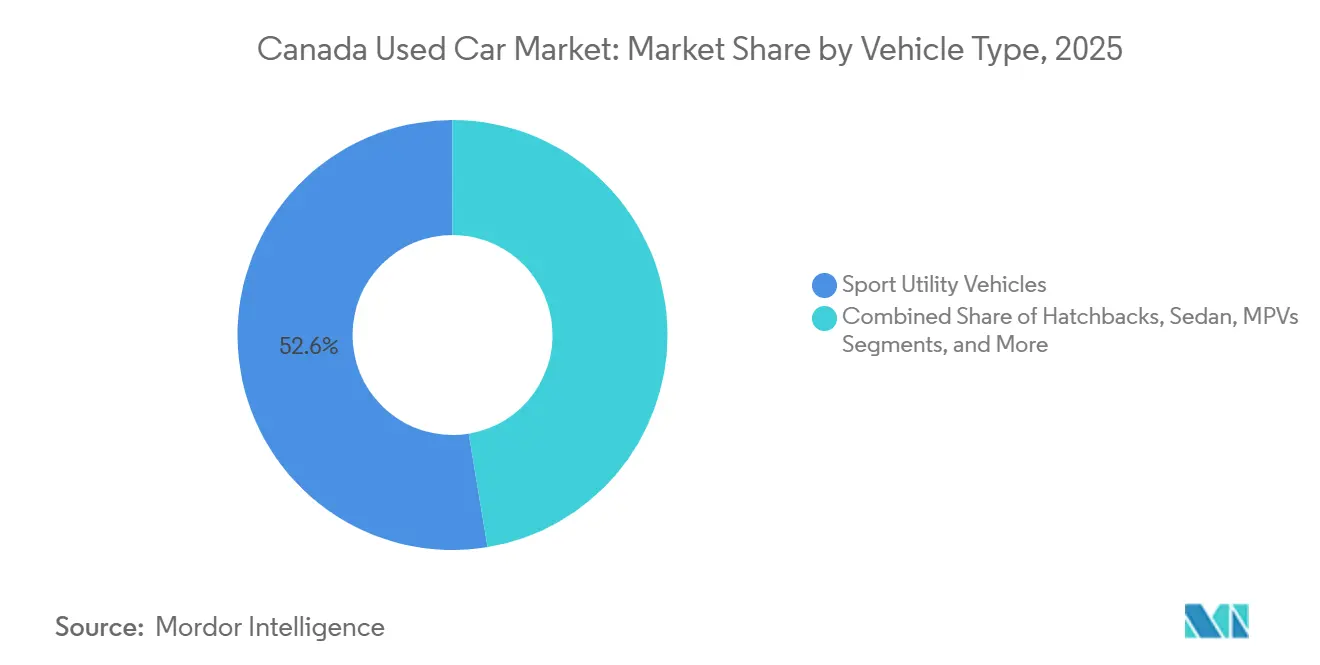
- By vehicle type, sports utility vehicles captured 52.61% of 2025 sales; the same sub-segment is projected to post a 9.44% CAGR over 2026-2031.
- By vehicle age, 3-to-5-year units held 40.32% share in 2025, while the 0-to-2-year bracket is on track for an 11.22% CAGR through 2031.
- By price segment, the USD 10,000-to-USD 14,999 band accounted for 37.58% of 2025 volume; inventory priced up to USD 30,000 is expected to advance at a 7.14% CAGR in the forecast period.
- By vendor type, organized dealers accounted for 62.18% of transactions in 2025 and are forecasted to expand at a 6.89% CAGR between 2026 and 2031.
- By fuel type, petrol units led with a 61.27% share in 2025, whereas electric vehicles represented the fastest-growing segment with a 10.2% CAGR to 2031.
- By sales channel, online digital classifieds held a 55.06% share in 2025, while pure-play e-retailers are projected to rise at a 12.75% CAGR from 2026 to 2031.
Note: Market size and forecast figures in this report are generated using Mordor Intelligence’s proprietary estimation framework, updated with the latest available data and insights as of January 2026.
Companies active in Canada may frequently operate across several geographies, linking regional presence to global strategy. Mordor Intelligence captures the entire market landscape of the global used car industry and how these positions are distributed.
Canada Used Car Market Trends and Insights
Drivers Impact Analysis*
| Driver | (~) % Impact on CAGR Forecast | Geographic Relevance | Impact Timeline |
|---|---|---|---|
| OEM CPO Expansion | +1.5% | National, led by major franchise hubs | Medium term (2-4 years) |
| Price Advantage vs New | +1.3% | National, acute in Alberta and Saskatchewan | Short term (≤ 2 years) |
| Online Marketplace Shift | +1.2% | National, concentrated in Ontario, Québec, British Columbia metros | Short term (≤ 2 years) |
| Vehicle History Transparency | +0.9% | National, strongest in organized-dealer segment | Short term (≤ 2 years) |
| Battery Diagnostics Confidence | +0.8% | British Columbia, Québec, Ontario | Medium term (2-4 years) |
| Incentive Stacking Credits | +0.6% | Québec, British Columbia | Long term (≥ 4 years) |
| Source: Mordor Intelligence | |||
Expansion of OEM-Backed Certified Pre-Owned Programs
Brands like Toyota, Honda, BMW, and Subaru, along with several others, have expanded their Certified Pre-Owned (CPO) programs, channeling off-lease returns into digital storefronts nationwide. These initiatives, which offer multi-point inspections and factory warranties, are helping Canada's used car market experience significant growth in the 0- to 2-year-old segment. AutoCanada, a consolidated group, showcases a cross-brand CPO inventory online, enabling shoppers in Winnipeg to reserve a unit in Calgary and finalize paperwork remotely. In contrast, independent dealers without original equipment manufacturer affiliations are struggling with margin compression, as they are unable to match the warranty economics. Looking ahead, CPO penetration is poised to expand beyond luxury brands, infiltrating mainstream sedans and crossovers, thereby further solidifying the dominance of organized dealers.
Favorable Price Differential Versus New Vehicles amid Inflation
Average used car prices remain significantly lower than comparable new-model MSRPs. The Bank of Canada has maintained a restrictive policy rate, which has led to increased financing rates and strained household budgets. Budget-conscious shoppers are focusing on a specific price range, which holds a significant share of sales. Dealers in Alberta and Saskatchewan are adjusting their inventory accordingly, prioritizing older, higher-mileage SUVs and pickups that are still mechanically reliable. Price transparency tools that convert sticker values into monthly payments have become critical in aiding sales conversions.
Accelerating Consumer Shift to Online Marketplaces
Digital classified portals dominate a significant share of transactions, while pure-play e-retailers are growing at a much faster rate compared to traditional dealer sites [1]“2025 Year-End Used Vehicle Market Analysis,”, AutoTrader.ca, AutoTrader.ca. Many buyers are utilizing AI-driven filters to sort inventory by payment, fuel economy, and collision history, significantly reducing their research time. Online transactions in automotive retail are expected to continue growing, supported by advancements such as electronic lien releases and odometer certifications [2]“Digital Transformation of Vehicle Titling,”, Transport Canada, tc.gc.ca. Dealers relying on phone-based negotiations risk losing market share to platforms that offer features such as click-to-delivery, extended return windows, and bundled financing. As data transparency becomes standard, profit margins are increasingly shifting toward ancillary products—such as service contracts and gap insurance—rather than vehicle markups.
Growing Availability of Vehicle-History and Inspection Transparency
CARFAX Canada identified odometer rollbacks in a significant portion of the units it inspected, emphasizing why buyers are willing to pay a premium for certified vehicles. To address these concerns, the Ontario Motor Vehicle Industry Council (OMVIC) has mandated that Ontario dealers perform VIN-based recall lookups. Additionally, new anti-money laundering (AML) regulations now require identity verification for transactions involving large amounts of cash. In response, digital vendors have introduced high-resolution inspection PDFs that provide detailed metrics, such as brake pad thickness and paint meter readings. Organized sellers absorb the inspection fee as part of their acquisition costs, while peer-to-peer sellers often avoid this expense, resulting in reduced traffic. Consequently, transparency has shifted from being a compliance requirement to a key driver of revenue.
Restraints Impact Analysis*
| Restraint | (~) % Impact on CAGR Forecast | Geographic Relevance | Impact Timeline |
|---|---|---|---|
| Limited Late-Model Stock | -0.9% | National, 0-to-5-year supply | Medium term (2-4 years) |
| Dealer and Portal Competition | -0.7% | National, highest in Toronto, Montréal, Vancouver | Short term (≤ 2 years) |
| Odometer and Condition Concerns | -0.4% | National, peer-to-peer channels | Short term (≤ 2 years) |
| Patchwork Digital Transfer Rules | -0.3% | Ontario, Québec, British Columbia, Alberta | Long term (≥ 4 years) |
| Source: Mordor Intelligence | |||
Intensifying Competition from Large Dealer Groups and Classifieds Portals
AutoCanada’s extensive network, HGregoire’s multi-province presence, and Facebook Marketplace's zero-listing-fee model are intensifying competition for independent yards that lack scale advantages. Larger players benefit from financing inventory at lower costs, while classified sites attract price-sensitive buyers who avoid documentation fees, further compressing margins for smaller entities. Mid-tier generalists face a critical decision: specialize in a niche or exit through acquisition. This competitive churn is expected to reduce the number of dealers while concentrating market volume among tech-enabled competitors.
Patch-Work Provincial Rules on Fully-Digital Vehicle Transfers
Ontario’s Ontario Motor Vehicle Industry Council (OMVIC), Québec’s SAAQ, British Columbia’s VSA, and Alberta’s Alberta Motor Vehicle Industry Council (AMVIC) each dictate unique disclosure and titling protocols [3]“Dealer Disclosure Requirements,”, OMVIC, omvic.on.ca. Digital signatures, lien releases, and odometer certifications remain provincial pilots rather than national standards. Financial Transactions and Reports Analysis Centre of Canada's (FINTRAC’s) federal AML overlay adds another layer of compliance. Platforms that master a single province’s rule set scale faster than those chasing all ten jurisdictions, at least until harmonization arrives.
*Our forecasts treat driver/restraint impacts as directional, not additive. The impact forecasts reflect baseline growth, mix effects, and variable interactions.
Segment Analysis
By Vehicle Type: Sport Utility Vehicles Drive Market Evolution
Sport utility vehicles (SUVs) owned 52.61% of the 2025 volume and will widen their lead with a 9.44% CAGR through 2031, propelled by cargo flexibility, perceived safety, and winter traction. This slice translates to the largest single share of the Canadian used car market size and is already running ahead of consumer search interest, signaling a slight oversupply that nonetheless clears quickly. Sedans slide as original equipment manufacturers discontinue mid-size nameplates, while hatchbacks maintain relevance mainly inside dense city cores. Trucks hold an outsized share in Alberta and Saskatchewan, underscoring the need for regional inventory strategies.
Dealers are advised to allocate a significant portion of their lot space to crossovers and body-on-frame sport utility vehicles (SUVs). They should also maintain a supply of sedans within an affordable price range, while limiting hatchback purchases in non-metropolitan areas. Certified Pre-Owned (CPO) programs are increasingly endorsing off-road-capable models. This trend enables sellers to demand higher prices without compromising on sales speed. As a result, the strong sales of sport utility vehicles solidify the segment's status as the primary profit driver across various provinces.


By Vehicle Age: CPO Programs Anchor the 0-to-5-Year Bracket
The 3-to-5-year cohort held a 40.32% share in 2025, the most significant slice of the Canadian used car market share, while the 0-to-2-year band posted an 11.22% CAGR to 2031, driven by expanding original equipment manufacturer Certified Pre-Owned (CPO) networks. Organized dealers leverage warranty transferability and reduced mechanical risks to command significant premiums. While supply gaps continue to curtail immediate volumes, consolidated franchises effectively navigate these challenges, ensuring steady pipelines through returns from captive finance leases.
As scarcity drives up auction prices, independent dealers often overbid or shift focus toward higher-mileage vehicles. This trend underscores the increasing importance of instant trade-in platforms, which streamline the appraisal and pickup processes, making them crucial sources for inventory. Looking ahead, the youngest vehicle categories are expected to yield the highest gross margins, while older segments will play a critical role in stabilizing volumes during periods of economic uncertainty.
By Price Segment: Middle Market Anchors Volume
Units priced USD 10,000-USD 14,999 held 37.58% of 2025 sales, confirming that affordability, not aspiration, governs Canadian demand. Inventory priced up to the USD 30,000 is expected to grow at a 7.14% CAGR, supported by Certified Pre-Owned sedans and sport utility vehicles that offer sizeable savings versus new models while preserving brand cachet. High policy rates continue to elevate monthly payments, limiting the pool of potential buyers.
Inventory strategies emphasize maintaining a significant portion of stock within an affordable price range. Prairie dealers focus on offering options for cost-sensitive households, while metro stores prioritize premium Certified Pre-Owned units and provide transparent payment calculators to engage potential buyers effectively.
By Vendor Type: Organized Dealers Consolidate Share
Organized vendors captured 62.18% of deals in 2025 and are projected to track a 6.89% CAGR through 2031. Consolidators such as AutoCanada exploit centralized inventory and shared marketing to lower the cost per sale. Peer-to-peer sites continue to attract shoppers, but concerns over fraud and the lack of warranties weaken customer loyalty over time. Additionally, compliance with Anti-Money Laundering (AML) regulations benefits larger players who can distribute their legal expenses more effectively.
The competitive landscape now focuses on transparent inspections, AI-driven pricing strategies, and efficient delivery services. Independent stores must either align with branded networks or specialize in niche import models to remain competitive.
By Fuel Type: Petrol Dominates, Electric Accelerates
Petrol maintains a 61.27% share in 2025, yet electric vehicles and hybrids comprise the fastest-growing slice, pacing a 10.2% CAGR. Used Tesla Model 3 units have become an attractive option for cost-driven buyers, offering significant savings compared to new vehicles. Organized listings now include standardized battery-health certificates, providing clarity on state-of-charge retention and easing buyer concerns.
Dealers are encouraged to maintain a balanced petrol stock nationwide, incorporate a mix of electric vehicles and hybrids in regions like British Columbia and Québec, and minimize diesel usage outside of commercial fleets. Establishing certification partnerships for electric vehicle batteries is becoming crucial to attract early-majority shoppers.

By Sales Channel: Pure-Play E-Retailers Disrupt Classifieds
In 2025, online platforms accounted for 55.06% of all transactions. Among these, pure-play e-retailers led the charge, boasting a rapid growth rate of 12.75% CAGR. This growth highlights the increasing consumer preference for convenience and digital-first solutions. Canada Drives has revolutionized the car-buying experience, managing everything from title and financing to delivery, turning what was once a multi-day process into a smooth, half-hour digital transaction. This streamlined approach has set a benchmark for efficiency in the automotive e-commerce space. While offline dealers still cater to buyers wanting test drives, they've adapted by incorporating "reserve online, pick up in store" features to stay competitive. These hybrid models demonstrate the evolving strategies of traditional dealers as they strive to maintain their market share in a rapidly digitizing landscape.
Transport Canada predicts that online sales will play a significant role in auto retail by 2030, driven by a growing consumer preference for the convenience of digital platforms. This shift is expected to significantly reshape the traditional auto retail landscape, creating opportunities for innovation in customer engagement and sales strategies. Meanwhile, compliance costs from FINTRAC are benefiting larger players, steering the market towards a hybrid model that blends digital exploration with local delivery. This model not only enables a seamless customer experience but also ensures adherence to regulatory requirements, positioning capitalized players to leverage their resources effectively in this evolving market.
Geography Analysis
Ontario dominates the market, driven by the Greater Toronto Area’s population density and suburban commuting patterns. Ontario Motor Vehicle Industry Council (OMVIC)’s stringent disclosure regime increases dealer compliance costs but enhances consumer trust, reinforcing the dominance of organized dealers. Québec follows closely, though its French-language contracts and fluctuating ZEV rebates present challenges for national rollout plans. British Columbia also holds a significant share, supported by its mild climate and strong EV infrastructure, which sustains demand for used EVs.
Alberta and Saskatchewan collectively hold a notable share, with full-size pickups accounting for a significant portion of provincial listings, due to the resource sector's preference for utility vehicles. Operating cost differences and tighter dealer real estate markets result in higher average prices in Ontario and British Columbia compared to the Prairie provinces. Manitoba and the Atlantic provinces, with smaller market shares, depend on inter-provincial e-commerce to address inventory shortages.
Digital transfer regulations remain fragmented across provinces. Ontario is piloting electronic lien releases, British Columbia is testing digital odometer certificates, and Québec enforces independent French workflows. Federal AML regulations introduce a nationwide ID verification requirement for high-value cash transactions, creating hurdles for smaller, independent dealers. Platforms that align inventory with provincial preferences—such as SUVs in Ontario, trucks in Alberta, and EVs in British Columbia—while ensuring compliance with local regulations, are better positioned to outperform those adopting a generalized national approach.
The used car market is assessed by Mordor Intelligence through a multi-layered geographic lens, covering other regions such as Africa, along with detailed country-level analysis for Brazil, South Africa, Netherlands, Tanzania, Portugal, Egypt, Ethiopia, and Hong Kong.
Competitive Landscape
The market remains moderately fragmented, with no single player dominating the national market. However, the leading dealer groups collectively account for a significant portion of the organized volume. AutoCanada, with the largest store network, utilizes shared CRM platforms to facilitate cross-province test drives. Similarly, HGregoire and Go Auto adopt this approach, acquiring independent dealers to achieve scale advantages.
Classified portals like AutoTrader and Kijiji Autos generate revenue through subscription fees, avoiding inventory risks, while Canada Drives and Clutch take on balance-sheet exposure to secure comprehensive margins. Technological advancements, such as AI-driven price guidance and integrated inspection PDFs, have become standard. There is potential in consolidated CPO marketplaces that provide curated, cross-OEM certified stock, catering to shoppers who compare brands like Toyota, Honda, and Subaru.
Regulatory compliance introduces additional challenges. Ontario Motor Vehicle Industry Council (OMVIC) penalizes non-compliant dealers, Financial Transactions and Reports Analysis Centre of Canada (FINTRAC) conducts audits for Anti-Money Laundering (AML) compliance, and provincial digital transfer pilots have distinct data format requirements. These compliance costs often pressure smaller dealers to accept acquisition offers, driving further market consolidation.
Canada Used Car Industry Leaders
AutoCanada
Kijiji Autos
Canada Drives
CarGurus
TRADER Corporation
- *Disclaimer: Major Players sorted in no particular order

Recent Industry Developments
- October 2025: In Q3 2025, the Canadian automotive market stabilized, with easing demand and better inventory levels countering previous tariff-induced shifts. The Q3 2025 AutoTrader Price Index reveals that, while average used vehicle prices experienced a slight quarterly dip, they remain 3.2% above last year's figures. Meanwhile, new vehicle prices experienced a 4.9% year-over-year decline, mainly due to increased inventory across various segments.
- April 2025: Honda and Acura have rolled out an "Approved Pre-Owned" program, extending its reach to cars that are up to a decade old. This new initiative mirrors the existing Certified Pre-Owned (CPO) program but with a broader age bracket. Aimed at drawing in "budget-conscious, first-time buyers," the program comes at a time when vehicle affordability is a pressing concern for many Canadians.


Research Methodology Framework and Report Scope
Market Definitions and Key Coverage
According to Mordor Intelligence, we treat the Canada used-car market as the total annual value of passenger cars that have previously been registered to at least one retail owner, including certified pre-owned units resold by franchised or independent dealers, as well as peer-to-peer transactions recorded by provincial agencies.
Scope exclusion: commercial trucks, salvage-only vehicles, and cross-border transactions that never complete Canadian registration are outside this study.
Segmentation Overview
- By Vehicle Type
- Hatchbacks
- Sedans
- Sport Utility Vehicles
- Multi-Purpose Vehicles
- Others (convertibles, coupes, crossovers, sports cars)
- By Vehicle Age
- 0 - 2 Years
- 3 - 5 Years
- 6 - 8 Years
- 9 - 12 Years
- Above 12 Years
- By Price Segment
- Under USD 5,000
- USD 5,000 - 9,999
- USD 10,000 - 14,999
- USD 15,000 - 19,999
- USD 20,000 - 29,999
- USD 30,000 and Above
- By Vendor Type
- Organized
- Unorganized
- By Fuel Type
- Petrol
- Diesel
- Hybrid
- Electric
- LPG / CNG / Others
- By Sales Channel
- Online
- Digital Classified Portals
- Pure-play e-Retailers
- OEM-Certified Stores
- Offline
- OEM-Franchised Dealers
- Multi-brand Independent Dealers
- Physical Auction Houses
- Online
Detailed Research Methodology and Data Validation
Primary Research
We held structured interviews and short surveys with franchised and independent dealers, large online platforms, provincial registrar offices, financing intermediaries, and remarketing experts across all major provinces. Insights on stock-turn days, certified pre-owned uptake, and emerging EV trade-ins helped us validate desk estimates and close data gaps.
Desk Research
Our analysts started with public datasets such as Statistics Canada vehicle registrations, Transport Canada import logs, and provincial regulator disclosures (e.g., OMVIC and AMVIC) before layering trade-association briefs from the Canadian Automobile Dealers Association and Consumer Bankers Association. Company filings, investor decks, and reputable media archives retrieved through Dow Jones Factiva and D&B Hoovers added pricing, margin, and channel context.
Macro touchpoints, household disposable income, new-car price index, and exchange rates were pulled from the Bank of Canada, while patent and auction trends were cross-checked on Questel and Volza. These sources are illustrative, not exhaustive, of the secondary material reviewed.
Market-Sizing & Forecasting
A top-down construct begins with provincial ownership stock and annual turnover rates, then converts units to dollars via sampled average selling prices that reflect vehicle age and fuel mix. Select bottom-up checks, dealer roll-ups and channel spot audits, test the totals before alignment. Key variables include provincial turnover ratios, average used-car price index, certified pre-owned penetration, online share of sales, household disposable income, and new-to-used price differentials. Forecasts rely on a multivariate regression model blended with scenario analysis, so macro shifts in GDP, credit cost, and EV adoption adjust volumes and prices transparently.
Data Validation & Update Cycle
Mordor analysts rerun anomaly checks, variance tests, and peer reviews at each modelling stage. Results are compared with external registration flashes and dealer revenue trends; outliers trigger re-contact of sources. The report is refreshed annually, with mid-cycle revisions when material events, such as regulation and economic shocks, occur.
Why Mordor's Canada Used Car Baseline Inspires Confidence
Published estimates often diverge because firms choose different scopes, price assumptions, and refresh cadences. We acknowledge these gaps upfront so decision-makers understand the landscape.
Key gap drivers include whether commercial vans or salvage imports are counted, how average selling prices are sampled across provinces, and whether analysts roll forward historical ratios without validating fresh dealer data, which is where Mordor's disciplined annual primary outreach makes a difference.
Benchmark comparison
| Market Size | Anonymized source | Primary gap driver |
|---|---|---|
| USD 17.71 B (2025) | Mordor Intelligence | |
| USD 24.60 B (2024) | Regional Consultancy A | Includes unsold imports and higher assumed ASPs without province-level adjustments |
| USD 18.00 B (2024) | Trade Journal B | Dealer survey covers mainly Ontario and applies uniform pricing nationwide |
These comparisons show that when scope, price sampling, and geographic granularity are harmonized, Mordor's balanced, transparent baseline remains the most dependable starting point for strategic planning.


Key Questions Answered in the Report
How large is the Canada used car market in 2026?
The Canada used car market size stood at USD 18.90 billion in 2026 and is forecast to grow at a 6.74% CAGR through 2031.
Which segment of used vehicles sells fastest in Canada?
SUVs move quickest, holding 52.61% share in 2025 and benefiting from a 9.44% CAGR that reflects enduring demand for cargo utility and all-weather capability.
Why are late-model used cars in short supply?
Pandemic-era production shortages and longer ownership cycles have constrained the flow of 0–5-year-old vehicles into the used market, tightening inventory and supporting higher prices.
What is driving online growth in Canadian used-vehicle sales?
A rise in AI-enabled search tools, digital titling pilots, and consumer appetite for click-to-door delivery propels pure-play e-retailers at a 12.75% CAGR.
How will provincial EV incentives affect used-EV demand?
Incentive volatility creates quarter-to-quarter swings, but long-term phase-out mandates mean time-bound rebates will periodically reignite demand, especially in Québec and British Columbia.
Page last updated on:


