High-Purity Alumina (HPA) Market Size and Share
Market Overview
| Study Period | 2021 - 2031 |
|---|---|
| Market Volume (2026) | 187.69 kilotons |
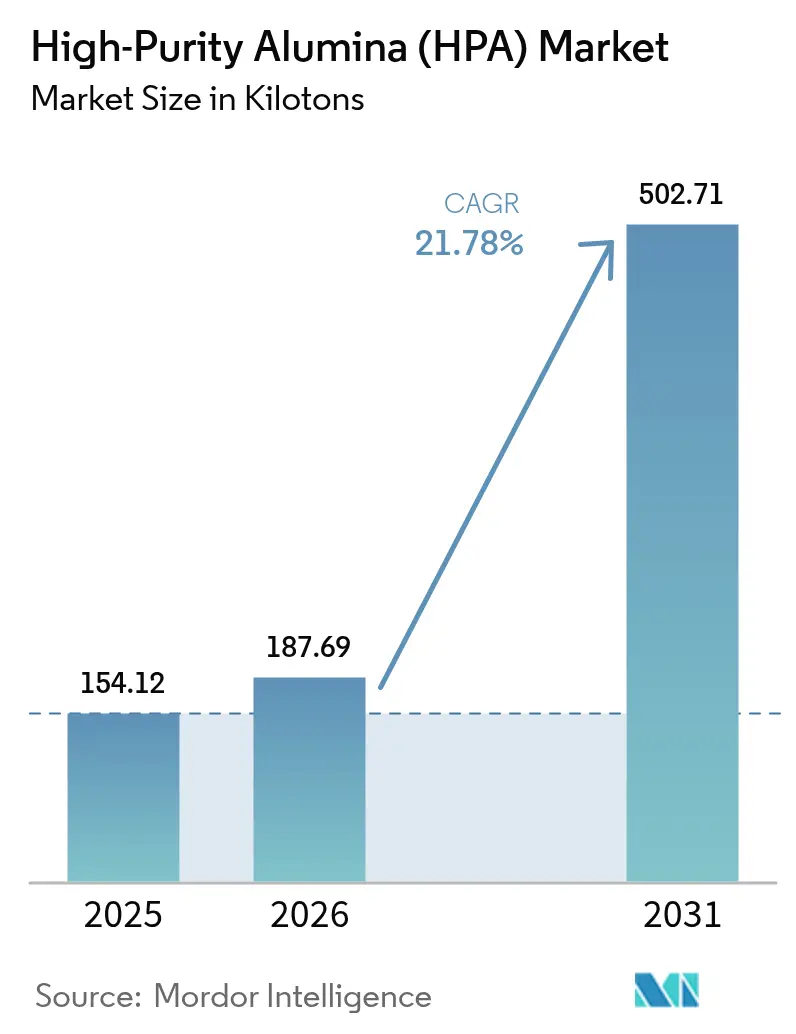
| Market Volume (2031) | 502.71 kilotons |
| Growth Rate (2026 - 2031) | 21.78% CAGR |
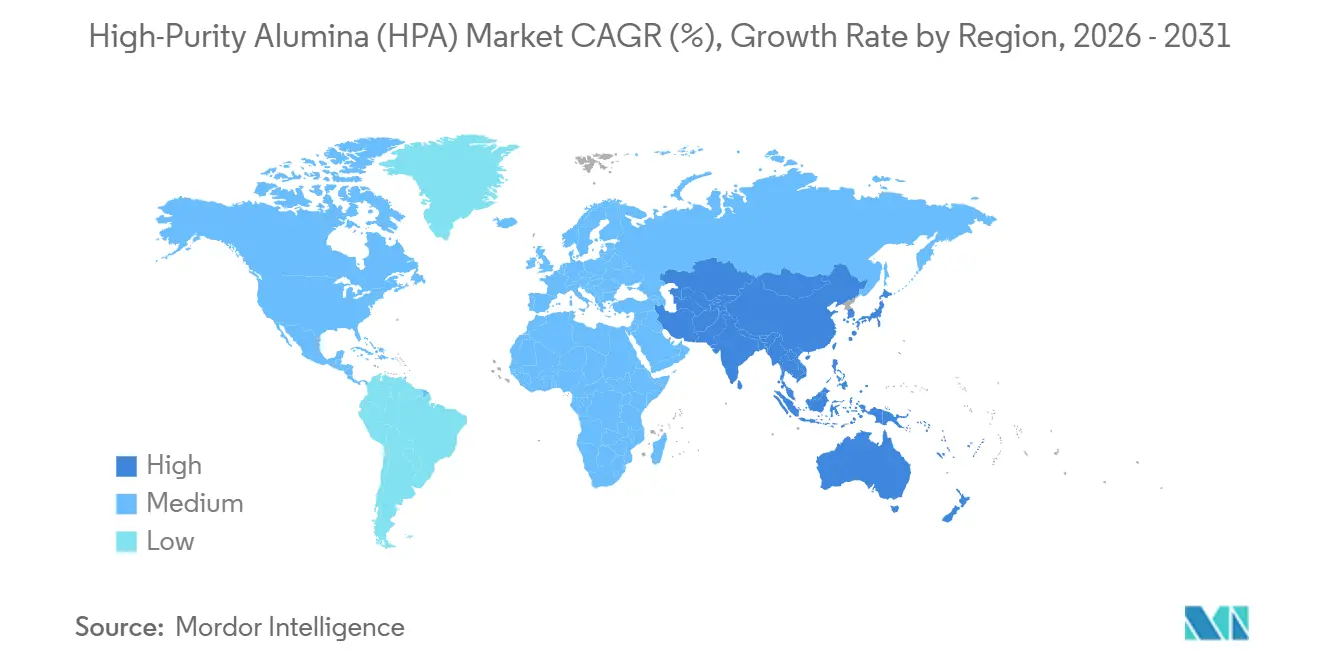
| Fastest Growing Market | Asia Pacific |
| Largest Market | Asia Pacific |
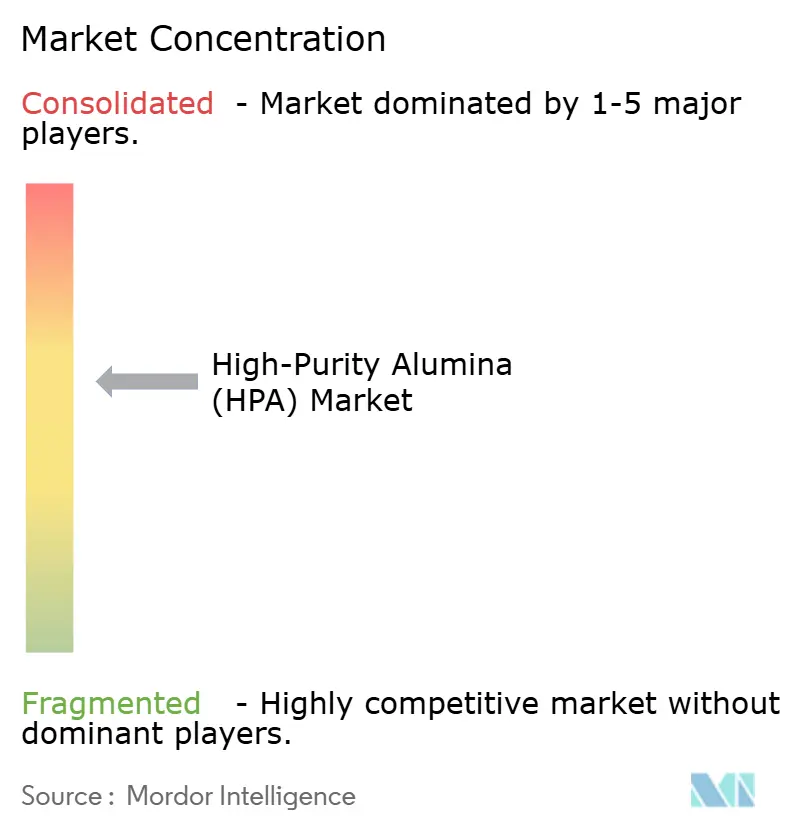
| Market Concentration | Medium |
Major Players *Disclaimer: Major Players sorted in no particular order Image © Mordor Intelligence. Reuse requires attribution under CC BY 4.0. | |
High-Purity Alumina (HPA) Market Analysis by Mordor Intelligence
The High-Purity Alumina Market size was valued at 154.12 kilotons in 2025 and is estimated to grow from 187.69 kilotons in 2026 to reach 502.71 kilotons by 2031, at a CAGR of 21.78% during the forecast period (2026-2031). Robust momentum arises as legacy LED-substrate volumes converge with battery-separator coatings, semiconductor-grade feedstocks, and emerging thermal-interface materials, each demanding impurity thresholds that commodity alumina cannot meet. National critical-minerals incentives in the United States, the European Union, and Australia are redirecting capital toward on-shore plants, fragmenting a supply base once concentrated in the Asia-Pacific. Simultaneously, spherical alumina morphologies optimized for electric-vehicle heat spreaders are opening white-space opportunities for spray-pyrolysis and sol-gel specialists. Against this backdrop, the high-purity alumina market is set to remain in structural undersupply until mid-decade, supporting premium pricing for grades above 5N purity.
Key Report Takeaways
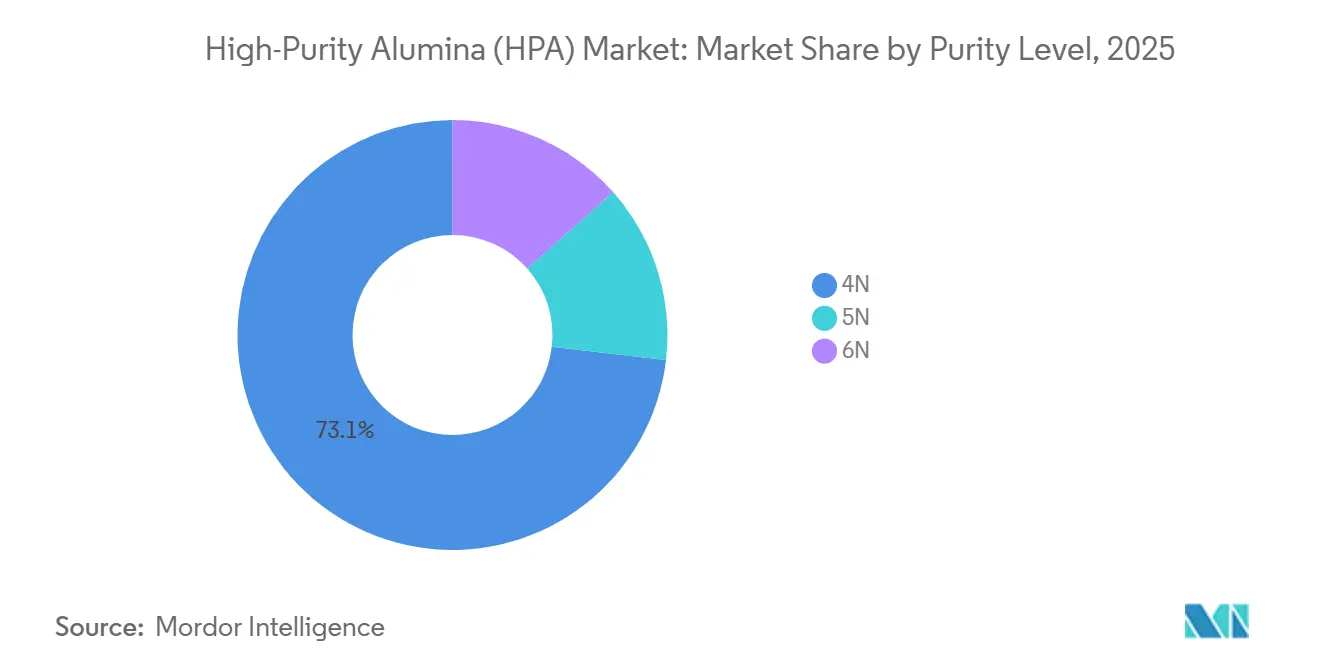
- By purity level, the 4N grade led with a 73.15% High-Purity Alumina market share in 2025, while the 6N grade is projected to expand at a 22.31% CAGR to 2031.
- By production technology, hydrolysis commanded 87.33% of the High-Purity Alumina market size in 2025; hydrochloric-acid leaching is set to grow at a 22.42% CAGR during 2026-2031.
- By application, LED lighting accounted for 54.61% of the High-Purity Alumina market size in 2025, whereas lithium-ion batteries are forecast to surge at a 57.65% CAGR through 2031.
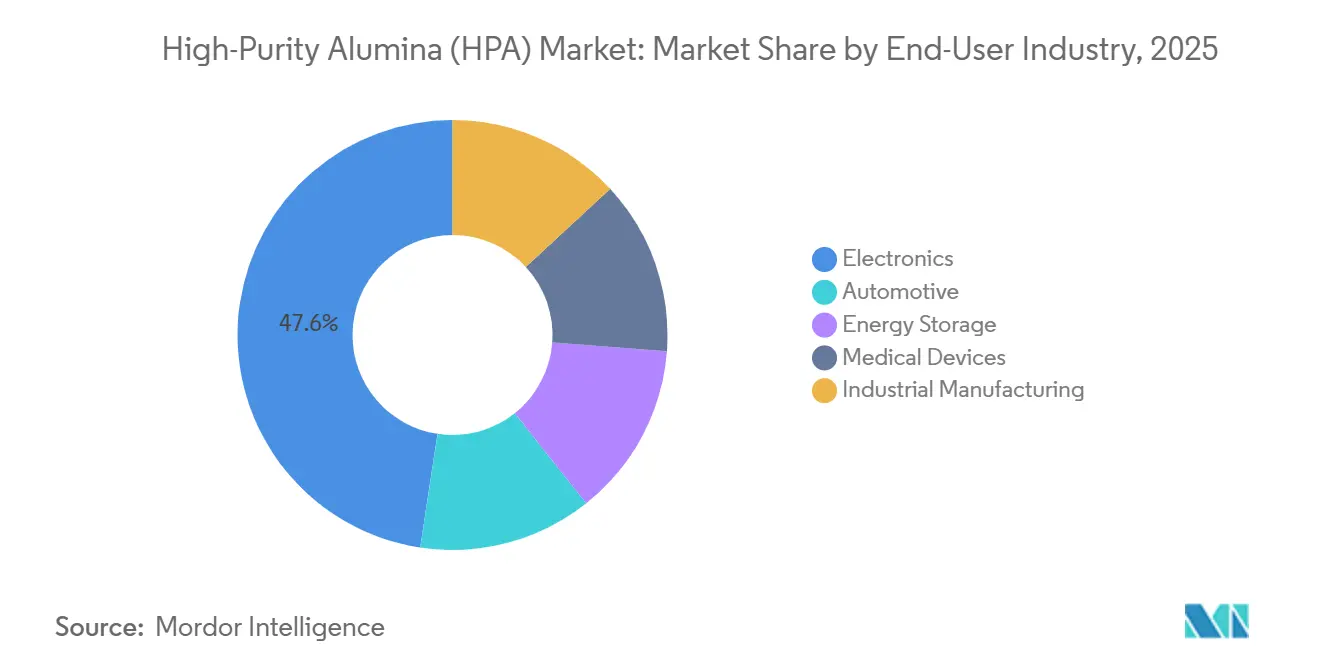
- By end-user industry, the electronics sector held 47.59% of the High-Purity Alumina market share in 2025 and will expand at a 23.16% CAGR to 2031.
- By geography, Asia-Pacific dominated with a 75.68% share of the High-Purity Alumina market in 2025 and is advancing at a 22.95% CAGR to 2031.
Note: Market size and forecast figures in this report are generated using Mordor Intelligence’s proprietary estimation framework, updated with the latest available data and insights as of 2026.
Global High-Purity Alumina (HPA) Market Trends and Insights
Drivers Impact Analysis*
| Drivers | (~) % Impact on CAGR Forecast | Geographic Relevance | Impact Timeline |
|---|---|---|---|
| LED-lighting demand boom | +5.2% | Global, with concentration in Asia-Pacific (China, South Korea, Taiwan) and spill-over to North America | Medium term (2-4 years) |
| EV lithium-ion battery separator uptake | +6.8% | APAC core (China, Japan, South Korea), expanding to North America and EU battery corridors | Long term (≥ 4 years) |
| Semiconductor purity thresholds tightening | +3.1% | Global, led by advanced-node fabs in Taiwan, South Korea, and emerging US facilities under CHIPS Act | Medium term (2-4 years) |
| Spherical HPA use in EV thermal-interface materials | +2.4% | North America and EU automotive clusters, with early adoption in premium EV segments | Long term (≥ 4 years) |
| National critical-minerals incentives for on-shore HPA | +3.7% | North America (US IRA provisions), EU (CRM Act), Australia (Modern Manufacturing Initiative) | Short term (≤ 2 years) |
| Source: Mordor Intelligence | |||
LED-Lighting Demand Boom
Sapphire substrates consumed a significant amount of global HPA tonnage in 2025, yet next-generation micro-LED displays and automotive adaptive headlights now require 5N purity, pushing suppliers beyond conventional 4N specifications[1]Nippon Light Metal, “Sapphire Substrate Operations,” nlm.co.jp. Japanese producers meet these tightening limits through multi-stage recrystallization, while Chinese LED-packagers vertically integrate to lock in feedstock and compress spot liquidity. South Korean display majors are investing in captive HPA lines to de-risk micro-LED roll-outs targeted for 2027 mass production. The migration to higher grades intensifies demand for the high-purity alumina market even as traditional general-illumination LEDs mature. Emerging micro-LED backplanes therefore reinforce structural tightness for 5N and 6N material despite plateauing lamp sales.
EV Lithium-Ion Battery Separator Uptake
In a move to counter thermal runaway in high-nickel cathodes, Korean and Japanese cell manufacturers have adopted ceramic-coated separators made from high-purity alumina[2]LG Energy Solution, “Battery Separator Specifications,” lgensol.com. These separators are emerging as a pivotal growth driver in the high-purity alumina market. Premiums over LED-grade prices highlight the stringent standards on surface area, agglomeration, and transition metals. A collaborative effort between Sumitomo Chemical and local battery firms signals a transition from traditional commodity sales to specialized, application-engineered slurries. With the U.S. and Europe emphasizing localized supply chains through the Inflation Reduction Act and Critical Raw Materials Act, regional HPA plants are reaping competitive benefits.
Semiconductor Purity Thresholds Tightening
SEMI PV17 standards limit metallic impurities in chemical-mechanical planarization slurries, propelling the adoption of 6N purity in advanced fabs. While the U.S. CHIPS and Science Act hastens the construction of new fabs, the domestic capacity for high-purity alumina (HPA) remains in its infancy. This creates a supply-security gap that the HPA market is now tasked with addressing. Achieving 6N purity necessitates ion-exchange or zone-refining processes, which effectively double the production costs compared to 4N purity. This financial hurdle has led to a consolidation, with fewer suppliers dominating the global landscape. Vendors that can demonstrate lot-level traceability have gained a competitive edge, securing multi-year contracts with industry giants, thereby bolstering their pricing leverage. As logic nodes advance beyond the 2 nm threshold, the heightened sensitivity of wafer-level yields underscores a persistent demand for ultra-pure grades in the high-purity alumina market.
Spherical HPA Use in EV Thermal-Interface Materials
Gap-fillers in EV battery packs require higher bulk thermal conductivity and lower viscosity compared to those based on angular fillers. Sasol's spheroidization process enables the creation of compounds with improved thermal conductivity at a high loading. This outperforms conventional alumina. While automotive qualification cycles may delay revenue recognition, they also embed switching costs, providing an advantage to early suppliers. Startups utilizing spray-pyrolysis find a more accessible entry into the high-purity alumina market. This is because the market values spherical morphology, not just purity. As trends lean towards rapid charging, the demand for aggressive heat dissipation is set to expand this niche in the long run.
Restraints Impact Analysis*
| Restraints | (~) % Impact on CAGR Forecast | Geographic Relevance | Impact Timeline |
|---|---|---|---|
| High production cost of 4N-6N grades | -2.9% | Global, with acute pressure in EU and North America due to energy costs | Short term (≤ 2 years) |
| Limited high-grade alumina feedstock worldwide | -1.8% | Global, with bottlenecks in Australia (high-grade bauxite) and China (Bayer-process capacity) | Medium term (2-4 years) |
| Decarbonisation rules raise energy-intensive purification costs | -1.5% | EU (Carbon Border Adjustment Mechanism), California (Cap-and-Trade), potential federal US carbon pricing | Long term (≥ 4 years) |
| Source: Mordor Intelligence | |||
High Production Cost of 4N-6N Grades
To achieve 6N purity, producers must undergo multiple cycles of acid leaching, solvent extraction, and calcination at high temperatures. This process significantly increases cash costs compared to 4N material. Notably, electricity accounts for a substantial portion of these variable costs. This heavy reliance on energy exposes European producers to power rates that are significantly higher than those in Xinjiang province, China. Alpha HPA has introduced a hydrochloric-acid route that boasts potential energy savings, but its commercial viability remains to be confirmed in 2026. Until then, these cost pressures are limiting the adoption of ultra-pure grades, subsequently slowing the overall growth of the high-purity alumina market.
Limited High-Grade Alumina Feedstock Worldwide
A small percentage of the world's bauxite reserves meet the crucial alumina-to-silica ratio, essential for efficient Bayer refining. With Australia's Darling Range and Guinea's Boké leading the supply, HPA plants find themselves locked into long-term offtake commitments, curtailing their flexibility. While specialty alumina with low sodium levels is available, it is fully booked. This situation nudges new market entrants towards Chinese sources, fraught with export-license uncertainties. Meanwhile, alternative routes like kaolin or dross are still in the developmental phase, exacerbating the raw-material scarcity in the high-purity alumina market.
*Our forecasts treat driver/restraint impacts as directional, not additive. The impact forecasts reflect baseline growth, mix effects, and variable interactions.
Segment Analysis
By Purity Level: 6N Gains as Semiconductor Fabs Tighten Specs
4N alumina retained 73.15% volume share in 2025, buoyed by demand for cost-sensitive LED phosphors and traditional sapphire substrates. Meanwhile, 6N demand is expanding at a 22.31% CAGR to 2031, driven by the need for metallic impurities under 0.1 ppm in process nodes below 3 nm to ensure wafer yield. By 2031, the market size for 6N high-purity alumina is set to grow substantially. Producers from Japan and France, utilizing their ion-exchange expertise, maintain strong margins. In contrast, while new capacities in China aim at domestic fabs, they grapple with consistency issues. This competitive landscape favors suppliers who can demonstrate statistical process control over multi-ton lots.
Capital expenditure barriers loom large, as elevating purity from 4N to 6N necessitates a twofold increase in equipment investment for solvent extraction and zone refining. However, enticing price differentials, especially with government subsidies mitigating capital costs, spur many to make the leap. Some mid-tier players are experimenting with hybrid flowsheets, merging acid leaching and hydrolysis polishing to balance cost and purity, albeit with heightened commissioning risks. Looking ahead, while 4N prices might dip due to LED market stagnation, 6N premiums are expected to remain robust, amplifying the profitability divide in the high-purity alumina arena.


By Production Technology: Acid Leaching Challenges Hydrolysis Dominance
Hydrolysis captured 87.33% of 2025 output thanks to decades-old aluminum-alkoxide know-how that can hit 6N in one pass. Even so, hydrochloric-acid leaching is rising at 22.42% as developers tap kaolin and aluminum scrap, trimming raw-material costs. If all goes as planned with the announced projects, the market size for high-purity alumina, tied to acid leaching, could grow substantially by 2031. While hydrolysis veterans emphasize their streamlined flowsheets and quicker qualification cycles, newcomers in acid leaching highlight their by-product HCl sales, boosting project netbacks.
Technology choices hinge on geographical advantages: with kaolin-rich regions like Georgia (U.S.) and Jiangxi (China) leading in acid-leach pilots, Japan remains steadfast with its hydrolysis infrastructure. A novel hybrid approach is gaining traction, where leaching produces a 4N feed, which is then refined through hydrolysis to achieve 5N+ purity, balancing cost-effectiveness with high purity. Moreover, integrating these processes into chlor-alkali plants not only streamlines operations but also bolsters profitability through acid regeneration. Such evolving dynamics are reshaping the competitive landscape, nudging established players to consider licensing or joint ventures to maintain their foothold in the high-purity alumina arena.
By Application: Battery Separators Surge While LED Matures
LED lighting still dominated 54.61% of the 2025 demand. However, with penetration rates rising in developed lighting markets, it's evident that the sector is reaching maturity. On the other hand, lithium-ion battery separators are witnessing a 57.65% CAGR. This surge is propelling their share of the high-purity alumina market from single digits in 2025 to an anticipated mid-teens percentage by 2031. The margin potential is significant, as separator-grade alumina fetches a price premium, a reflection of its stringent particle size and surface chemistry requirements. Additionally, the semiconductor sector, utilizing everything from CMP slurries to gallium-nitride substrates, is consistently boosting tonnage, driven by the burgeoning demand from data centers and power devices.
As quantum-dot and OLED panels ascend, display phosphors are receding, marking a decline for this once-dominant player. Technical ceramics, however, hold their ground with a stable market share. Their resilience is largely attributed to medical implants and industrial components that prioritize alumina's biocompatibility. While niche applications in scratch-resistant glass yield high margins, they contribute only a fraction of the overall tonnage. This intricate landscape compels producers to deftly manage their grade inventories, ensuring they cater to the varied specifications of customers in the high-purity alumina market.
By End-User Industry: Electronics Dominates, Automotive Accelerates
Electronics absorbed 47.59% of 2025 shipments, covering LEDs, wafers, and consumer devices, and continues to climb at a 23.16% CAGR toward 2031. Automotive will swell fastest as EV adoption widens. Ceramically coated separators and thermal-interface fillers together lift alumina content per vehicle, enhancing the high-purity alumina market opportunity. Grid-scale energy storage forms a distinct pool where fire-safety rules drive ceramic separator uptake in stationary batteries.
Medical devices and industrial manufacturing account for modest but high-margin slices, leveraging alumina’s wear resistance in implants and precision abrasives. End-use segmentation thus bifurcates: scale-driven electronics and automotive versus specialty medical and industrial applications. Suppliers must therefore straddle bulk volumes and tailored formulations, complicating production planning across the high-purity alumina market.
Geography Analysis
Asia-Pacific delivered 75.68% of the 2025 volume and grew at 22.95% through 2031, solidifying its central role in the high-purity alumina market. In China, the Shandong and Hebei clusters have integrated bauxite, alumina, and sapphire production, ensuring a steady supply for domestic LED and semiconductor industries, albeit at the cost of export consistency. Japan's Nippon Light Metal and Sumitomo Chemical, adhering to stringent quality protocols, maintain their leadership in 5N and 6N grades, catering to global fabs that demand statistical traceability. Meanwhile, South Korea is capitalizing on its battery OEMs to co-invest in domestic capacity, a move spurred by IRA rules pushing for North American localization of downstream cells.
Australia is transitioning from being a raw bauxite exporter to a high-purity alumina (HPA) producer, bolstered by its abundant renewable resources and government grants. Alpha HPA's Gladstone refinery aims for a nameplate capacity by Q4 2026, marking a significant stride for Australia in the high-purity alumina market. Concurrently, feasibility studies are exploring the potential of Western Australian kaolin, combined with solar-powered acid regeneration, highlighting Australia's edge in a low-carbon supply chain.
North America, while facing constraints in supply, is making strides in reducing carbon intensity and qualifying for the IRA's Section 45X credit. Proposed plants on the U.S. Gulf Coast are deliberating between utilizing inexpensive gas-fired power and the implications of potential carbon pricing. Europe sees its concentration in Germany and France, but faces challenges with industrial tariffs, making economics unviable without subsidies. While Saudi Arabia and South America are still in exploratory phases, Saudi Arabia's Vision 2030, with its focus on downstream diversification, hints at potential new entrants in the latter part of the forecast period.

Competitive Landscape
The high-purity alumina market is moderately consolidated. Technology patents cluster around purification and particle engineering. Sasol’s flame spheroidization underwrites a defensible position in thermal-interface fillers, while Baikowski protects sol-gel synthesis for aerospace ceramics. Policy shifts compound competitive stakes: SEMI standards formalize impurity limits that favor incumbent quality systems, and IRA domestic-content rules channel North American buyers toward regional suppliers. Recycling startups exploring aluminum dross extraction offer cost-advantaged feed but still chase sub-ppm control. Smaller hydrolysis producers may seek joint ventures or licensing to remain relevant. Over the medium term, battery-grade specialization and semiconductor traceability are expected to dictate share shifts more than absolute nameplate tonnage, sharpening focus on process stability and customer co-development within the high-purity alumina market.
High-Purity Alumina (HPA) Industry Leaders
Hebei Pengda New Materials Technology Co., Ltd.
Sumitomo Chemical Co., Ltd.
Baikowski SA
Nippon Light Metal Company, Ltd.
Sasol
- *Disclaimer: Major Players sorted in no particular order

Recent Industry Developments
- January 2026: Alpha HPA, a high-purity alumina producer, launched a USD 225 million institutional placement. Of the USD 210 million raised, most funds are allocated for HPA First Project Stage 2 construction and commercialisation, with USD 5 million for Stage 1 capacity upgrades. The Stage 2 facility in Gladstone is expected to be completed by late 2027 or early 2028.
- May 2024: Alpha HPA announced its plan of setting up a high-purity alumina refinery, targeting an annual output of 10,000 tons of premium aluminum products.


Research Methodology Framework and Report Scope
Market Definitions and Key Coverage
High-purity alumina (HPA) in this study means aluminum oxide with at least 99.99 % purity that is manufactured through hydrolysis or acid-leaching and sold as powder, pellets, or blocks for use in LED phosphors, lithium-ion battery separators, technical ceramics, and advanced electronic substrates. We record only freshly produced HPA that leaves the plant gate; recycled material or grades below the 4N threshold stay outside our boundary as defined by Mordor analysts.
Scope Exclusion: Low-purity smelter-grade alumina, downstream sapphire wafers, and formulated phosphor blends are excluded to keep focus on the intermediate itself.
Segmentation Overview
- By Purity Level (Type)
- 4N
- 5N
- 6N
- By Production Technology
- Hydrolysis
- Hydrochloric Acid Leaching
- By Application
- LED Lighting
- Phosphor
- Semiconductor
- Lithium-ion Batteries
- Technical Ceramics
- Others (Scratch-Resistant Glass, Optical Lenses, etc.)
- By End-User Industry
- Electronics
- Automotive
- Energy Storage
- Medical Devices
- Industrial Manufacturing
- By Geography
- Asia-Pacific
- China
- India
- Japan
- South Korea
- Malaysia
- Thailand
- Indonesia
- Vietnam
- Rest of Asia-Pacific
- North America
- United States
- Canada
- Mexico
- Europe
- Germany
- United Kingdom
- France
- Italy
- Spain
- Nordic Countries
- Turkey
- Russia
- Rest of Europe
- South America
- Brazil
- Argentina
- Colombia
- Rest of South America
- Middle-East and Africa
- Saudi Arabia
- Qatar
- United Arab Emirates
- Nigeria
- Egypt
- South Africa
- Rest of Middle-East and Africa
- Asia-Pacific
Detailed Research Methodology and Data Validation
Primary Research
Structured interviews and questionnaires with HPA producers, LED makers, Li-ion separator coaters, regional traders, and equipment suppliers across Asia-Pacific, North America, and Europe help us verify purity splits, yield losses, and average selling prices, closing gaps left by public data and sharpening our scenario assumptions.
Desk Research
Our team starts with customs manifests, UN Comtrade, and national statistics to map cross-border HPA flows, then aligns these with output disclosures from bodies such as the Japan Aluminium Association and the European Aluminium Council. Company 10-Ks, investor decks, and patent families pulled via Questel reveal capacity ramps and process yields, while price trails are traced through Dow Jones Factiva, Asian Metal quotes, and quarterly filings. Peer-reviewed journals on separator coatings and LED substrates supply conversion factors that ground the model. The sources named are illustrative; many additional materials underpin data collection, validation, and clarification.
Market-Sizing & Forecasting
We build a top-down demand pool by reconciling declared output, net trade, and stated capacity utilization, which are then benchmarked against LED, battery, and semiconductor penetration rates. Select bottom-up roll-ups of producer shipments and sampled ASP-times-volume checks act as guardrails. Key drivers include LED lamp shipments, EV battery cell output, wafer starts, coating thickness per separator, HPA recovery rates, and quarterly price indices. An ARIMA model, complemented by scenario analysis for battery adoption, projects these inputs forward; missing datapoints are conservatively interpolated around observable capacity ramps.
Data Validation & Update Cycle
Outputs pass multi-layer variance checks, peer reviews, and consistency screens against independent trade statistics. We refresh models each year and release interim updates whenever material events such as plant closures, major policy shifts, or battery-chemistry pivots surface.
Why Mordor's High Purity Alumina Baseline Earns Trust
Published estimates often diverge because firms switch units, bundle adjacent products, or rely on unvetted price curves. Our disciplined scope and dual-track modeling give decision-makers a repeatable baseline where every variable is transparent.
Key gap drivers include revenue versus volume reporting, inclusion of sapphire wafer revenues, differing purity thresholds, and irregular refresh cycles.
Benchmark comparison
| Market Size | Anonymized source | Primary gap driver |
|---|---|---|
| 126.03 kt (2025) | Mordor Intelligence | |
| USD 4.63 bn (2024) | Global Consultancy A | Bundles HPA with downstream sapphire substrates and applies uniform global ASPs |
| USD 2.93 bn (2024) | Industry Journal B | Aggregates 99.5 %-99.9 % alumina grades and uses spot prices without contract adjustments |
| USD 5.62 bn (2025) | Regional Research House C | Combines HPA with alumina-based ceramics and models demand from installed LED stock rather than annual shipments |
The comparison shows that, once disparate product boundaries, units, and pricing logic are stripped away, Mordor's volume-first approach validated through primary engagement offers the most dependable starting point for investment, procurement, and policy planning.


Key Questions Answered in the Report
What is the forecast volume for the high-purity alumina market in 2031?
It is projected to reach 502.71 kilotons by 2031, expanding at a 21.78% CAGR from 187.69 kilotons in 2026.
Which region currently leads high-purity alumina demand?
Asia-Pacific commanded 75.68% of the 2025 volume and continues to dominate through the forecast period.
Why are battery separators driving new alumina demand?
Ceramic-coated separators require 99.99% purity alumina to mitigate thermal runaway, a need that fuels a 57.65% CAGR for this application.
What factors limit rapid capacity expansion in North America and Europe?
High energy costs, lengthy permitting, and constrained access to high-grade feedstock slow project timelines despite supportive incentives.
Page last updated on:


