HD Map For Autonomous Vehicles Market Size and Share
Market Overview
| Study Period | 2019 - 2030 |
|---|---|
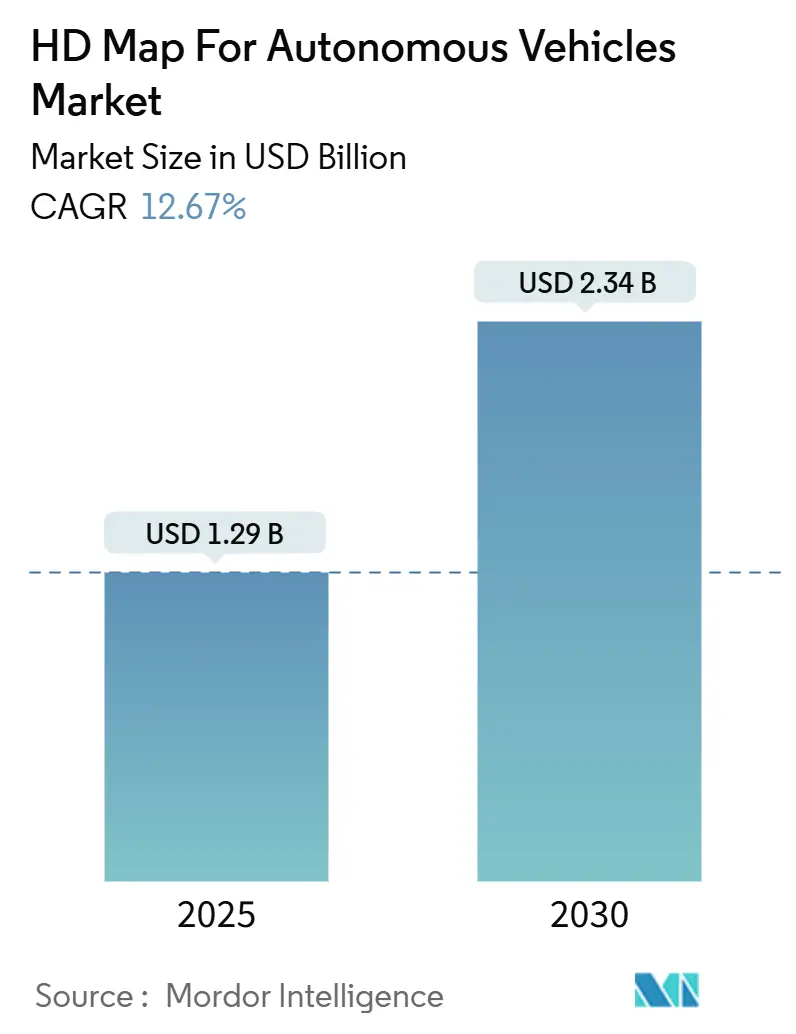
| Market Size (2025) | USD 1.29 Billion |
| Market Size (2030) | USD 2.34 Billion |
| Growth Rate (2025 - 2030) | 12.67% CAGR |
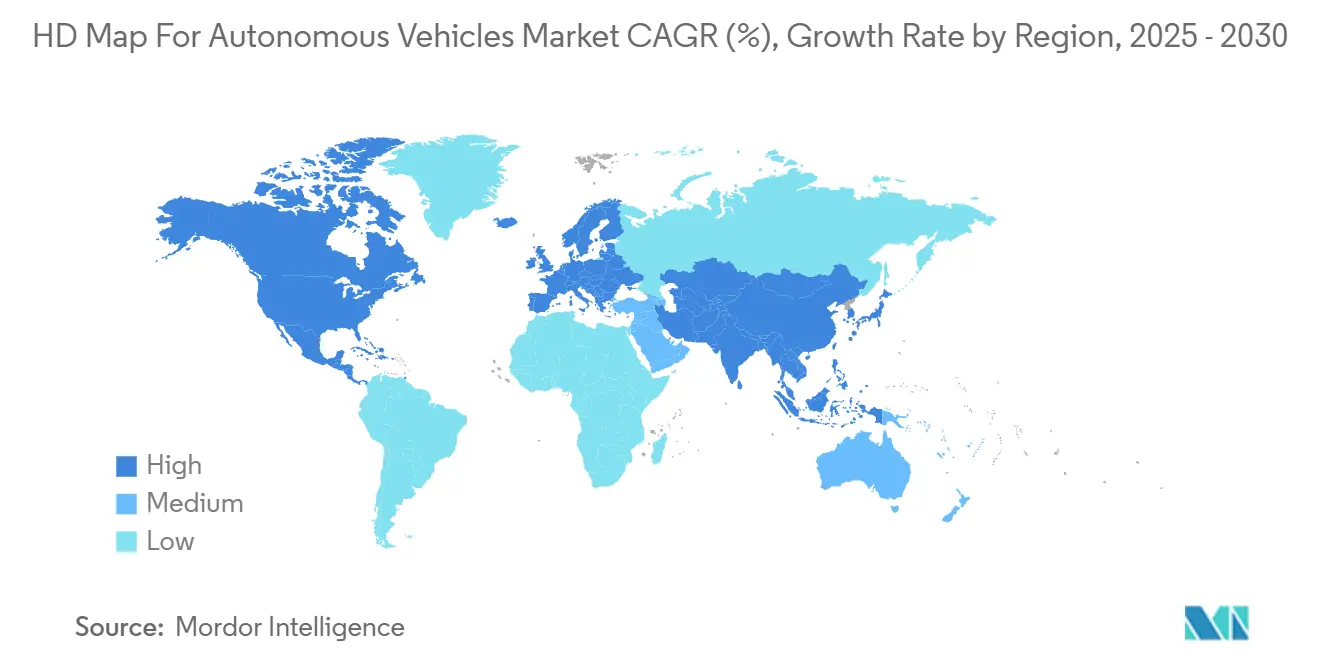
| Fastest Growing Market | Asia Pacific |
| Largest Market | North America |
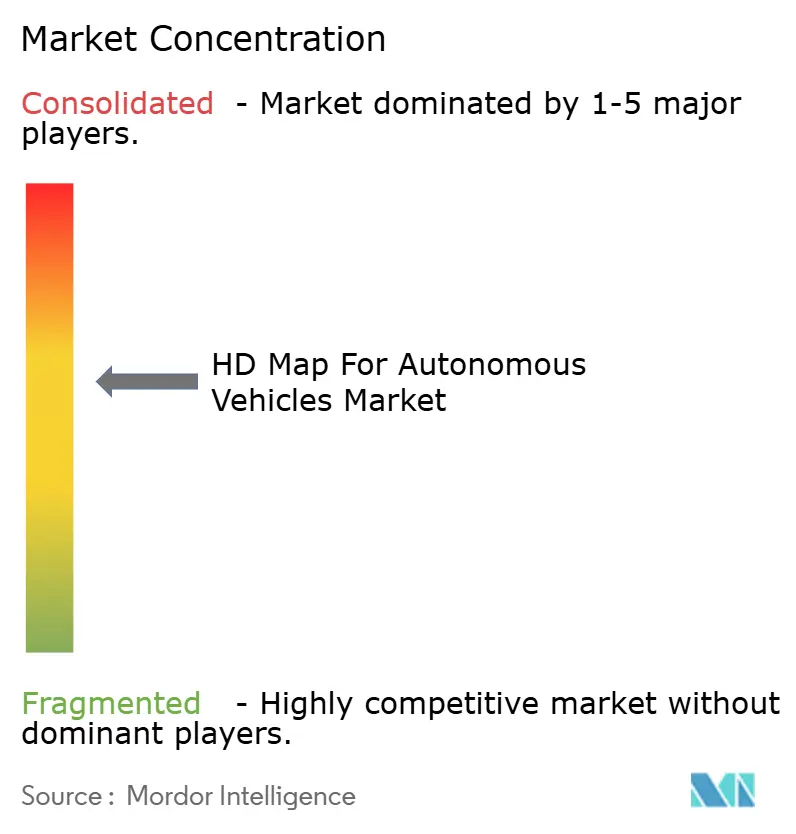
| Market Concentration | Medium |
Major Players *Disclaimer: Major Players sorted in no particular order Image © Mordor Intelligence. Reuse requires attribution under CC BY 4.0. | |
HD Map For Autonomous Vehicles Market Analysis by Mordor Intelligence
The HD map for autonomous vehicles market size stands at USD 1.29 billion in 2025 and is forecast to reach USD 2.34 billion by 2030 at a 12.67% CAGR. Robust demand stems from the accelerating rollout of Level 2+ driver-assistance packages, regular over-the-air (OTA) map refresh cycles, and falling LiDAR prices. Partnerships between automakers and cloud-native mapping companies shorten development cycles and lower per-kilometer mapping costs, while Europe’s 2026 Intelligent Speed Assistance (ISA) regulation pulls forward HD-map adoption timelines. Cloud deployment models dominate because centralized processing improves map freshness and reduces vehicle hardware complexity; at the same time, sensor-fusion techniques balance precision with cost, broadening use cases in mass-market segments. Competitive intensity is moderate and favors vendors that combine mapping expertise with hyperscale cloud infrastructure, enabling real-time updates and global distribution at scale.
Key Report Takeaways
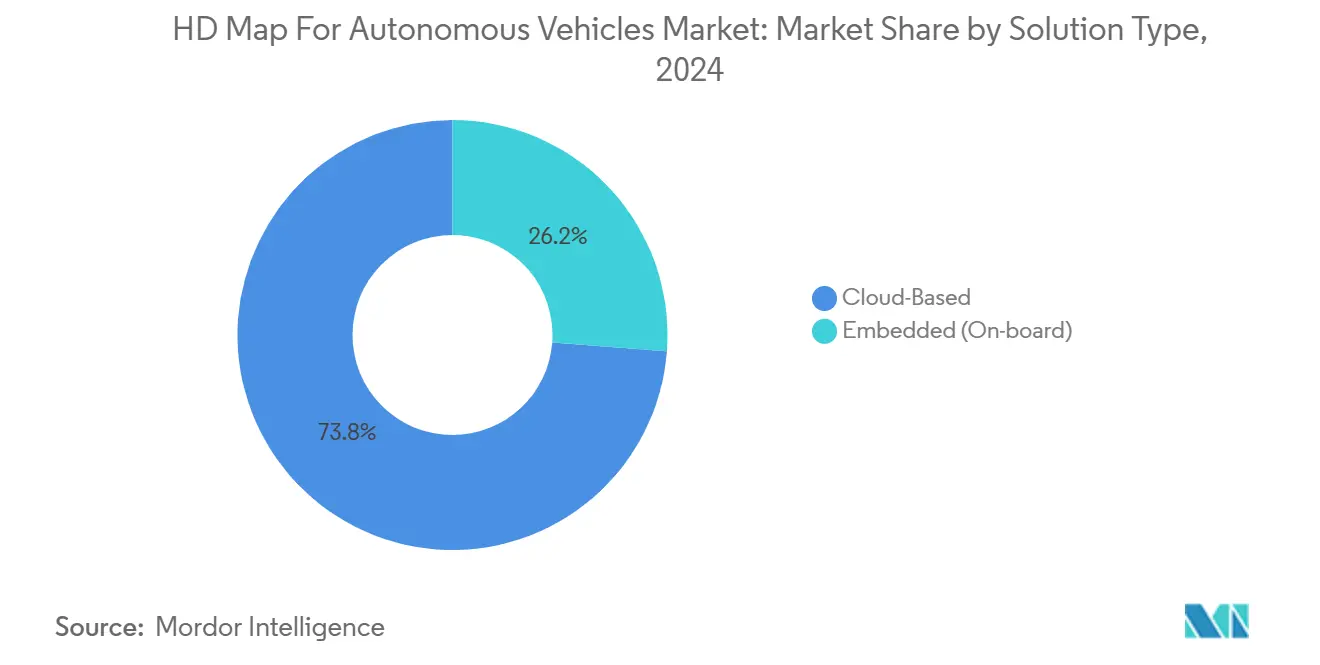
- By solution type, cloud-based platforms captured 73.79% of the HD map for autonomous vehicles market share in 2024, and are projected to post the fastest 14.26% CAGR through 2030.
- By technology, LiDAR-centric mapping led with 50.22% share of the HD map for autonomous vehicles market size in 2024; sensor-fusion approaches are forecasted to advance at a 15.33% CAGR to 2030.
- By services, localization accounted for 42.02% of the HD map for autonomous vehicles market size in 2024, whereas update and maintenance is expected to log the highest 16.55% CAGR through 2030.
- By level of automation, Level 2-3 semi-autonomous systems held 64.56% of the HD map for autonomous vehicles market share in 2024, while Level 4-5 fully autonomous platforms are poised for a 20.05% CAGR between 2025-2030.
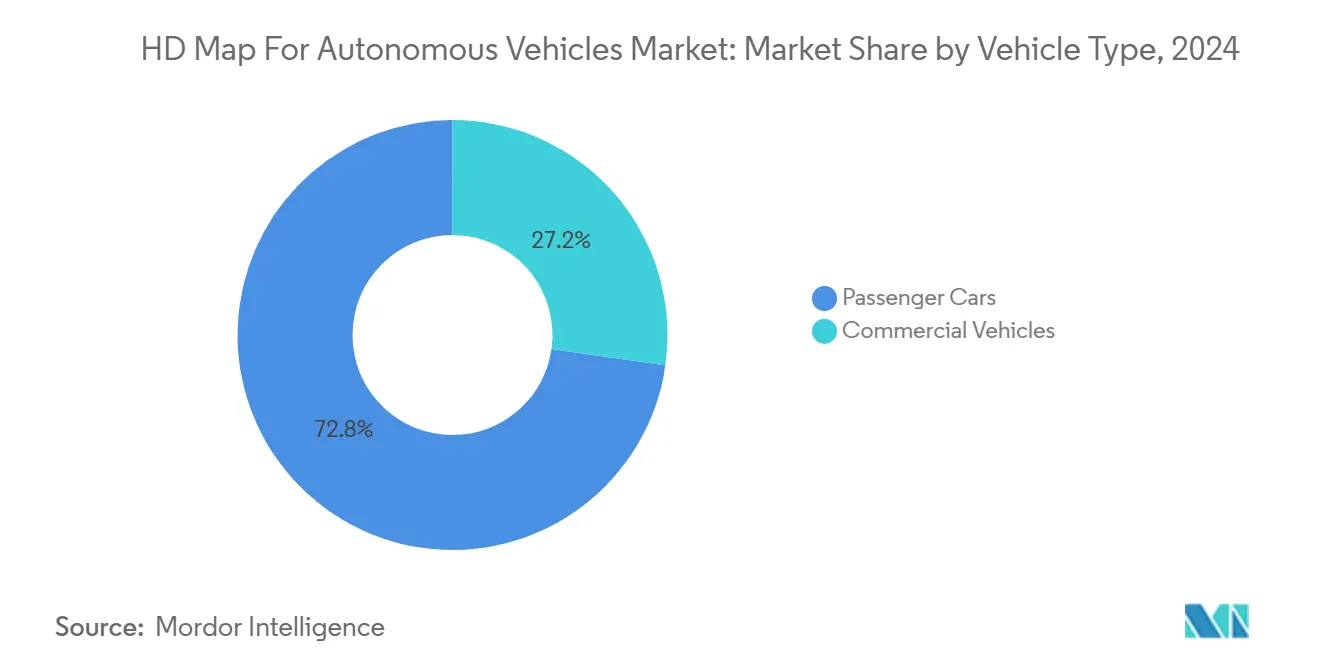
- By vehicle type, passenger cars led with a 72.76% contribution to the HD map for autonomous vehicles market size in 2024; commercial vehicles are on track for a 17.91% CAGR over the forecast period.
- By end use, OEM programs commanded 67.64% of the HD map for autonomous vehicles market share in 2024, whereas fleet-operator demand is forecast to expand at a 16.11% CAGR to 2030.
- By geography, North America topped with 38.94% revenue share of the HD map for autonomous vehicles market in 2024; Asia-Pacific is projected to be the fastest-growing region at a 13.34% CAGR through 2030.
Global HD Map For Autonomous Vehicles Market Trends and Insights
Drivers Impact Analysis*
| Driver | (~) % Impact on CAGR Forecast | Geographic Relevance | Impact Timeline |
|---|---|---|---|
| Commercialization of L2+/L3 ADAS | +1.9% | Global, with early adoption in North America & Europe | Medium term (2-4 years) |
| Falling LiDAR Costs | +1.5% | Global, particularly Asia-Pacific manufacturing hubs | Short term (≤ 2 years) |
| OEM-Map-Vendor Partnerships | +1.2% | North America and Europe, expanding to Asia-Pacific | Medium term (2-4 years) |
| EU 2026 ISA Mandate | +0.9% | Europe, with spillover effects globally | Short term (≤ 2 years) |
| Hybrid HD/SD Map Architectures | +0.5% | Global, with early deployment in cost-sensitive markets | Long term (≥ 4 years) |
| Relaxed Mapping-License Rules | +0.2% | China, with regional expansion to Southeast Asia | Medium term (2-4 years) |
| Source: Mordor Intelligence | |||
Rapid Commercialization of L2+/L3 ADAS in Premium Vehicles
Premium manufacturers now bundle automated lane-change, traffic-jam assist and highway pilot features that depend on centimeter-level road geometry. BMW, Mercedes-Benz and GM already cover close to 1 million km of highways with HD maps, monetizing the feature as a USD 2,000–5,000 option. Higher price points offset initial mapping costs and set the foundation for migration to mid-segment vehicles by 2027. Regulatory frameworks aligned with ISO 26262 further institutionalize HD maps as a central safety component, transforming the data from a competitive differentiator into a compliance necessity.
Falling LiDAR Costs Expanding Real-Time Point-Cloud Collection
A 90% cost drop over the past decade—from USD 75,000 to sub-USD 1,000—has turned LiDAR into a mainstream sensor for mobile mapping fleets. Mass-production suppliers in China and the United States now target USD 500 per automotive-grade unit at volume, making it economically viable to survey global road networks continuously. Crowdsourced strategies that ingest millions of daily detections from connected vehicles enhance coverage, accelerate update cycles and lower total cost of ownership.
OEM-Map-Vendor Partnerships for OTA Update Ecosystems
Automakers increasingly outsource map freshness to specialist partners that operate hyperscale cloud stacks. HERE’s USD 1 billion collaboration with AWS exemplifies the move toward continuous, AI-driven map generation and push-button distribution to millions of in-field vehicles. TomTom’s program with Volkswagen’s CARIAD unit brings similar capabilities into VW Group brands, enabling real-time lane closures, construction alerts, and speed-limit revisions[1]“CARIAD and TomTom Co-Develop Volkswagen Group's Next-Gen Navigation,” TomTom, tomtom.com. Subscription pricing models replace one-time map purchases, giving both sides an annuity revenue stream.
EU 2026 ISA Mandate for HD-Map-Based Speed Alerts
From mid-2026 every new passenger car sold in the European Union must hit 90% accuracy in speed-limit adherence and alerting. Lane-specific limits that vary by time of day or vehicle class turn generic navigation maps into non-compliant tools, forcing OEMs to integrate HD maps capable of lane discrimination. Penalties for non-compliance rise to 30,000 EUR per vehicle, catalyzing immediate investment in map coverage across the region and prompting global OEM platforms to standardize on a common HD-map backbone to amortize costs.
Restraints Impact Analysis*
| Restraint | (~) % Impact on CAGR Forecast | Geographic Relevance | Impact Timeline |
|---|---|---|---|
| Capital-Intensive Map Creation | -1.8% | Global, particularly affecting smaller market entrants | Long term (≥ 4 years) |
| Data-Localisation/Privacy Restrictions | -1.5% | Global, with acute impact in China, EU, and India | Medium term (2-4 years) |
| AI Occupancy-Network Perception | -1.1% | Global, led by Tesla and Chinese manufacturers | Long term (≥ 4 years) |
| Chinese Licence Oligopoly | -0.8% | China and Southeast Asia expansion markets | Medium term (2-4 years) |
| Source: Mordor Intelligence | |||
Global HD-Map Creation and Maintenance Remain Capital-Intensive
Full-city coverage can exceed USD 100 million when factoring in vehicle rigs, survey labor, data fusion and frequent re-drives. Urban cores demand refresh cycles every three to six months to stay current with roadworks and lane reallocations. The cash burden narrows the competitive field, disincentivizing smaller firms and slowing coverage in emerging markets where public funding is scarce. As a result, global rollouts tend to follow premium vehicle sales geographies first, delaying the benefits for cost-sensitive regions.
Cross-Border Data Localization/Privacy Restrictions
Sovereign data laws force mapping firms to replicate storage, compute and operations in multiple jurisdictions, raising operating expenses and complicating version control. China mandates in-country storage for HD map geometry; the EU’s General Data Protection Regulation (GDPR) restricts how vehicle trajectories can be collected and processed. Such fragmentation may require region-specific map layers or filtered data sets, increasing time-to-market and discouraging one-size-fits-all global products.
*Our forecasts treat driver/restraint impacts as directional, not additive. The impact forecasts reflect baseline growth, mix effects, and variable interactions.
Segment Analysis
By Solution Type: Cloud Dominance Drives Scalability
Cloud-hosted services secured 73.79% of the HD map for autonomous vehicles market 2024 as centralization eases sensor-data ingestion and AI-powered change detection. Continuous integration loops pull gigabytes of telemetry from connected fleets, enabling sub-daily updates in high-traffic corridors. This feedback mechanism raises the baseline accuracy that semi-autonomous functions need, consequently attracting further OEM demand and lifting the HD map for autonomous vehicles market size at a double-digit rate. Embedded platforms maintain a foothold for safety-critical fallback when connectivity drops, particularly in long-haul trucks.
During the forecast period, the cloud segment is projected to post a 14.26% CAGR through 2030 as hyperscalers subsidize infrastructure costs and drive economies of scale. Open APIs accelerate third-party app innovation, from insurance risk scoring to location-based commerce. Embedded systems will likely converge toward lightweight local caches that mirror the cloud master, trimming silicon footprints yet preserving determinism in steering and braking commands during network outages.


By Technology: LiDAR Leadership Faces Sensor-Fusion Challenge
LiDAR mapping accounted for 50.22% of the 2024 revenue of the HD map for autonomous vehicles market because its dense point clouds enable centimeter-grade lane modeling under all lighting conditions. This share underpins the HD map for the autonomous vehicles market size at the foundation level for Level 3+ systems. Cameras contribute colorized semantics but falter in fog and glare; radar supplements depth and metal detection but lacks acceptable resolution.
Sensor-fusion stacks are on a 15.33% CAGR trajectory through 2030, blending LiDAR’s geometry with camera semantics and radar redundancy to boost reliability while cutting bill-of-materials cost. TomTom’s Orbis Maps 3D captures this shift, packaging multi-sensor inputs into layered 3-D tiles that feed perception algorithms and ADAS controllers. As fusion algorithms mature, pure-LiDAR strategies may retreat toward niche roles in depot and shuttle operations where uniform conditions simplify the mapping task.
By Services: Localization Leads While Maintenance Accelerates
Localization services dominated 2024 with a 42.02% share of the HD map for autonomous vehicles market size, effectively anchoring vehicles to the digital road grid at centimeter fidelity. A robust localization layer reduces reliance on continuous GNSS availability, mitigating multipath errors in urban canyons. The strong pull from highway pilot programs keeps localization integral to near-term revenue, sustaining the HD map for autonomous vehicles market share leadership in service categories.
Update and maintenance is forecast to clock a 16.55% CAGR through 2030 as real-time crowdsourcing replaces quarterly refresh schedules. Dynamic Map Platform’s large-scale mapping of 1.5 million km in North America illustrates the industrialization of data-pipeline automation and governance, clearing the runway for map-as-a-service subscription models that bundle localization, change detection, and integrity checks into one fee.
By Level of Automation: Semi-Autonomous Dominance Shifts to Full Autonomy
Level 2-3 features held a 64.56% share of the HD map for autonomous vehicles market size in 2024, anchoring the current deployment reality where most commercially available autonomous features require driver supervision and intervention. These supervised functions require high-quality geometry yet tolerate occasional driver intervention, sustaining immediate uptake for HD map providers. The segment benefits from regulatory frameworks that permit supervised autonomous operation and consumer acceptance of driver-assistance technologies.
Level 4-5 deployments are on pace for a 20.05% CAGR toward 2030, driven by robotaxi and hub-to-hub freight pilots. Hyundai’s multi-year pact with Waymo to place autonomous IONIQ 5s into commercial service underlines the scale of forthcoming deployments[2]“Hyundai and Waymo Enter Multi-Year, Strategic Partnership,” Hyundai Motor Company, hyundainews.com. As driverless regulations solidify, the HD map for the autonomous vehicles market size for whole autonomy segments could exceed semi-autonomous revenue by the early 2030s.
By Vehicle Type: Passenger Cars Lead, Commercial Vehicles Accelerate
Passenger cars represented 72.76% of the 2024 revenue of the HD map for autonomous vehicles market, reflecting the consumer market's size and OEM investment in autonomous driving features for personal vehicles. Premium-segment ADAS packages and mainstream infotainment-navigation bundles further sustain the demand. Early adopters accept higher option prices, allowing OEMs to recoup mapping investments rapidly and reinforcing the passenger-car advantage in the HD map for autonomous vehicles market.
Commercial vehicles are projected to expand at 17.91% CAGR, propelled by freight-operator economics where duty-cycle utilization multiplies ROI on autonomy stacks. Aurora Innovation’s collaboration with Uber Freight targets fuel savings and driver-hours elimination along Gulf-Coast corridors, reinforcing HD mapping’s cost-reduction narrative. Predictable routes and depot hubs simplify map-maintenance logistics, accelerating the break-even horizon for fleet operators relative to consumer buyers.
By End Use: OEM Dominance Faces Fleet-Operator Challenge
OEM programs controlled 67.64% of the revenue of the HD map for autonomous vehicles market size in 2024, reflecting their role as primary customers for HD mapping services that integrate into vehicle production platforms. OEM partnerships with mapping providers create long-term revenue streams and enable the scale required for comprehensive map coverage. Standardized ECUs and wiring harnesses embed HD-map endpoints natively, locking in supplier relationships over multiyear vehicle platforms and cementing OEM sway over the HD map for autonomous vehicles market share.
Fleet operators are projected to post a 16.11% CAGR, driven by robotaxi services and commercial autonomous vehicle deployments that require specialized mapping solutions. Direct ownership of vehicles and operations allows these fleets to dictate faster revision cadences and specialized semantic layers for curb-space management, loading-dock alignment, or geofenced service zones that go beyond traditional OEM requirements. WeRide's launch of autonomous mobility services in Abu Dhabi through the Uber platform demonstrates this.
Geography Analysis
North America delivered 38.94% of the revenue of the HD map for autonomous vehicles market in 2024 due to extensive highway coverage, permissive regulatory sandboxes, and high consumer take rates for advanced driver-assistance subscriptions. Pro-innovation state laws, such as California’s permit scheme for commercial robotaxis, and federal guidance from NHTSA lower legal uncertainty for OEM road-map rollouts. Partnerships between mapping providers and cloud hyperscalers reinforce North American leadership by enabling minute-level map refresh across an already dense connected-vehicle base. Growth moderates toward a 10.35% CAGR as market penetration in luxury segments approaches saturation, though fleet-operator demand and replacement cycles sustain steady incremental gains.
Asia-Pacific is the fastest-growing territory with a 13.34% CAGR projected through 2030. Economies of scale in automotive sensor manufacturing compress hardware bills, while relaxed Chinese mapping-license reforms invite foreign expertise and capital. Domestic champions like NavInfo and AutoNavi extend their reach into Southeast Asia, leapfrogging legacy mapping gaps through dense mobile-device telemetry and localized cloud edges. As exemplified by Japan’s Dynamic Map Platform, government grants for standardization bodies further underpin regional momentum. The HD map for the autonomous vehicles market size expansion aligns with aggressive electrification and autonomy timelines publicized by Chinese OEMs, bringing HD mapping into mainstream mid-segment models earlier than in other regions.
Europe forecasts a 9.74% CAGR through 2030, energized by the 2026 ISA mandate yet tempered by strict privacy compliance overhead. The continent’s entrenched premium-OEM base aligns with local mapping specialists, illustrated by TomTom’s deepened alliance with Volkswagen, to deliver HD maps that satisfy functional-safety and GDPR requirements. Public funding channels, such as Germany’s Automated and Connected Driving initiative, partially offset high development costs, but fragmented linguistic and regulatory environments elevate per-country localization expenses. Peripheral regions in South America, the Middle East, and Africa will add single-digit revenue shares, primarily in confined commercial-vehicle use cases or smart-city pilot corridors.

Competitive Landscape
The HD mapping market exhibits moderate consolidation, creating a competitive environment that favors established providers with comprehensive mapping assets and OEM relationships. HERE leverages its long-running digital-map assets, differentiating through a unified cloud pipeline that snaps together satellite data, probe feeds, and onboard sensor uploads for hourly refresh rates. TomTom, ranked second, pivots toward end-to-end navigation stacks that directly embed HD map tiles and perception software into automaker DevOps pipelines.
NavInfo capitalizes on domestic licenses in China, frequently pairing with foreign OEMs to navigate cybersecurity constraints. Entrants such as NVIDIA and Mobileye move laterally from perception silicon into cloud-delivered map layers, catalyzing a blurring of boundaries between mapping and on-board perception. Hyperscalers like Amazon Web Services supply elastic compute and global content-delivery networks, positioning themselves as indispensable partners rather than direct competitors.
Specialized startups focus on high-value verticals—airport tugs, port drayage, mining haul trucks—where limited route diversity enables profitable micro-maps. Regulatory alignment with ISO 26262 elevates compliance spending, raising barriers for newcomers that lack established functional-safety processes. Meanwhile, the rise of AI occupancy grids that generate local semantic maps on the fly threatens to erode reliance on pre-surveyed HD layers, prompting incumbents to add dynamic object feeds and continuous crowd-sourced updates to stay relevant.
HD Map For Autonomous Vehicles Industry Leaders
HERE Technologies
TomTom N.V.
NavInfo Co., Ltd.
Dynamic Map Platform Co., Ltd.
AutoNavi Software Co., Ltd.
- *Disclaimer: Major Players sorted in no particular order

Recent Industry Developments
- October 2025: TomTom won a multi-year contract to supply full-stack navigation, live traffic, and speed-camera services across Europe for Hyundai, Kia, and Genesis vehicles.
- September 2025: Space42 and Dynamic Map Platform signed a long-term agreement to provide lane-level HD maps for GM’s Super Cruise across the United Arab Emirates.
- August 2025: The Dynamic Map Platform completed LiDAR mapping of more than 950,000 miles of North American highways.
- April 2025: TomTom was selected by Smart to integrate enhanced navigation into the brand’s global lineup of premium electric vehicles.


Global HD Map For Autonomous Vehicles Market Report Scope
| Cloud-Based |
| Embedded (On-board) |
| LiDAR-Based Mapping |
| Camera-Based Mapping |
| Radar-Based Mapping |
| Sensor Fusion |
| Localization |
| Mapping and Navigation |
| Update and Maintenance |
| Semi-Autonomous (Level 2–3) |
| Fully Autonomous (Level 4–5) |
| Passenger Cars |
| Commercial Vehicles |
| Original Equipment Manufacturer (OEM) |
| Fleet Operators |
| North America | United States |
| Canada | |
| Rest of North America | |
| South America | Brazil |
| Argentina | |
| Rest of South America | |
| Europe | United Kingdom |
| Germany | |
| Spain | |
| Italy | |
| France | |
| Russia | |
| Rest of Europe | |
| Asia-Pacific | India |
| China | |
| Japan | |
| South Korea | |
| Rest of Asia-Pacific | |
| Middle East and Africa | United Arab Emirates |
| Saudi Arabia | |
| Turkey | |
| Egypt | |
| South Africa | |
| Rest of Middle East and Africa |
| By Solution Type | Cloud-Based | |
| Embedded (On-board) | ||
| By Technology | LiDAR-Based Mapping | |
| Camera-Based Mapping | ||
| Radar-Based Mapping | ||
| Sensor Fusion | ||
| By Services | Localization | |
| Mapping and Navigation | ||
| Update and Maintenance | ||
| By Level of Automation | Semi-Autonomous (Level 2–3) | |
| Fully Autonomous (Level 4–5) | ||
| By Vehicle Type | Passenger Cars | |
| Commercial Vehicles | ||
| By End Use | Original Equipment Manufacturer (OEM) | |
| Fleet Operators | ||
| By Geography | North America | United States |
| Canada | ||
| Rest of North America | ||
| South America | Brazil | |
| Argentina | ||
| Rest of South America | ||
| Europe | United Kingdom | |
| Germany | ||
| Spain | ||
| Italy | ||
| France | ||
| Russia | ||
| Rest of Europe | ||
| Asia-Pacific | India | |
| China | ||
| Japan | ||
| South Korea | ||
| Rest of Asia-Pacific | ||
| Middle East and Africa | United Arab Emirates | |
| Saudi Arabia | ||
| Turkey | ||
| Egypt | ||
| South Africa | ||
| Rest of Middle East and Africa | ||


Key Questions Answered in the Report
How big is the HD map for autonomous vehicles market in 2025?
The market is valued at USD 1.29 billion in 2025 and is projected to grow at a 12.67% CAGR to 2030.
Which technology segment is expanding the fastest?
Sensor-fusion approaches that blend LiDAR, camera and radar inputs are projected to grow at a 15.33% CAGR through 2030.
Why do OEMs favor cloud-based HD mapping solutions?
Cloud architectures enable hourly map updates, reduce on-board compute complexity and open recurring-revenue subscription models for automakers.
What is driving Asia-Pacific’s rapid growth?
Relaxed Chinese mapping rules, sensor-cost advantages and aggressive commercialization timelines push the region to a 13.34% CAGR.
How are HD maps maintained after initial creation?
Connected vehicles continuously crowd-source road change data, which cloud pipelines ingest, validate and redistribute as OTA updates, accelerating refresh cycles.
What risks could slow HD map adoption?
High capital requirements, cross-border data-localization laws and emerging perception systems that reduce reliance on pre-surveyed maps may temper growth.
Page last updated on:


