US Autonomous Car Market Size and Share
Market Overview
| Study Period | 2019 - 2030 |
|---|---|
| Base Year For Estimation | 2024 |
| Forecast Data Period | 2025 - 2030 |
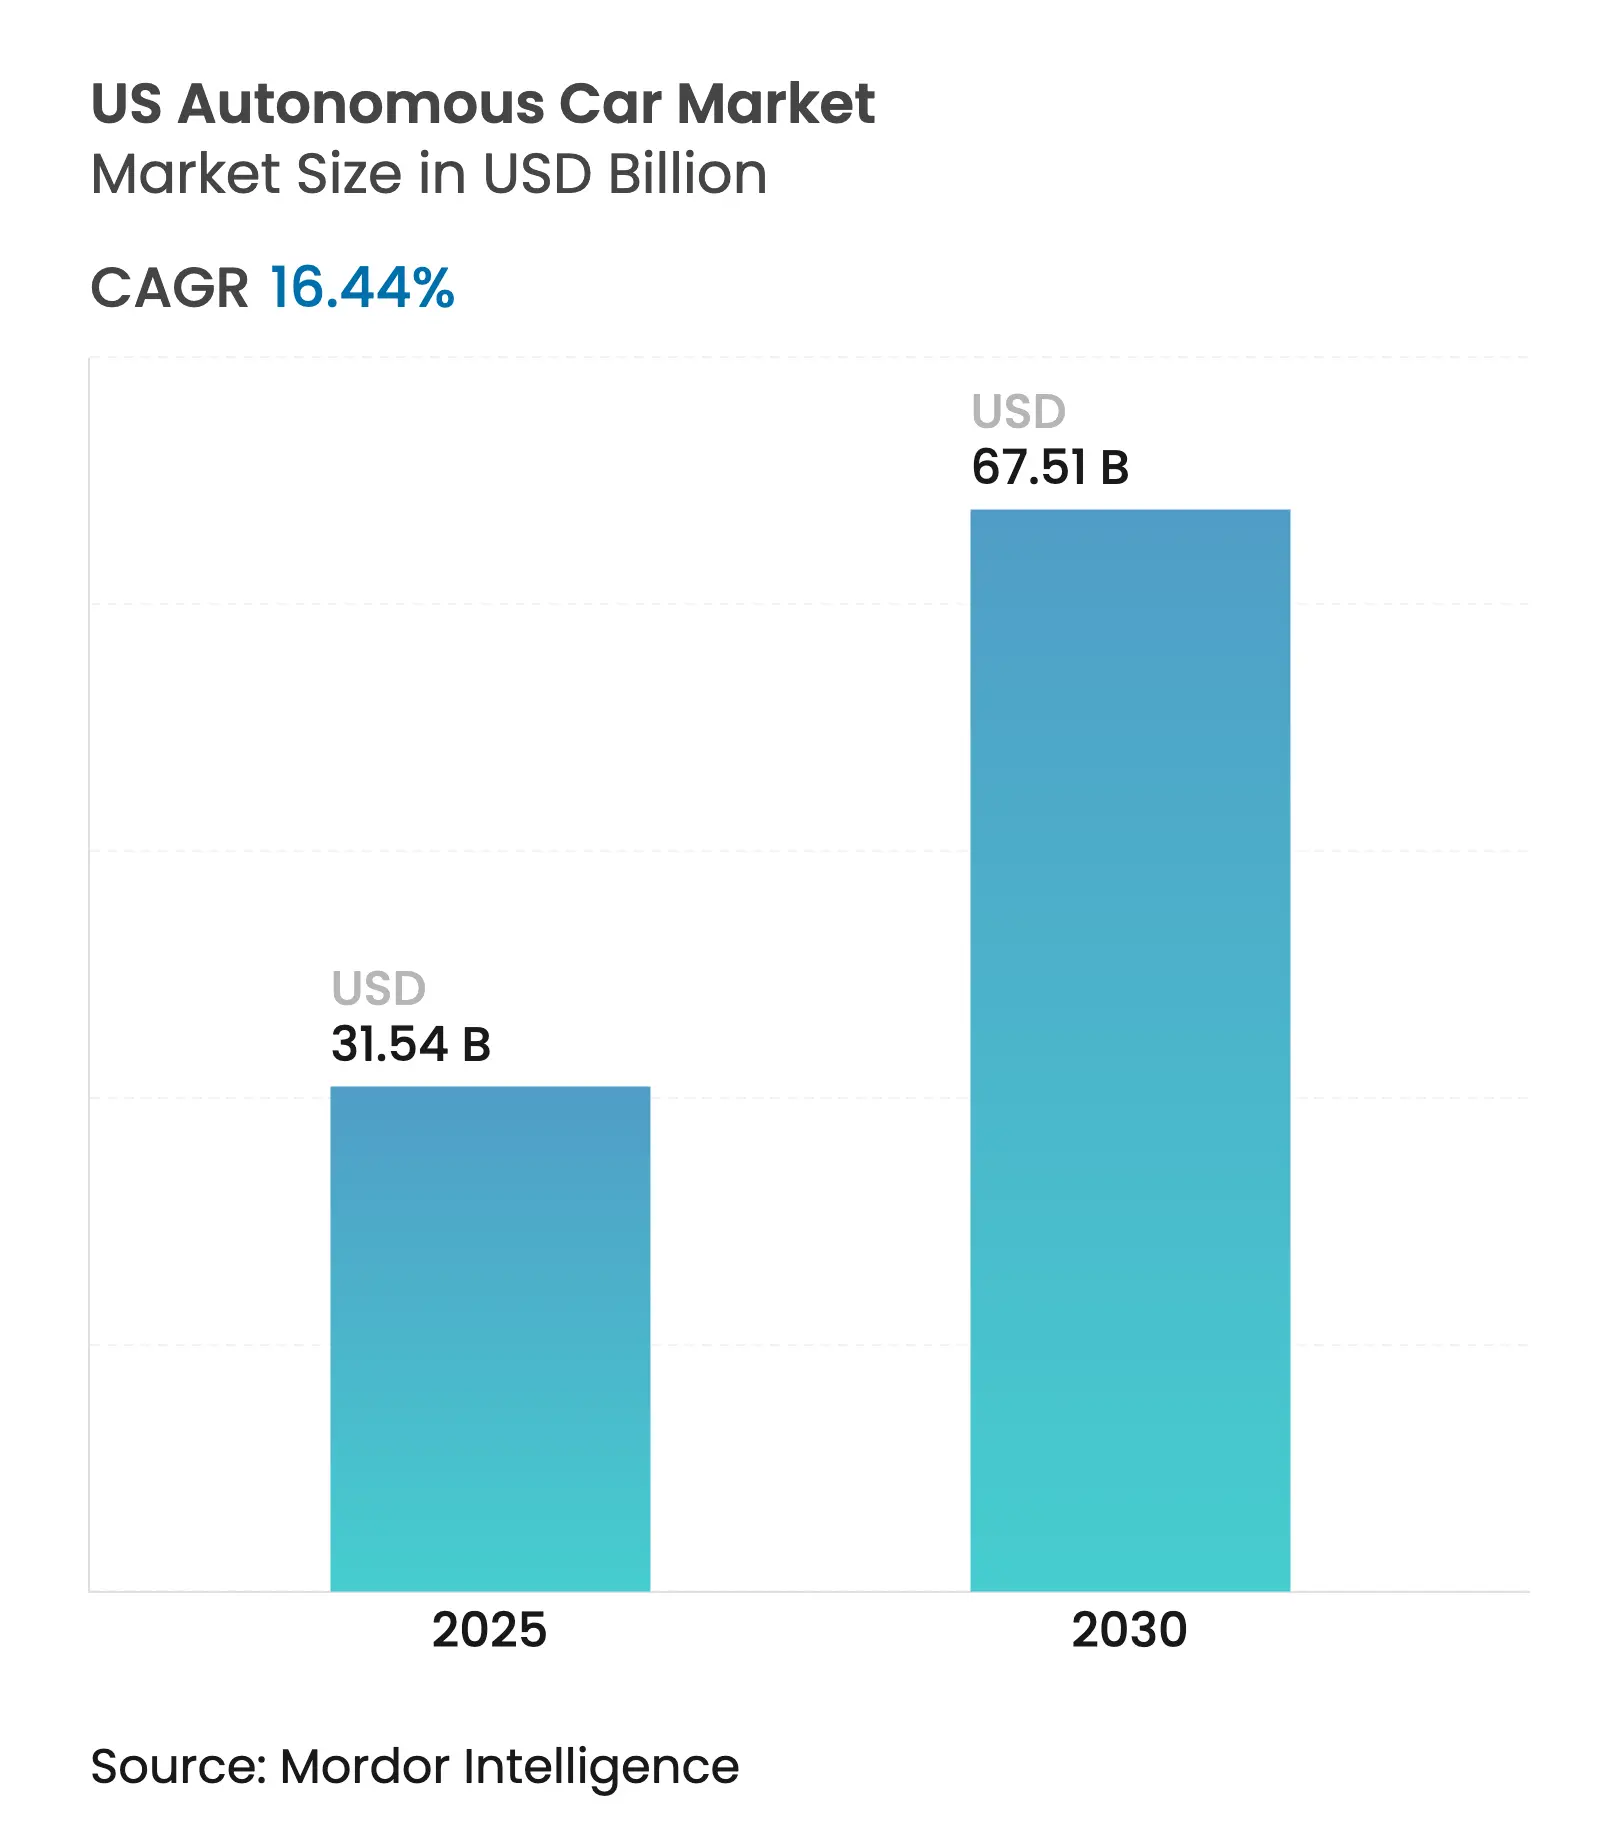
| Market Size (2025) | USD 31.54 Billion |
| Market Size (2030) | USD 67.51 Billion |
| Growth Rate (2025 - 2030) | 16.44 % CAGR |
| Market Concentration | Medium |
Major Players *Disclaimer: Major Players sorted in no particular order. Image © Mordor Intelligence. Reuse requires attribution under CC BY 4.0. |
US Autonomous Car Market Analysis by Mordor Intelligence
The US autonomous car market size is estimated at USD 31.54 billion in 2025, and is expected to reach USD 67.51 billion by 2030, at a CAGR of 16.44% during the forecast period (2025-2030). Federal regulatory clarity, steep sensor-cost declines, and deep OEM-technology alliances now converge to cut deployment timelines, improve unit economics, and broaden geographic reach. The National Highway Traffic Safety Administration’s (NHTSA) AV STEP framework, finalized in December 2024, trimmed exemption cycles by about 18 months, allowing companies to shift capital from compliance toward fleet scaling. Concurrently, the Department of Transportation’s (DOT) April 2025 guidance standardized interstate reporting, letting autonomous fleets cross state lines without duplicative approvals. Rapid cost compression pushed solid-state LiDAR prices under USD 500 per unit in 2025, widening the addressable price band for mid-market vehicles and strengthening the value proposition of the United States autonomous car market. As illustrated by General Motors and NVIDIA’s March 2025 compute collaboration and Hyundai and Waymo’s January 2025 platform deal, strategic partnerships offset individual R&D burdens, freeing OEMs to reallocate a huge amount per partner toward commercialization.
Key Report Takeaways
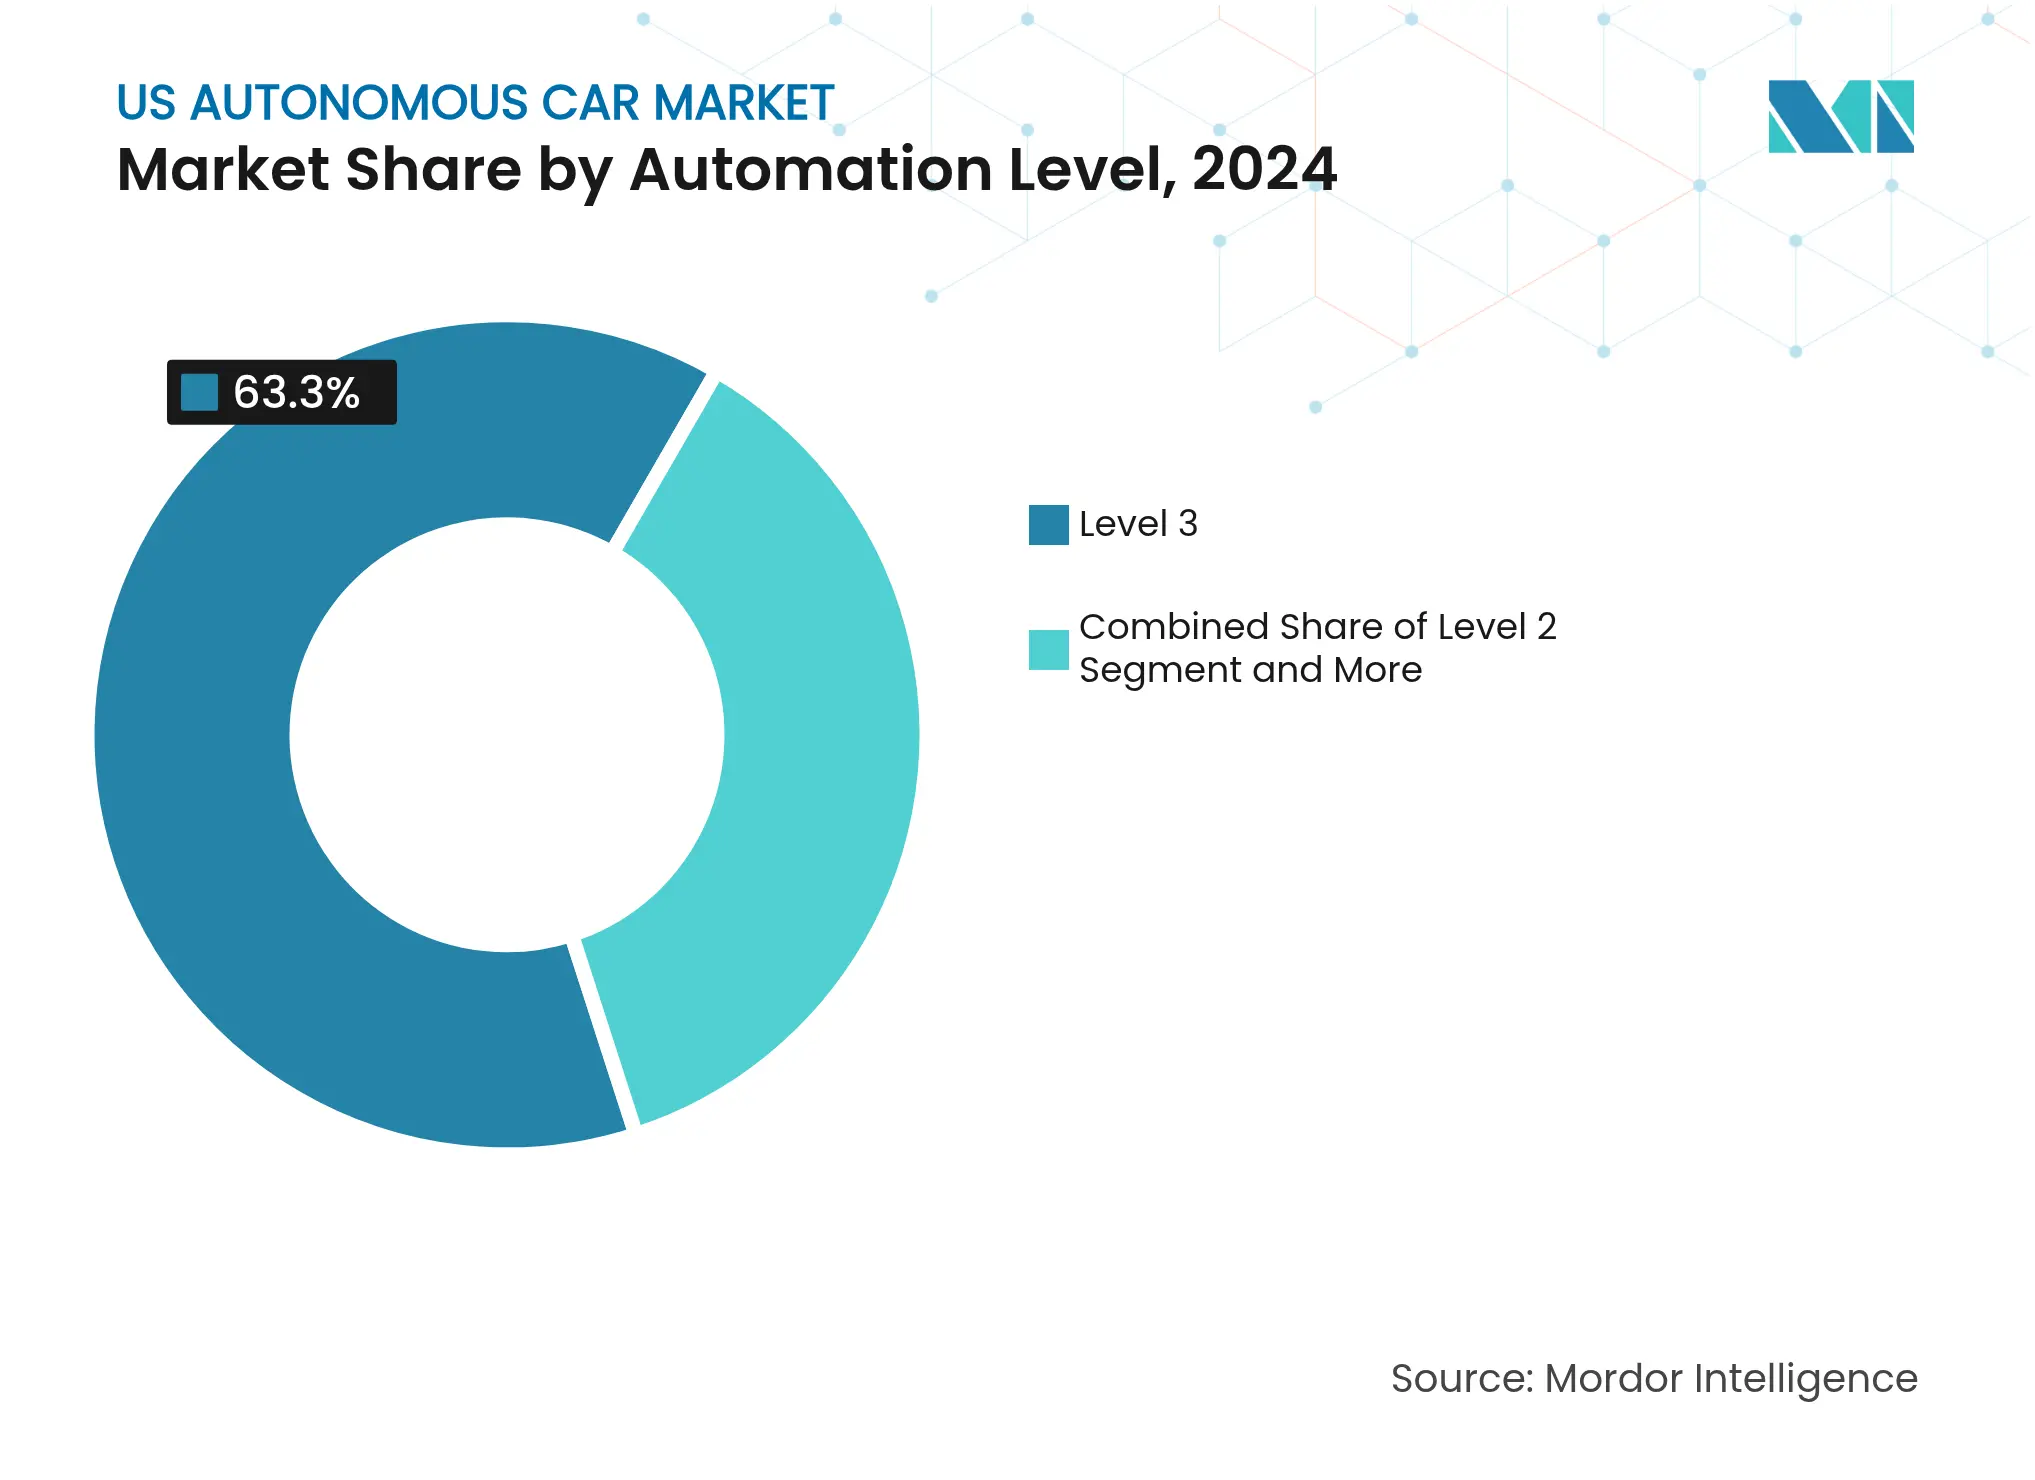
- By automation level, Level 3 systems led with 63.27% of the United States autonomous car market share in 2024, while Level 5 autonomy is projected to expand at a 16.47% CAGR through 2030.
- By sensor suite, radar-centric configurations dominated revenue at 38.71% in 2024, yet LiDAR-centric setups are poised to grow fastest at a 16.55% CAGR to 2030.
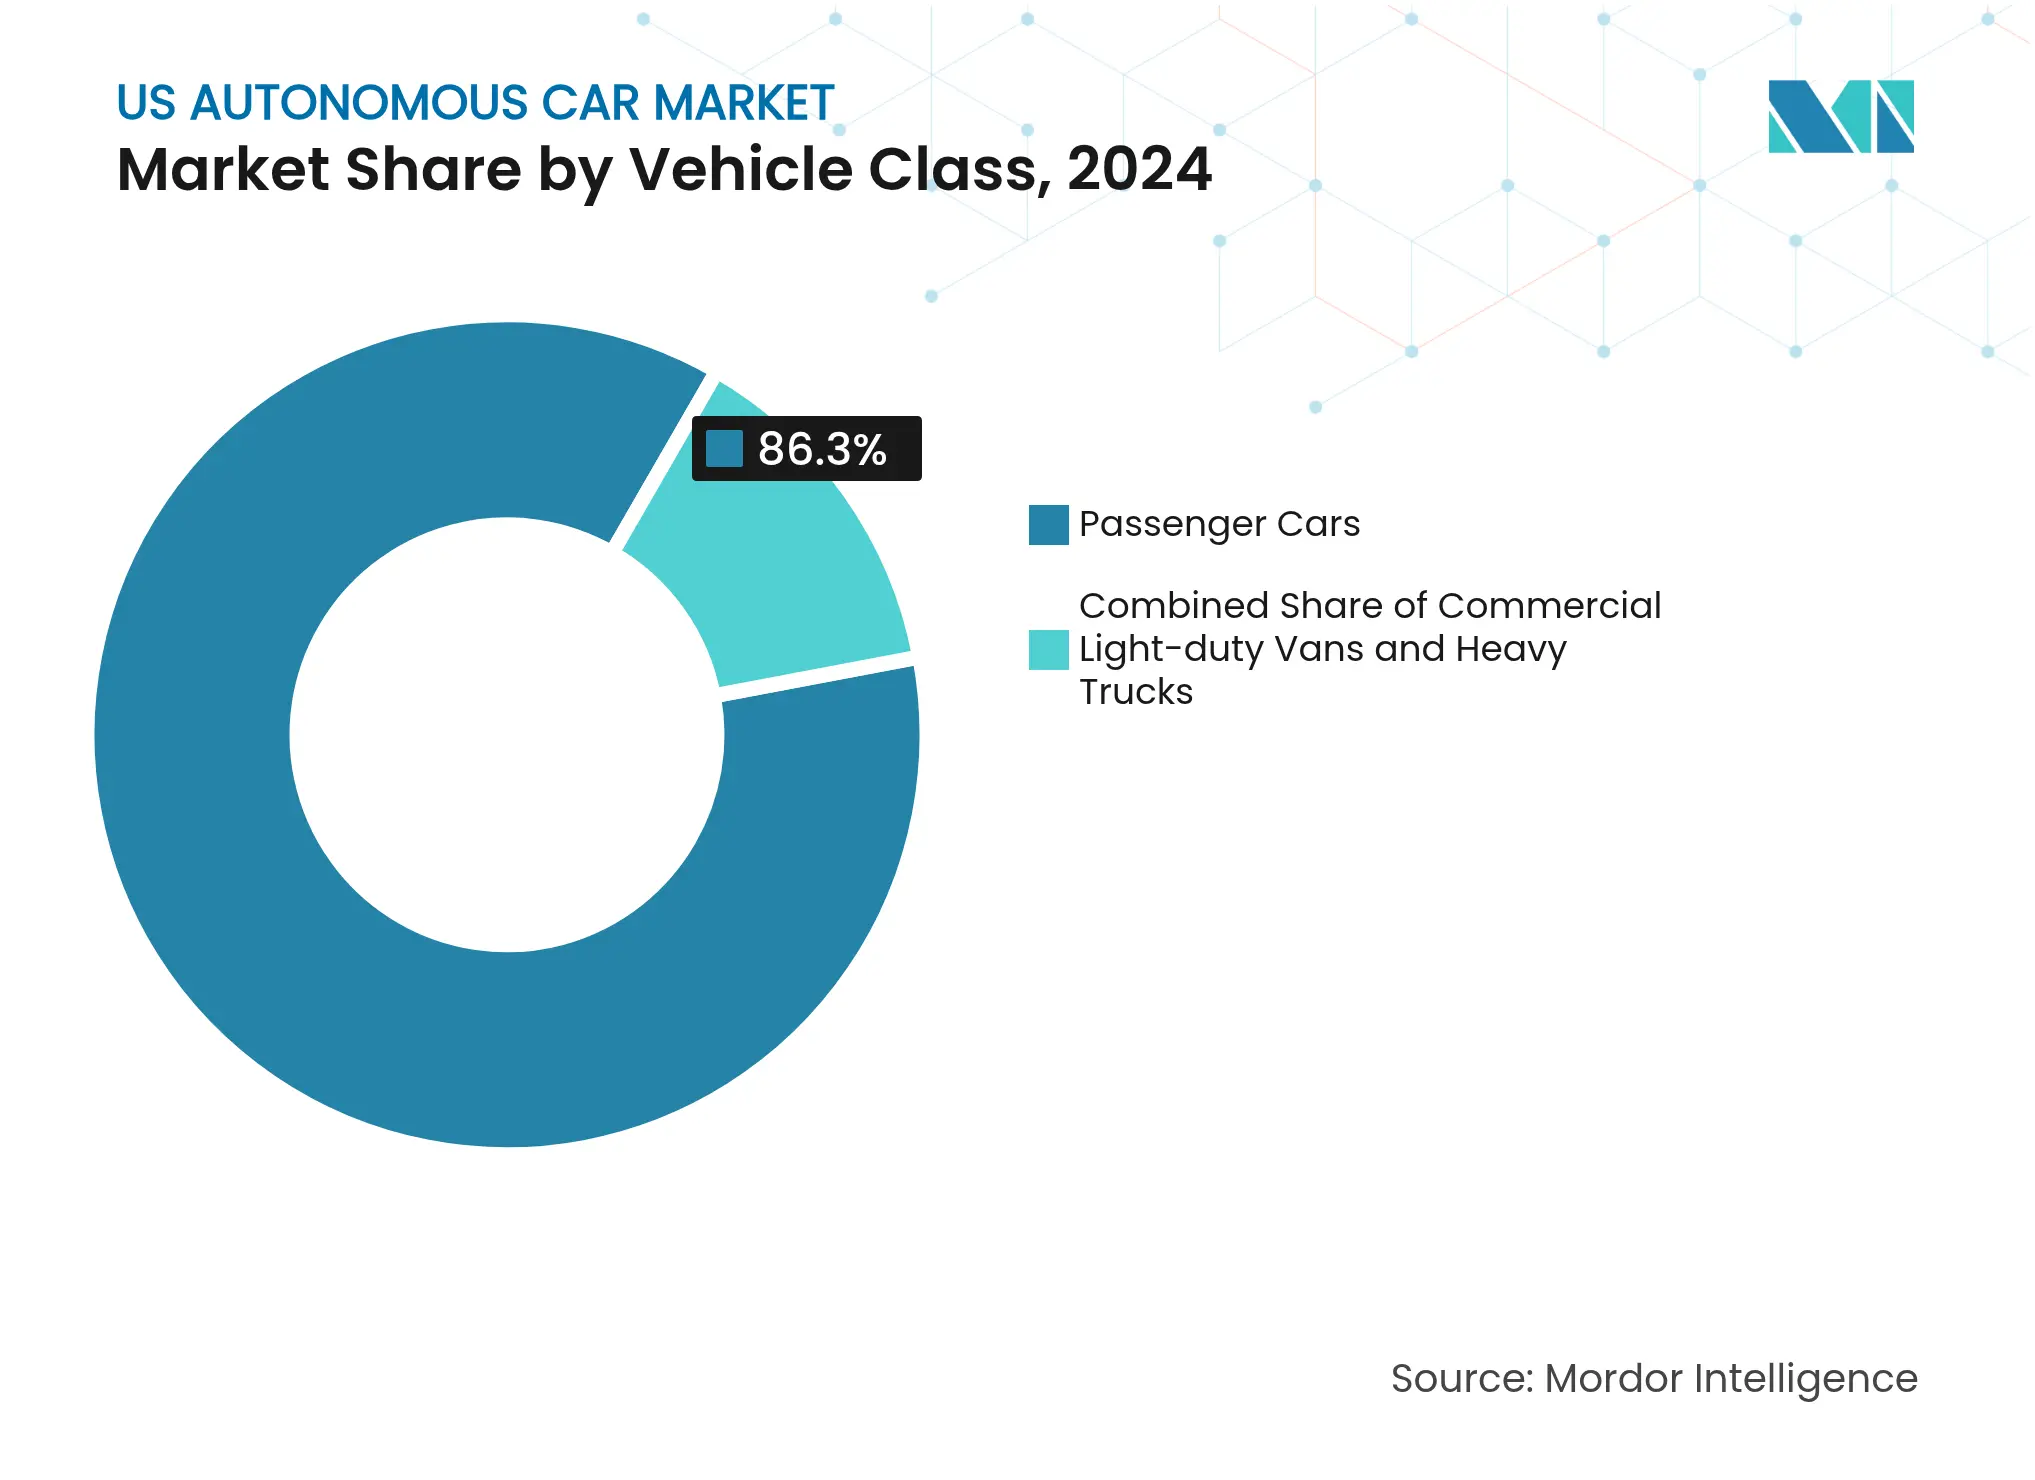
- By vehicle class, passenger cars accounted for 86.25% of 2024 share, whereas Medium and Heavy Trucks are forecast to register the strongest 16.49% CAGR over the outlook period.
- By propulsion, battery-electric platforms commanded 61.24% revenue in 2024 and are anticipated to post the highest 16.51% CAGR to 2030.
US Autonomous Car Market Trends and Insights
Drivers Impact Analysis
| Driver | (~) % Impact on CAGR Forecast | Geographic Relevance | Impact Timeline | |||
|---|---|---|---|---|---|---|
Rapid Sensor-Cost Compression Rapid Sensor-Cost Compression | +3.1% | National, with manufacturing hubs in MI, CA | Medium term (2-4 years) | (~) % Impact on CAGR Forecast:+3.1% | Geographic Relevance:National, with manufacturing hubs in MI, CA | Impact Timeline:Medium term (2-4 years) |
Growing Ride-Hailing Unit Growing Ride-Hailing Unit | +2.9% | Urban markets: SF, Phoenix, Nashville, Atlanta | Short term (≤ 2 years) | |||
Federal AV Testing Waivers Federal AV Testing Waivers | +2.8% | National, concentrated in AZ, TX, CA | Short term (≤ 2 years) | |||
OEM–Tech Mega-Partnerships De-Risk R&D Outlays OEM–Tech Mega-Partnerships De-Risk R&D Outlays | +2.4% | National, centered in Detroit, Silicon Valley | Medium term (2-4 years) | |||
Dedicated Autonomous Freight Corridors Dedicated Autonomous Freight Corridors | +1.8% | TX, AZ, NV interstate corridors | Long term (≥ 4 years) | |||
Bipartisan V2X Infrastructure Grants Unlock Deployment Bipartisan V2X Infrastructure Grants Unlock Deployment | +1.6% | National, early deployment in AZ, TX, UT | Long term (≥ 4 years) | |||
| Source: Mordor Intelligence | ||||||
Key Thresholds Breached as Sensor Costs Plummet
Solid-state architectures cut LiDAR prices three-fifths year-on-year, pushing automotive-grade units below the pivotal USD 500 threshold in early 2025 [1]“Investor Relations,” Luminar Technologies, luminar.com . Eliminating moving parts lowered failure rates by four-fifths, allowing mass-market programs to spec LiDAR without inflating MSRP. Simultaneously, the prices of high-resolution cameras plummeted, and bulk purchases of advanced radar modules became significantly cheaper. This price drop made the entire sensor suite much more affordable. By upgrading its vision-only system with these budget-friendly sensors, Tesla signals a changing financial landscape in autonomous technology. Current industry trends indicate a continued decrease in sensor costs, paving the way for autonomous features to become commonplace in mid-range vehicles. Such advancements bolster the competitive edge of the United States autonomous car industry.
Growing Ride-Hailing Unit: Economics Advantage
Waymo's operations in Phoenix have outperformed traditional taxi services, largely thanks to constant vehicle usage and the removal of driver-related costs. On-demand fleet vehicles see much higher utilization rates than privately owned cars, turning them from dormant assets into valuable investments. In September 2025, Lyft broadened its collaboration with Waymo, introducing it to Nashville, highlighting the versatility of autonomous fleets in diverse traffic settings. Earlier that same year, Uber's launch in Atlanta validated the potential for scaling autonomous services across different platforms with only minor technical tweaks. Yet, a significant hurdle remains: achieving the necessary fleet density, compounded by high insurance costs that persist until more robust data can alleviate perceived risks.
Federal AV Testing Waivers Accelerate Commercial Pilots
The NHTSA AV STEP program reduced approval windows from 24 months to roughly six, shifting autonomous launches from concept to revenue service in a single budget cycle [2]“Automated Vehicles; Exemption Guidance,” NHTSA, nhtsa.gov . DOT’s 2025 interstate protocols now allow test vehicles licensed in Arizona to operate seamlessly in Texas, dropping administrative overhead by almost two-fifths. Aurora used the waiver to open its Houston-Dallas freight lane eight months earlier than planned, illustrating how policy certainty directly shapes the United States' autonomous car market. Venture funding highly flowed into waiver-eligible projects during 1H 2025, underscoring investor confidence in predictable, national-level governance. Continued effectiveness hinges on inter-agency coordination; divergent interpretations could revive the fragmented regulatory landscape that previously impeded scale.
OEM–Tech Mega-Partnerships De-Risk R&D Outlays
GM’s compute pact with NVIDIA bundles DRIVE Hyperion hardware with Ultium-based platforms, letting each firm shave off highly duplicative R&D. Hyundai provides IONIQ 5 chassis. At the same time, Waymo supplies software under a January 2025 accord that compresses launch timelines by 18 months. Uber’s alliance with Volkswagen expands robotaxi fleets without direct IP spend, signaling a maturation phase where ecosystem orchestration beats vertical integration. As Level 4 systems cost the most, partnerships act as capital moderators and accelerate the United States' autonomous car market expansion.
Restraints Impact Analysis
| Restraint | (~) % Impact on CAGR Forecast | Geographic Relevance | Impact Timeline | |||
|---|---|---|---|---|---|---|
High-End Lidar & Compute Bom High-End Lidar & Compute Bom | -2.1% | National, affecting premium vehicle segments | Short term (≤ 2 years) | (~) % Impact on CAGR Forecast:-2.1% | Geographic Relevance:National, affecting premium vehicle segments | Impact Timeline:Short term (≤ 2 years) |
Public-Safety Liability Remains Unresolved Public-Safety Liability Remains Unresolved | -1.9% | National, acute in CA, NY regulatory jurisdictions | Medium term (2-4 years) | |||
City-Level Robotaxi Moratoriums City-Level Robotaxi Moratoriums | -1.5% | Urban markets, particularly SF, NYC, Chicago | Short term (≤ 2 years) | |||
Automotive-Grade GPU Supply Bottlenecks Automotive-Grade GPU Supply Bottlenecks | -1.4% | National, concentrated in automotive manufacturing hubs | Short term (≤ 2 years) | |||
| Source: Mordor Intelligence | ||||||
Despite Industry Declines, Premium LiDAR and Computing Costs Stay High
High-performance autonomous vehicle setups, combining multiple LiDAR units with advanced computing platforms, face high hardware costs, limiting their use to commercial applications like robotaxis and freight services. Delays in next-generation chips have increased energy consumption and required heat management redesigns. Low production volumes hinder cost reductions in automotive-grade semiconductors, keeping profit margins narrow in the U.S. mass-market autonomous car industry until manufacturing scales up or sensor-fusion technologies reduce hardware redundancy.
Public-Safety Liability Remains Unresolved
In 2025, lawmakers in various states debated different approaches to liability in autonomous vehicle legislation. This raised concerns about a fragmented regulatory landscape that could impede nationwide rollout plans. A case in point was California’s temporary suspension of Cruise’s operating permits, highlighting a crucial point: having the technology ready doesn't ensure legal clarity. Insurance providers view this uncertainty as a significant risk, leading to higher premiums than those for traditional vehicle policies. In the absence of unified federal guidelines, situations involving partial autonomy—where control alternates between human and machine—remain legally murky. This ambiguity hampers public trust and stalls the wider deployment of autonomous fleets in the U.S. market.
Segment Analysis
By Automation Level: Level 3 Dominance Masks Level 5 Acceleration
Level 3 systems captured 63.27% of 2024 deployments, buoyed by Mercedes-Benz Drive Pilot, BMW Highway Assistant, and Honda Traffic Jam Pilot. These conditional-autonomy features enable hands-free cruising yet demand driver readiness, a compromise aligned with current liability norms. Standardized NHTSA reporting launched in 2025 trims paperwork, spurring OEM rollout in additional states. Level 2 ADAS, led by Tesla and Ford, sustains volume but faces escalating scrutiny following high-profile incidents. In contrast, Level 5 robotaxis, though numerically small, post a 16.47% CAGR through 2030 as Waymo expands to Nashville, Atlanta, and a planned Los Angeles launch. Commercial corridors such as Aurora’s freight lane show Level 4’s viability when operational design domains remain tightly bounded. The divergent paths reveal how consumer applications advance sequentially while commercial-freight programs jump directly to autonomy levels justified by cost savings.
Second-order effects reinforce this bifurcation. Premium insurers are crafting Level 5-specific products, reducing underwriting friction and nudging fleet managers toward fully driverless configurations. Meanwhile, liability ambiguity around Level 3 handoffs forces OEMs to embed redundant sensing and over-the-air safety patches, adding USD 1,200 per car. Regulatory relief in waiver states tempers the cost. Still, until federal policy matures, the United States' autonomous car market will observe a two-track maturity curve where freight and ride-hailing lead broader consumer diffusion.
Note: Segment shares of all individual segments available upon report purchase
By Sensor Suite: Radar-Centric Pragmatism Yields to LiDAR Innovation
Radar-forward architectures held 38.71% market revenue in 2024, favored for resilience against fog, snow, and heavy rain. Modern radar arrays, now more affordable than mechanical LiDAR systems, are driving advanced sensing capabilities in budget-sensitive applications, reflecting broader cost-reduction trends in the autonomous vehicle sector. Yet LiDAR-centric setups log the fastest 16.55% CAGR through 2030 after solid-state breakthroughs pushed unit cost below USD 500 in 2025. Camera-only strategies meet neural-network scaling limits as city complexity rises, prompting Tesla to pilot forward-facing LiDAR in next-gen prototypes. Hybrid sensor-fusion models blend short-range radar, medium-range LiDAR, and stereoscopic cameras to attain centimeter-level localization without single-sensor dependency.
Fleet operators in crowded urban centers are prioritizing performance over cost, realizing that investing in LiDAR technology boosts safety and operational reliability. Concurrently, strides in silicon photonics hint at a future where LiDAR systems are more budget-friendly, closing the price gap with radar-only configurations. As prices drop, companies holding pivotal LiDAR intellectual property gain a strategic edge, altering supplier dynamics and complicating negotiations in the U.S. autonomous car sector.
By Vehicle Class: Passenger-Car Volume Enables Commercial Innovation
Passenger cars dominated at 86.25% volume in 2024, owing to ADAS popularity and early robotaxi penetration. Over-the-air feature activation lets OEMs monetize autonomy post-sale, extending lifetime revenue and enlarging software margins. Medium and Heavy Trucks, while having a small base today, register the swiftest 16.49% CAGR as freight economics favor 24/7 utilization. Aurora’s Houston-Dallas route proves that eliminating mandatory rest breaks adds two extra daily cycles, lifting asset revenue potential two-fifths. Commercial vans enjoy retailer demand for last-mile delivery, yet unmanned-operation rules still cap near-term scale.
Ecosystem spillovers emerge: trucking corridors seed V2X nodes that passenger services later reuse, compressing payback periods for public infrastructure. Conversely, passenger-car data pipelines enrich heavy-truck perception models, expediting safety-case validation. Such symbioses accelerate market maturation, reinforcing diversification within the United States autonomous car market.
Note: Segment shares of all individual segments available upon report purchase
By Propulsion: Battery-Electric Integration Creates Autonomous Advantage
Battery-electric vehicles (BEVs) represented 61.24% of 2024 autonomous deployments and are set to compound at a 16.51% CAGR through 2030 as shared high-voltage architectures power both drive motors and AI compute. Co-located cooling loops trim system weight and reduce bill-of-material costs compared to internal-combustion platforms. While hybrid powertrains dominate routes over long distances, especially where charging stations are few, the emergence of fast-charge corridors on I-10 and I-35 is steadily eroding that edge. Fleet operators are capitalizing on vehicle-to-grid revenues, further skewing the total-cost-of-ownership in favor of electrified autonomy.
Reduced mechanical complexity translates to less downtime, enabling fleets to achieve higher availability, outpacing diesel counterparts. The benefits of noise reduction allow for night-time deliveries in sound-sensitive downtowns and hint at innovative service models, amplifying the importance of propulsion choices in the U.S. autonomous car landscape.
Geography Analysis
California, Arizona, Texas, and Florida captured roughly three-fifths of 2024 deployments thanks to permissive rules, abundant mapping data, and public-private pilot programs. California nurtures robotaxi density in San Francisco, though the Public Utilities Commission’s cautious stance injects episodic uncertainty [3]“Autonomous Vehicle Permit Actions,” California Public Utilities Commission, cpuc.ca.gov . Arizona’s consistent, pro-innovation framework positions Phoenix as the first large-scale revenue robotaxi zone, generating live data essential for neural-network refinement. Texas leverages a 680-mile smart-highway network plus legislative green lights for driverless freight, anchoring Aurora’s signature corridor.
Climatic predictability across Sun Belt states cuts perception edge-case frequency, simplifying safety-case compilation. Nevada’s early testing licenses attracted initial R&D, yet its smaller metro base limits commercial scale compared with Arizona. DOT’s April 2025 interstate guidance reduces friction for multi-state fleets, but insurance and taxation discrepancies still fragment cross-border economics. Federal V2X grants a huge amount to Arizona, Texas, and Utah to install a backbone other states can join, suggesting geographic concentration will remain pronounced until 2029 build-outs conclude.
Emerging Southeast and Mountain West hubs seek to replicate Sun Belt momentum, drafting legislation that echoes Arizona’s model while courting pilot programs. Nashville’s September 2025 Waymo-Lyft launch and Atlanta’s June 2025 Waymo-Uber debut underscore the pattern: ride-hailing alliances spearhead entry, then freight and delivery services follow once data density justifies expansion. States lagging on liability reform risk capital flight as investors concentrate on jurisdictions synchronizing legal and technical frameworks, reinforcing the uneven regional development of the United States' autonomous car market.

Competitive Landscape
Market Concentration
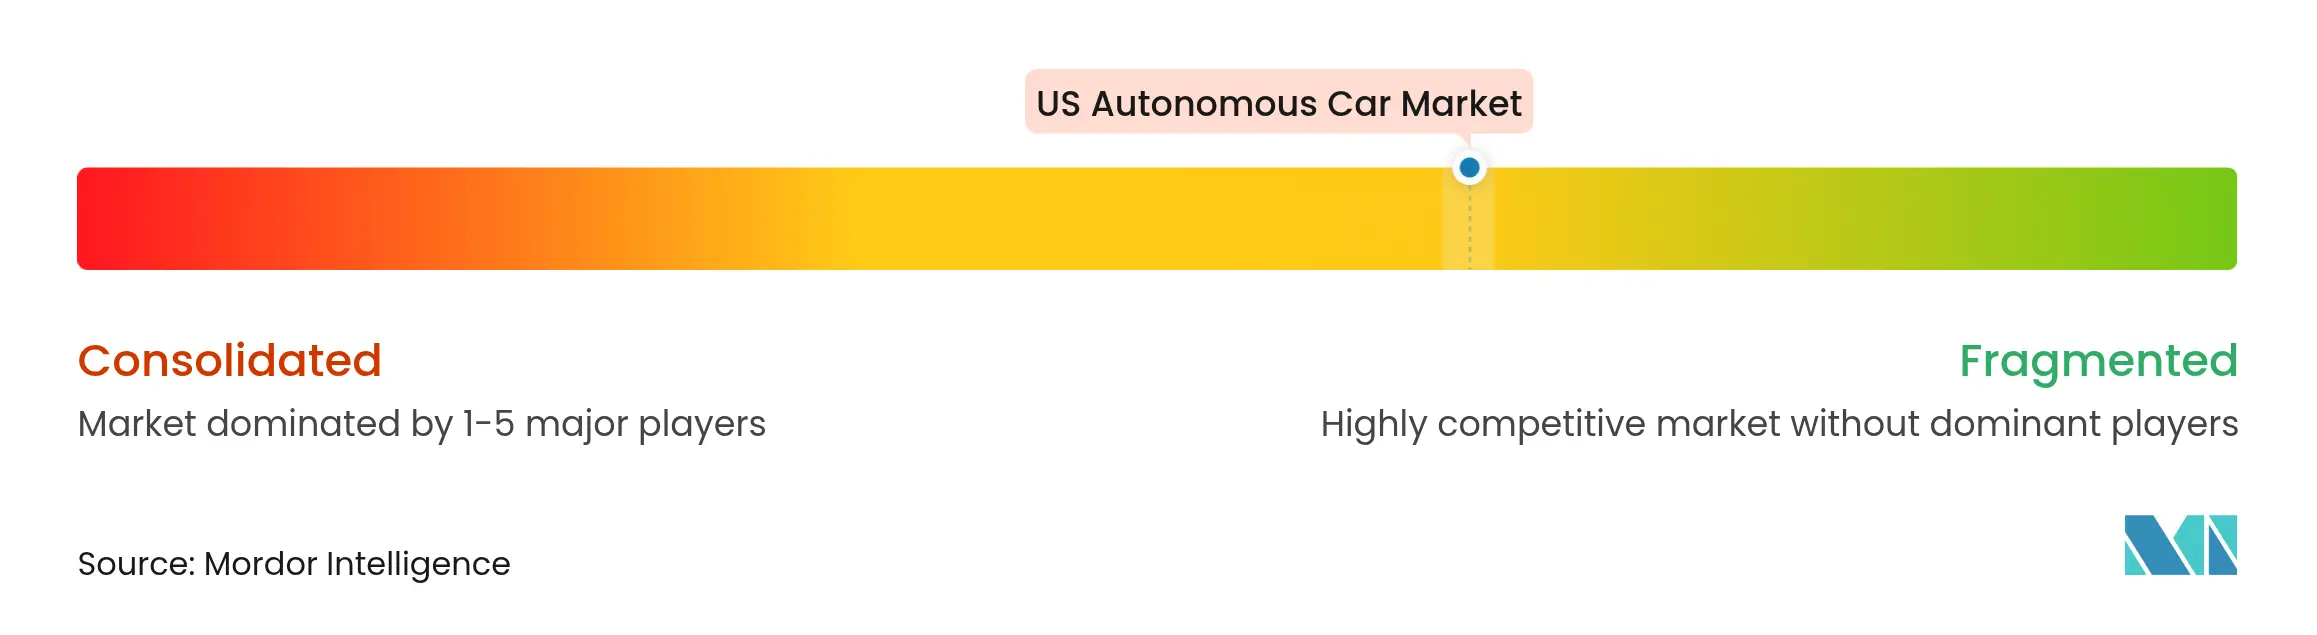
No firm exceeded one-fifth of revenue in 2024, keeping the United States' autonomous car market highly fragmented. Waymo and Cruise pursue deep stack ownership, banking on data network effects to outpace component-level competitors. Waymo’s October 2024 rise delivers an expansion war chest unmatched in the sector. Traditional OEMs lacking in-house autonomy now partner aggressively; Hyundai and Waymo, GM and NVIDIA, plus Ford’s deal flow with Argo-legacy teams typify the shift from make to ally. Timely access to urban test miles outweighs pure hardware differentiation as algorithm fitness becomes the principal moat.
Specialists fill profitable niches. Nuro targets sub-35 mph delivery lanes, sidestepping complex highway scenarios. Aurora zeroes in on interstate freight, leveraging constrained design domains for quicker commercial launch. Sensor vendors like Luminar lock in binding agreements with multiple OEMs, hedging against any single integrator’s fortunes while capitalizing on cross-platform scale. Patent landscapes skew toward perception fusion and fail-operational redundancy, yet rapid iteration cycles limit long-term defensive value, favoring players with continuous data inflow rather than static IP stockpiles.
Consolidation pressures mount as capital burn accelerates. Firms are unable to secure city permits or corridor slots risk relegation to Tier-2 supplier roles. Investors increasingly evaluate political-relations competence alongside engineering credentials, given that San Francisco municipal friction proved technical leadership insufficient for market access. Consequently, regulatory diplomacy stands beside compute throughput as a decisive factor in 2030 leadership rankings within the United States autonomous car market.
US Autonomous Car Industry Leaders

*Disclaimer: Major Players sorted in no particular order
Recent Industry Developments
- September 2025: Lyft partnered with Waymo to launch robotaxi services in Nashville, extending autonomous ride-hailing into the Southeast.
- June 2025: Uber began Waymo robotaxi service in Atlanta, marking the largest metropolitan rollout outside the West Coast.
- May 2025: Aurora Innovation commenced fully driverless operations on the Houston-Dallas freight corridor, the first commercial long-haul autonomous trucking lane in the United States.
Table of Contents for US Autonomous Car Industry Report
1. Introduction
- 1.1Study Assumptions & Market Definition
- 1.2Scope of the Study
2. Research Methodology
3. Executive Summary
4. Market Landscape
- 4.1Market Overview
- 4.2Market Drivers
- 4.2.1Key Thresholds Breached as Sensor Costs Plummet
- 4.2.2Growing Ride-Hailing Unit-Economics Advantage
- 4.2.3Federal AV Testing Waivers Accelerate Commercial Pilots
- 4.2.4OEM–Tech Mega-Partnerships De-Risk R&D Outlays
- 4.2.5Dedicated Autonomous Freight Corridors In Sun Belt
- 4.2.6Bipartisan V2X Infrastructure Grants Unlock Deployment
- 4.3Market Restraints
- 4.3.1Despite Industry Declines, Premium LiDAR and Computing Costs Stay High
- 4.3.2Public-Safety Liability Remains Unresolved
- 4.3.3City-Level Robotaxi Moratoriums After Traffic Incidents
- 4.3.4Automotive-Grade GPU Supply Bottlenecks
- 4.4Value / Supply-Chain Analysis
- 4.5Regulatory Landscape
- 4.6Technological Outlook
- 4.7Porter’s Five Forces
- 4.7.1Bargaining Power of Suppliers
- 4.7.2Bargaining Power of Consumers
- 4.7.3Threat of New Entrants
- 4.7.4Threat of Substitutes
- 4.7.5Intensity of Rivalry
5. Market Size & Growth Forecasts (Value (USD) and Volume (Units))
- 5.1By Automation Level
- 5.1.1Level 2 (Advanced Driver Assistance)
- 5.1.2Level 3 (Conditional Autonomy)
- 5.1.3Level 4 (High Autonomy)
- 5.1.4Level 5 (Full Autonomy)
- 5.2By Sensor Suite
- 5.2.1Radar-centric
- 5.2.2LiDAR-centric
- 5.2.3Camera-only
- 5.2.4Ultrasonic & Others
- 5.3By Vehicle Class
- 5.3.1Passenger Cars
- 5.3.2Commercial Light-duty Vans
- 5.3.3Medium and Heavy Trucks
- 5.4By Propulsion
- 5.4.1Battery-Electric
- 5.4.2Hybrid
- 5.4.3Internal-Combustion
6. Competitive Landscape
- 6.1Market Concentration
- 6.2Strategic Moves
- 6.3Market Share Analysis
- 6.4Company Profiles (includes Global Level Overview, Market Level Overview, Core Segments, Financials as Available, Strategic Information, Market Rank/Share for Key Companies, Products and Services, SWOT Analysis, and Recent Developments)
- 6.4.1Waymo LLC
- 6.4.2Cruise LLC (General Motors)
- 6.4.3Tesla Inc.
- 6.4.4Ford Motor Co. (BlueCruise)
- 6.4.5Aurora Innovation Inc.
- 6.4.6Zoox Inc. (Amazon)
- 6.4.7Mobileye Global Inc.
- 6.4.8NVIDIA Corp.
- 6.4.9Aptiv PLC
- 6.4.10Honda Motor Co. Ltd.
- 6.4.11Bayerische Motoren Werke AG (BMW)
- 6.4.12Uber Technologies Inc.
- 6.4.13Apple Inc.
- 6.4.14Toyota Motor Corp. (Woven Planet)
- 6.4.15Nuro Inc.
- 6.4.16Pony.ai Inc.
- 6.4.17Rivian Automotive LLC
- 6.4.18Daimler Truck AG (Torc Robotics)
- 6.4.19Intel Corp. (Wind River)
- 6.4.20Nissan Motor Corp.
7. Market Opportunities & Future Outlook
- 7.1White-space & Unmet-Need Assessment
US Autonomous Car Market Report Scope
An autonomous car can sense its environment and move with little or no human input. Autonomous cars are made up of numerous sensors, such as lidar and radar systems, working concurrently to carry out operations automatically or without the help of drivers. The US autonomous car market report covers the latest trends and COVID-19 impact, followed by technological developments.
The report's scope is segmented by type, sensors, and level of automation. The market is segmented by type into fully autonomous and semi-autonomous vehicles. By sensors, the market is segmented into the image, lidar, radar, ultrasonic, and other sensors.
By level of automation, the market is segmented into conditional automation (Level 3), high automation (Level 4), and full automation (Level 5)). For each segment, market sizing and forecasts are based on value (USD).