Hardware-as-a-Service (HaaS) Market Size and Share
Market Overview
| Study Period | 2020 - 2031 |
|---|---|
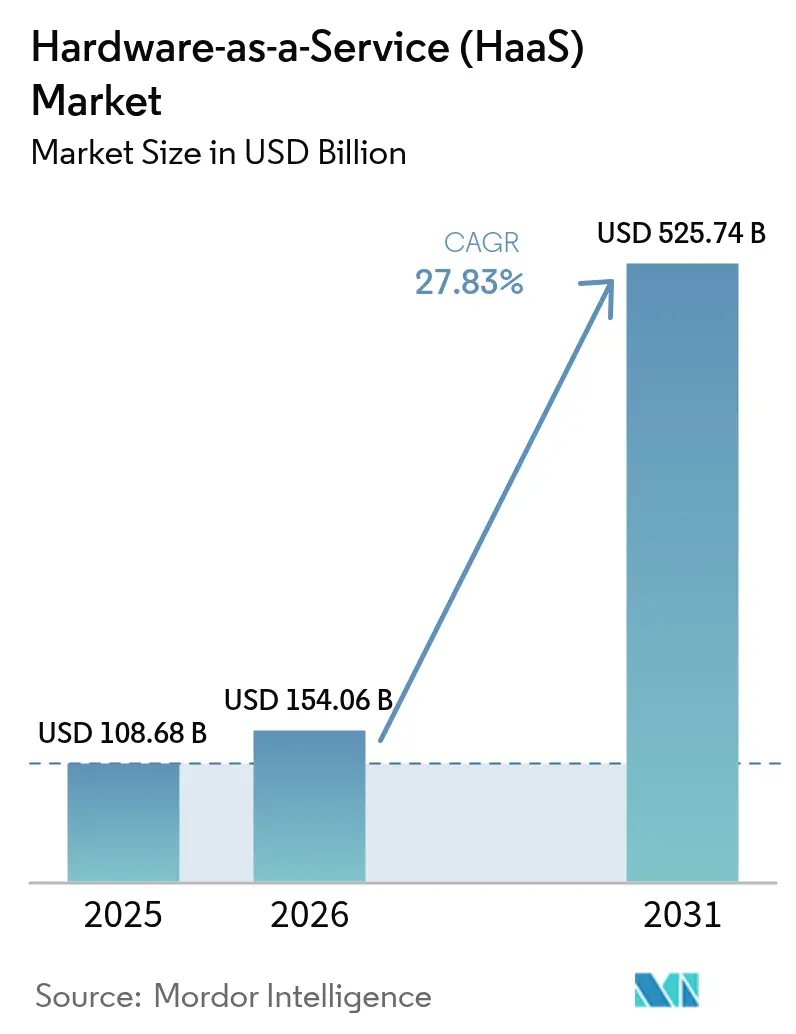
| Market Size (2026) | USD 154.06 Billion |
| Market Size (2031) | USD 525.74 Billion |
| Growth Rate (2026 - 2031) | 27.83% CAGR |
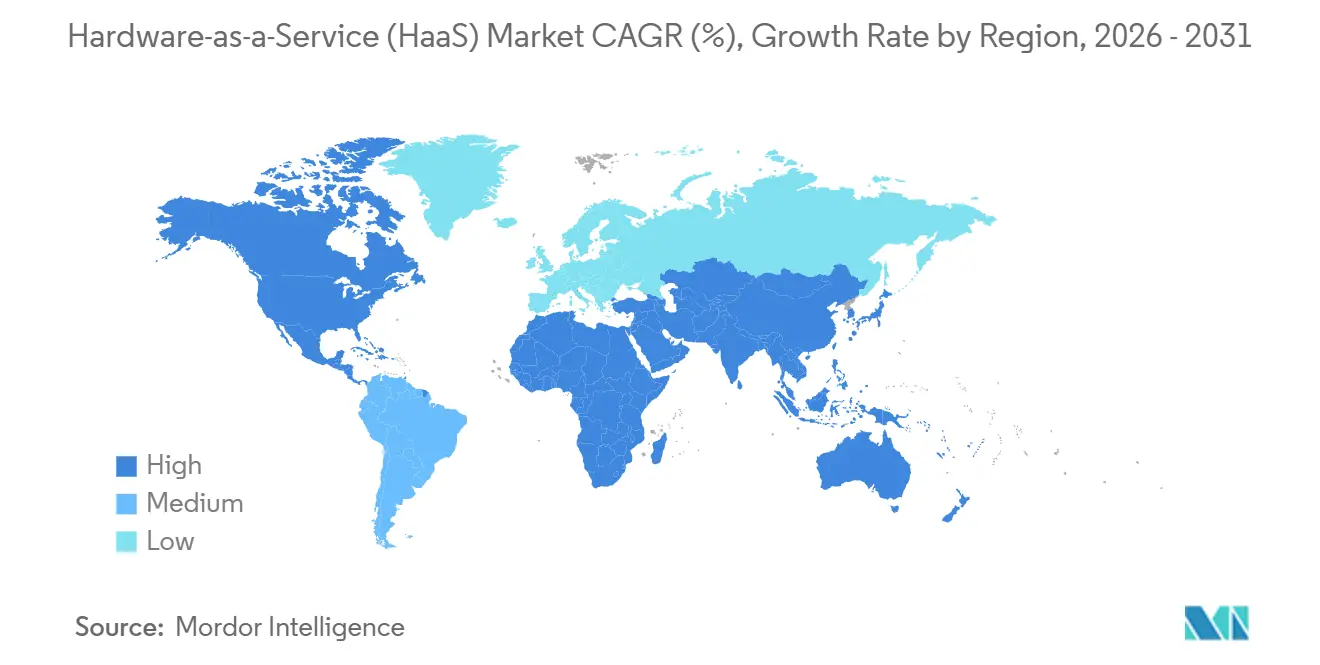
| Fastest Growing Market | Asia Pacific |
| Largest Market | North America |
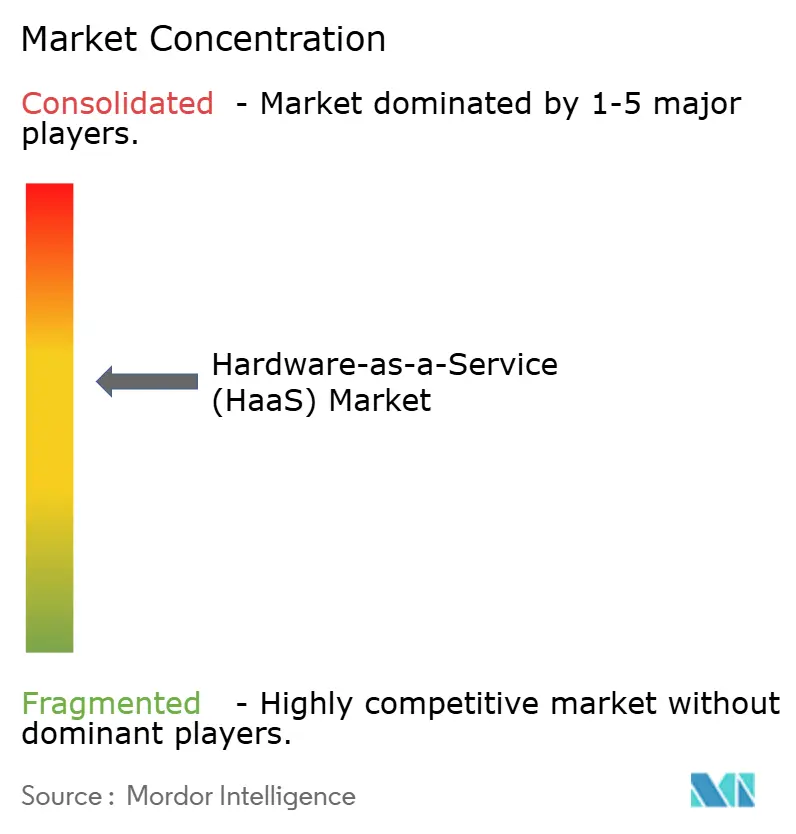
| Market Concentration | Medium |
Major Players *Disclaimer: Major Players sorted in no particular order Image © Mordor Intelligence. Reuse requires attribution under CC BY 4.0. | |
Hardware-as-a-Service (HaaS) Market Analysis by Mordor Intelligence
The Hardware-as-a-Service market size is expected to increase from USD 108.68 billion in 2025 to USD 154.06 billion in 2026 and reach USD 525.74 billion by 2031, growing at a CAGR of 27.83% over 2026-2031. Enterprises are substituting capital purchases with subscription models to conserve liquidity, a trend that gathered pace after benchmark interest rates stayed above 5.25% through mid-2024. Professional Services dominated with 65.12% revenue share in 2025, and its demand is rapidly as organizations seek on-demand access to NVIDIA H100 and AMD MI300X accelerators. Although on-premises deployments still prevailed in 2025, zero-trust mandates are funneling growth toward cloud-managed infrastructure. Competitive intensity is mounting as hyperscalers attach physical hardware subscriptions to their infrastructure-as-a-service portfolios, undermining traditional leasing economics while expanding global reach.
Key Report Takeaways
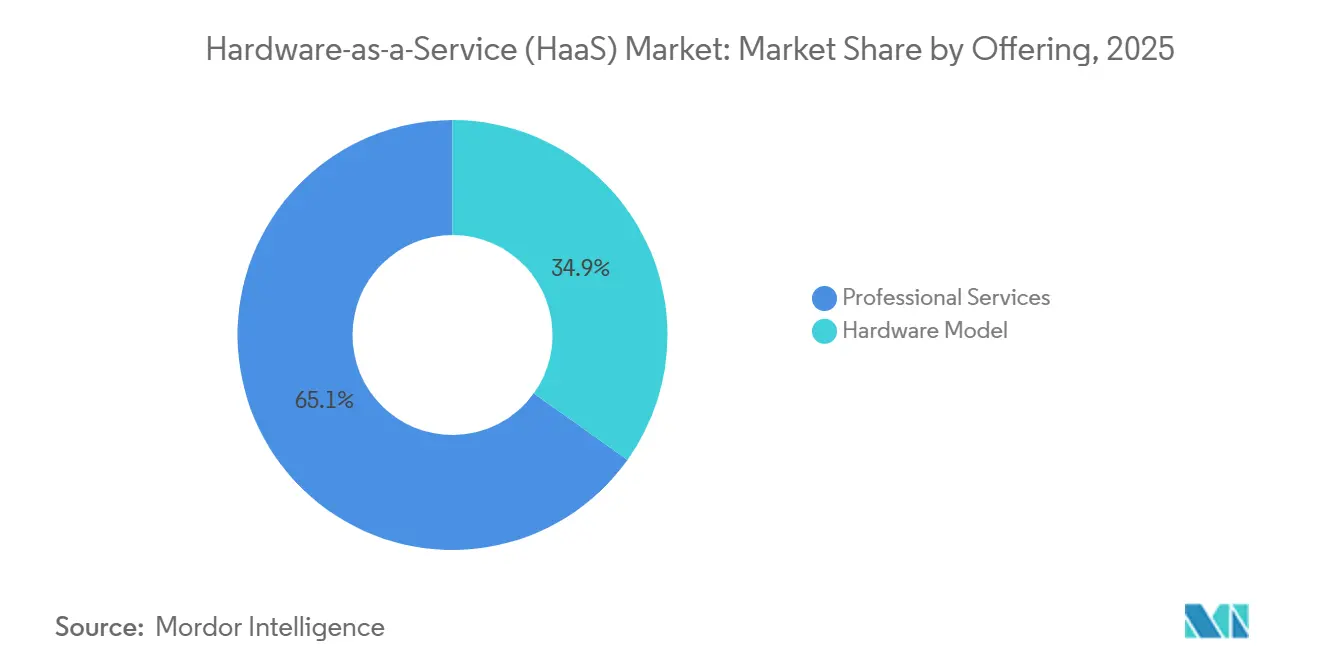
- By offering: professional services led the Hardware-as-a-Service market with 65.12% market share in 2025, and it is projected to grow at a 28.49% CAGR through 2031.
- By deployment mode, on-premises installations accounted for 58.42% of the Hardware-as-a-Service market size in 2025; cloud-managed infrastructure is projected to grow at the fastest CAGR of 27.91% to 2031.
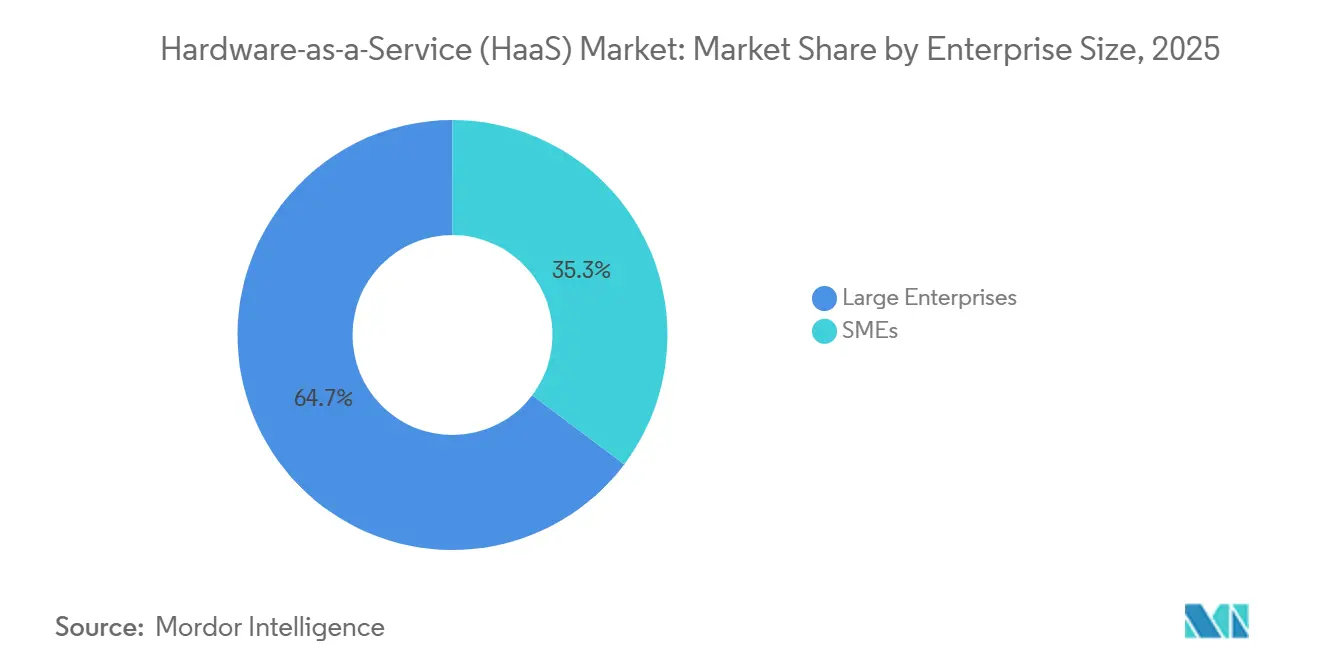
- By enterprise size, large enterprises accounted for 64.72% of spending share in 2025, whereas small and medium-sized enterprises are expanding at a 21.85% CAGR through 2031.
- By end-user industry, IT and telecommunications captured 22.42% revenue share in 2025, and healthcare and life sciences is forecast to post the highest 29.11% CAGR to 2031.
- By geography, North America held 38.91% spending share in 2025, whereas the Asia-Pacific region is expanding at a 28.23% CAGR through 2031.
Note: Market size and forecast figures in this report are generated using Mordor Intelligence’s proprietary estimation framework, updated with the latest available data and insights as of 2026.
Global Hardware-as-a-Service (HaaS) Market Trends and Insights
Driver Impact Analysis*
| Driver | (~) % Impact on CAGR Forecast | Geographic Relevance | Impact Timeline |
|---|---|---|---|
| Enterprises Shifting CapEx to OpEx Through Subscription-Based Hardware Procurement | +6.2% | Global, concentrated in North America and Europe | Medium term (2-4 years) |
| Device Lifecycle Shortening Under Hybrid-Work Security Mandates | +5.8% | North America, Europe, Asia-Pacific (Japan, South Korea, Australia) | Short term (≤ 2 years) |
| Government On-shoring Incentives Accelerating Automation via HaaS | +4.9% | United States, India, China, European Union | Long term (≥ 4 years) |
| Embedded IoT Analytics Enabling Predictive-Maintenance Contracts | +3.7% | Global, early adoption in Germany, Japan, China | Medium term (2-4 years) |
| Venture-Backed Asset-Securitization Models Unlocking Industrial HaaS | +2.4% | North America, selective Europe | Long term (≥ 4 years) |
| AI-Assisted Hardware Right-Sizing Reducing Idle Capacity | +2.1% | Global, led by cloud-native enterprises | Medium term (2-4 years) |
| Source: Mordor Intelligence | |||
Enterprises Shifting CapEx to OpEx Through Subscription-Based Hardware Procurement
Corporate finance teams increasingly favor operating-expense structures that preserve cash and improve return-on-invested-capital metrics. Elevated interest rates have raised the weighted average cost of capital, amplifying the relative advantage of pay-per-use hardware agreements. Subscription pricing also shields customers from residual-value losses, because providers remarket retired assets through refurbishment channels. Market leaders reported double-digit expansion of subscription revenue in 2025, validating the structural shift.
Device Lifecycle Shortening Under Hybrid-Work Security Mandates
Organizations, under hybrid-work policies, are now mandated to adopt stringent hardware-based security measures to safeguard their operations and data. These measures include firmware encryption, which ensures the integrity of hardware-level data, and real-time patch management, which addresses vulnerabilities as they arise. As a result, refresh intervals have been significantly reduced to approximately three years to maintain robust security standards. In 2024-2025, cyber-security directives issued by the United States and Australia necessitated the wholesale replacement of devices across millions of endpoints, further emphasizing the importance of proactive security measures.[1]U.S. Cybersecurity and Infrastructure Security Agency, “Binding Operational Directives,” cisa.gov Furthermore, HaaS contracts have evolved to meet these demands, incorporating automated swap-out clauses. These clauses are designed to activate immediately upon vendor announcements of end-of-support dates, ensuring organizations remain compliant with security requirements. This approach eliminates the risk of operational disruptions and removes the burden of unexpected capital expenditures, providing a seamless and predictable solution for hardware management.
Government On-shoring Incentives Accelerating Automation via HaaS
From the U.S. CHIPS Act to India's Production-Linked Incentive scheme, national subsidy programs aim to reward manufacturers for adopting domestically sourced equipment, thereby promoting local production capabilities.[2]U.S. Department of Commerce, “CHIPS for America Program,” commerce.gov However, capital-spending caps often restrict direct purchases of such equipment, creating challenges for manufacturers. By leveraging subscription robotics and automation, manufacturers can quickly rotate equipment without significant upfront investments. As local supply chains continue to mature, this approach enables factories to remain compliant with incentive milestones while simultaneously conserving cash for critical needs such as facility construction or maintaining working capital. This strategy not only supports operational flexibility but also aligns with the broader goals of these subsidy programs to strengthen domestic manufacturing ecosystems.
Embedded IoT Analytics Enabling Predictive-Maintenance Contracts
Vibration, thermal, and acoustic sensors embedded in hardware generate real-time data, which is then utilized to power predictive algorithms. These advanced algorithms enable providers to anticipate potential failures and pre-position necessary parts, ensuring minimal disruption. As a result, providers can now confidently guarantee uptimes exceeding 99%, offering a significant improvement in operational reliability. This transformation in operational efficiency has driven the adoption of outcome-based pricing models. Under these models, customers pay for equipment availability or throughput rather than owning the assets outright. This approach aligns with the growing demand for cost-effective and performance-driven solutions. The trend is particularly prominent in industries such as pharmaceuticals and semiconductor fabrication, where unplanned downtimes can result in penalties amounting to millions of dollars, making reliability and efficiency critical priorities.
Restraint Impact Analysis*
| Restraint | (~) % Impact on CAGR Forecast | Geographic Relevance | Impact Timeline |
|---|---|---|---|
| Vendor Lock-In and Complex Exit Terms | -3.8% | Global, acute in North America and Europe | Short term (≤ 2 years) |
| Rising Cost of Capital Compressing Provider Margins | -4.1% | Global, most severe in North America and Europe | Medium term (2-4 years) |
| Compliance Complexity From Non-Uniform Lease Accounting Rules | -2.9% | Multinational deployments spanning United States, European Union, and Asia-Pacific | Medium term (2-4 years) |
| Currency Volatility and Restricted Capital Access in Emerging Markets | -2.2% | South America, Africa, select Middle Eastern economies | Long term (≥ 4 years) |
| Source: Mordor Intelligence | |||
Vendor Lock-In and Complex Exit Terms
Proprietary management consoles and data formats, embedded in numerous contracts, significantly inflate switching costs—sometimes reaching up to 50% of the contract's remaining value. These high costs create substantial barriers for businesses looking to transition to alternative solutions. Additionally, early-termination fees, combined with mandated migration services billed at premium rates, further discourage organizations from adopting multi-vendor strategies. This lack of flexibility can stifle innovation and limit operational efficiency, particularly during mid-cycle transitions. In response to these challenges, customer advocacy groups are actively advocating for the adoption of standardized interfaces. These interfaces, aligned with Trusted Computing Group and DMTF Redfish protocols, aim to enhance interoperability and reduce the complexities associated with vendor lock-in.
Rising Cost of Capital Compressing Provider Margins
In subscription economics, providers have traditionally relied on financing hardware at rates that were lower than contract yields to sustain their business models. However, in 2024, funding costs for securitized receivables have risen significantly, surpassing the 7% threshold. This sharp increase has tightened the spreads that previously enabled aggressive pricing strategies, creating challenges for market participants. Smaller vendors, particularly those with non-investment-grade credit ratings, are now burdened with floating-rate margins ranging between 450 to 550 basis points. This financial strain has forced these vendors to confront difficult decisions, such as whether to raise prices, reduce the scope of their services, or completely exit capital-intensive sectors. These challenges highlight the growing pressures within the subscription-based business model as market dynamics continue to evolve.
*Our forecasts treat driver/restraint impacts as directional, not additive. The impact forecasts reflect baseline growth, mix effects, and variable interactions.
Segment Analysis
By Offering: GPU-as-a-Service Disrupts Traditional DaaS Economics
Professional Services contributed 65.12% to the Hardware-as-a-Service market share in 2025, supported by predictable three-year refresh cycles for laptops, desktops, and mobile devices. Moreover, it is also expanding at a 28.49% CAGR as rapid generative-AI iterations shorten useful life to as little as 18 months, making ownership uneconomical. NVIDIA DGX Cloud and AWS Trainium2 instances permit enterprises to access entire GPU clusters for monthly fees instead of a multi-million-dollar capital outlay, sidestepping depreciation risk.[3]NVIDIA Corporation, “NVIDIA DGX Cloud,” nvidia.com
Professional-services revenue is rising in tandem, because subscribers frequently require integration support for zero-trust networking or AI inference pipelines. Established DaaS providers are embedding AI-assisted right-sizing dashboards that analyze application telemetry to recommend device configurations, trimming over-provisioning and enhancing customer retention. These value-added analytics deepen switching costs and help incumbents defend share against hyperscalers moving into physical hardware subscriptions.


By Deployment Mode: Cloud-Managed Control Surges Under Zero-Trust Mandates
On-premises deployments retained 58.42% of the Hardware-as-a-Service market size in 2025, reflecting data-sovereignty rules across banking, healthcare, and defense. The rise of zero-trust security, however, is propelling cloud-managed infrastructure at a 27.91% CAGR. Platforms from Cisco and Zscaler bundle edge appliances, secure web gateways, and branch connectivity under one subscription, eliminating the operational burden of on-site configuration.
Hybrid models that split the control plane into the cloud while keeping data planes local are gaining traction for latency-sensitive workloads. HPE GreenLake for Aruba Networking exemplifies this architecture, allowing firmware updates and policy enforcement to occur off site while packets remain on premises. Benchmarking studies show that automation lowers five-year total cost of ownership by almost one-quarter relative to traditional, manually configured estates.
By Enterprise Size: SMEs Unlock Flexibility Through Modular Contracts
Large enterprises accounted for 64.72% of 2025 spending, leveraging scale to negotiate per-seat pricing that undercuts list rates by up to 40%. Providers are now unbundling services to court smaller businesses, offering 12-month agreements, self-service ordering portals, and rapid cancellation clauses. These features lower perceived risk and are lifting small and medium-sized enterprise uptake at a 21.85% CAGR.
Awareness remains a hurdle. Many SMEs undervalue hidden ownership costs such as IT labor, warranty handling, and disposal fees, sometimes overstating subscription expense relative to purchase equivalents. To close the knowledge gap, vendors now embed total-cost-of-ownership calculators and fund short-term pilots that demonstrate operational savings, converting a substantial share of trial participants into paying subscribers.
By End-User Industry: Compliance Needs Propel Healthcare Adoption
IT and telecommunications retained 22.42% revenue share in 2025, driven by edge-compute rollouts and 5G core upgrades delivered under consumption-based models. Healthcare and life sciences, however, is forecast to post the highest 29.11% CAGR through 2031 as hospitals shift MRI, laboratory automation, and electronic health-record hardware into subscriptions that bundle cybersecurity monitoring and regulatory reporting.
Manufacturing also represents a significant slice of demand, with automotive and electronics plants favoring robotics-as-a-service agreements to satisfy on-shoring mandates without inflating capital-spending ratios. Banking and retail verticals round out adoption, replacing owned ATM fleets and point-of-sale terminals with managed-service packages that fold hardware, software, and lifecycle management into a single invoice.
Geography Analysis
North America commanded 38.91% of Hardware-as-a-Service market revenue in 2025, supported by early adopter behavior and the presence of hyperscale cloud providers that bundle GPU clusters and edge appliances under subscription terms. The USD 52.7 billion CHIPS Act is further stimulating demand, as equipment suppliers pilot subscription models for semiconductor fabrication tools to align with domestic-content requirements. Canada’s federal zero-trust mandate, effective March 2026, is driving fleet replacements across hundreds of thousands of public-sector endpoints, while Mexico’s nearshoring boom is nudging manufacturers toward robotics-as-a-service to sidestep cross-border import duties.
Asia-Pacific exhibits the fastest expansion, advancing at a 28.23% CAGR to 2031. India’s USD 10 billion Production-Linked Incentive program and China’s “Made in China 2025” policy both stipulate high domestic-content thresholds that favor subscription hardware capable of rapid swaps as local supply chains mature. Japan’s Digital Agency allocated JPY 4.5 trillion (USD 30 billion) for cloud migration initiatives, and more than half of funded projects now feature HaaS contracts to avoid up-front payments. South Korea’s semiconductor champions are similarly piloting equipment-as-a-service to preserve cash amid multi-hundred-billion-dollar fab expansions.
Europe holds moderate share, with Germany, the United Kingdom, France, and Italy adopting subscriptions in automotive and finance. The European Commission’s Digital Decade objectives, requiring 75% enterprise cloud and AI usage by 2030, sharpen the economic rationale for HaaS. Middle East and Africa demand is concentrated in smart-city and government digitalization schemes, notably Saudi Arabia’s Vision 2030, which earmarks SAR 500 billion (USD 133 billion) for technology investments, 28% structured as operating expenses. South America and key African economies are emerging opportunities, though limited access to low-cost capital and currency volatility constrain provider expansion.

Competitive Landscape
The Hardware-as-a-Service market remains moderately fragmented: the ten largest vendors controlled roughly 48% revenue in 2025, and no single participant exceeded a 12% share. Dell Technologies, HP Inc., and Lenovo Group lead Device-as-a-Service through direct sales and deep channel partnerships. Hyperscalers, Amazon Web Services, Microsoft Azure, and Google Cloud, are scaling GPU-as-a-Service and edge-infrastructure bundles that combine hardware subscriptions with cloud credits, tempering OEM leverage over enterprise budgets.
Distributors such as Arrow Electronics and Ingram Micro are moving away from one-time product sales toward lifecycle-management platforms that fuse financing, asset tracking, and end-of-life buyback into recurring contracts. Arrow’s as-a-service bookings jumped 64% year over year in 2025, reaching USD 1.8 billion in annual contract value as customers embraced unified agreements. Specialized entrants are exploiting white-space niches: Formic Technologies prices robotics subscriptions per part produced, while Zscaler packages networking hardware and zero-trust security into a per-user fee, eliminating multi-vendor integration challenges for branch modernization.
AI-driven optimization is an emerging differentiator. Platforms that monitor application usage, device performance, and user behavior can right-size configurations, slash idle capacity, and recycle underutilized assets to alternate subscribers. This capability improves provider margins and cements customer loyalty, reinforcing a virtuous cycle of data-driven product refinement.
Hardware-as-a-Service (HaaS) Industry Leaders
Dell Technologies Inc.
HP Inc.
Lenovo Group Limited
Fujitsu Limited
Microsoft Corporation
- *Disclaimer: Major Players sorted in no particular order

Recent Industry Developments
- February 2026: Intel secured USD 8.5 billion in CHIPS Act grants plus USD 11 billion in federal loans for fabs across four U.S. states; equipment suppliers are piloting subscription models for deposition and etch tools to help Intel meet domestic-content rules.
- January 2026: Microsoft deployed 50,000 NVIDIA H200 GPUs across 12 regions, introducing GPU-as-a-Service instances priced at USD 42,000 per month for eight-GPU bundles.
- December 2025: Zscaler surpassed 4,200 enterprise customers on its Zero Trust Exchange, with 58% opting for branch-office SD-WAN appliances under subscription rather than outright purchase.
- November 2025: Amazon Web Services released Trainium2 instances, offering transformer-model training at 40% lower cost than comparable H100 configurations under consumption pricing.


Global Hardware-as-a-Service (HaaS) Market Report Scope
Hardware belonging to a managed service provider (MSP) is deployed at a customer's location as part of the hardware-as-a-service (HaaS) procurement model, comparable to leasing or licensing. A service level agreement (SLA) outlines the obligations of both parties.
The Hardware-as-a-Service Market Report is Segmented by Offering (Hardware Model, and Professional Services), Deployment Mode (On-Premises, Cloud-Managed, and Hybrid/Network-as-a-Service), Enterprise Size (Large Enterprises, and Small and Medium-Sized Enterprises), End-User Industry (Retail and Wholesale, Education, BFSI, Manufacturing, and More), and Geography. The Market Forecasts are Provided in Terms of Value (USD).
| Hardware Model |
| Professional Services |
| On-Premises |
| Cloud-Managed |
| Hybrid / Network-as-a-Service |
| Large Enterprises |
| Small and Medium-Sized Enterprises |
| Retail and Wholesale |
| Education |
| Banking, Financial Services and Insurance |
| Manufacturing |
| Healthcare and Life Sciences |
| IT and Telecommunications |
| Government and Public Sector |
| Other Industries |
| North America | United States |
| Canada | |
| Mexico | |
| South America | Brazil |
| Argentina | |
| Rest of South America | |
| Europe | Germany |
| United Kingdom | |
| France | |
| Italy | |
| Spain | |
| Rest of Europe | |
| Asia-Pacific | China |
| India | |
| Japan | |
| South Korea | |
| Australia and New Zealand | |
| Rest of Asia-Pacific | |
| Middle East | Saudi Arabia |
| United Arab Emirates | |
| Turkey | |
| Rest of Middle East | |
| Africa | South Africa |
| Nigeria | |
| Egypt | |
| Rest of Africa |
| By Offering | Hardware Model | |
| Professional Services | ||
| By Deployment Mode | On-Premises | |
| Cloud-Managed | ||
| Hybrid / Network-as-a-Service | ||
| By Enterprise Size | Large Enterprises | |
| Small and Medium-Sized Enterprises | ||
| By End-User Industry | Retail and Wholesale | |
| Education | ||
| Banking, Financial Services and Insurance | ||
| Manufacturing | ||
| Healthcare and Life Sciences | ||
| IT and Telecommunications | ||
| Government and Public Sector | ||
| Other Industries | ||
| By Geography | North America | United States |
| Canada | ||
| Mexico | ||
| South America | Brazil | |
| Argentina | ||
| Rest of South America | ||
| Europe | Germany | |
| United Kingdom | ||
| France | ||
| Italy | ||
| Spain | ||
| Rest of Europe | ||
| Asia-Pacific | China | |
| India | ||
| Japan | ||
| South Korea | ||
| Australia and New Zealand | ||
| Rest of Asia-Pacific | ||
| Middle East | Saudi Arabia | |
| United Arab Emirates | ||
| Turkey | ||
| Rest of Middle East | ||
| Africa | South Africa | |
| Nigeria | ||
| Egypt | ||
| Rest of Africa | ||


Key Questions Answered in the Report
How fast is spending on subscription hardware growing worldwide?
Global Hardware-as-a-Service revenue is forecast to climb from USD 154.06 billion in 2026 to USD 525.74 billion by 2031, reflecting a 27.83% CAGR.
Why are organizations replacing owned devices with subscription models now?
Elevated interest rates and zero-trust security mandates make pay-as-you-go hardware more attractive than capital purchases, while providers absorb obsolescence and upkeep risk.
Which deployment model is gaining ground the quickest?
Cloud-managed Hardware-as-a-Service subscriptions are projected to expand at a 27.91% CAGR because centralized policy engines are essential for zero-trust enforcement.
How are small and medium-sized businesses approaching Hardware-as-a-Service?
SMEs are adopting modular 12-month contracts with self-service portals, pushing their segment to a 21.85% CAGR as awareness of lifecycle cost savings improves.
Page last updated on:


