Green IT Services Market Size and Share
Market Overview
| Study Period | 2020 - 2031 |
|---|---|
| Market Size (2026) | USD 38.86 Billion |
| Market Size (2031) | USD 94.65 Billion |
| Growth Rate (2026 - 2031) | 19.48% CAGR |
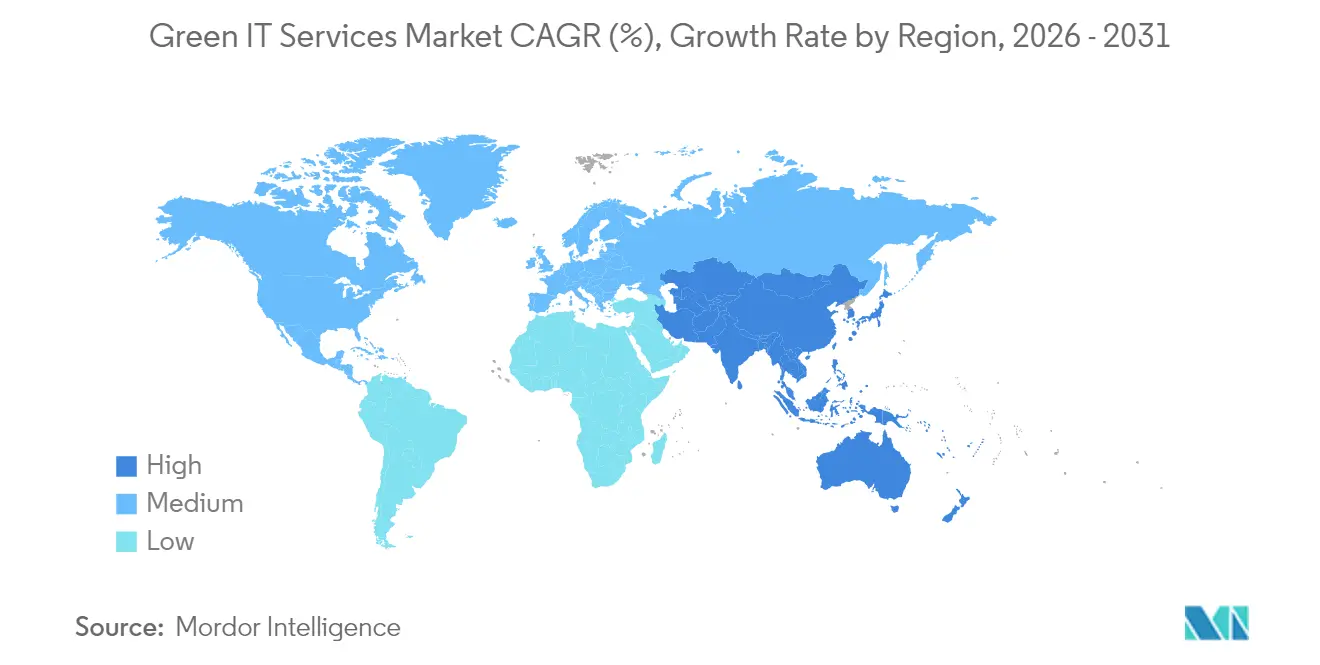
| Fastest Growing Market | Asia Pacific |
| Largest Market | North America |
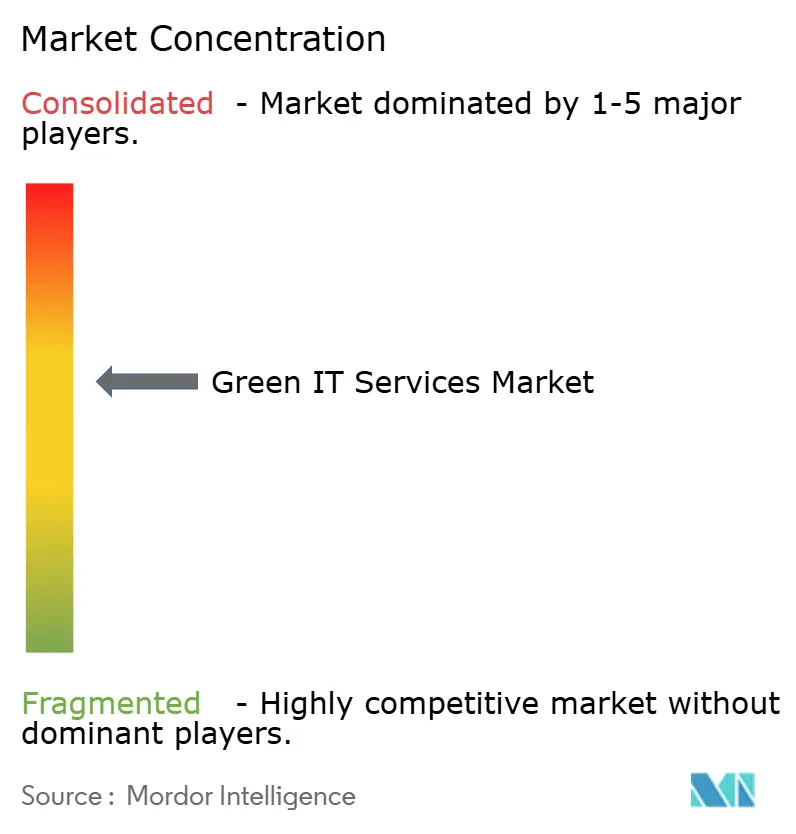
| Market Concentration | Medium |
Major Players *Disclaimer: Major Players sorted in no particular order Image © Mordor Intelligence. Reuse requires attribution under CC BY 4.0. | |
Green IT Services Market Analysis by Mordor Intelligence
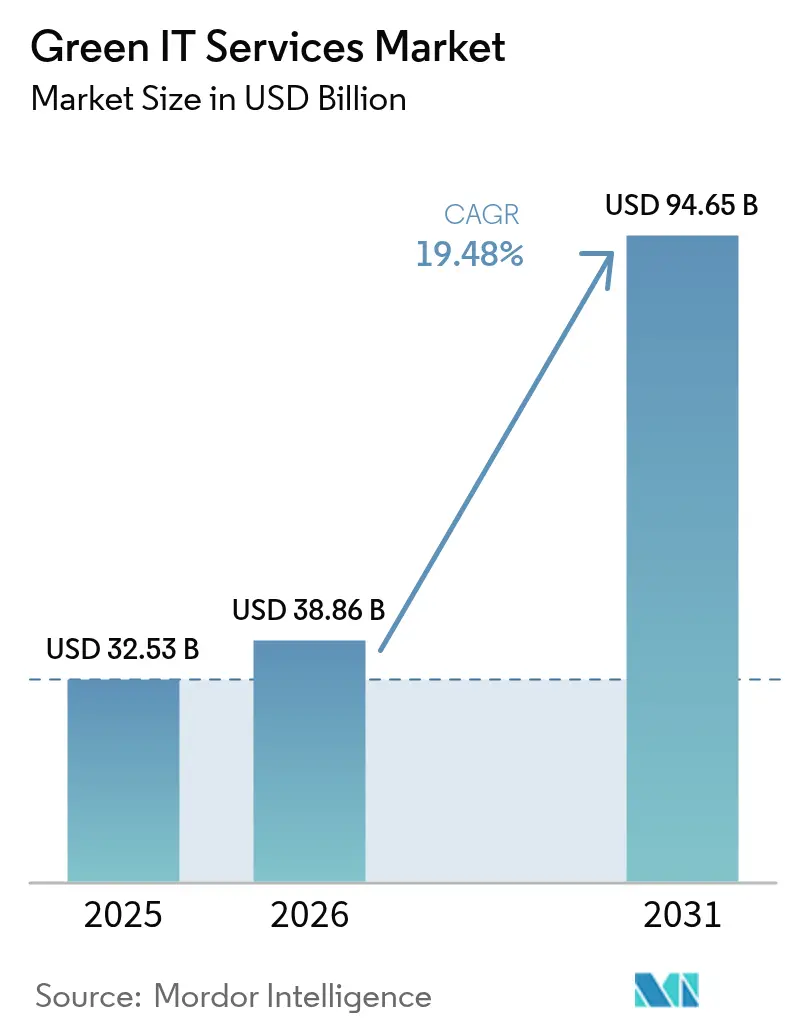
Green IT services market size in 2026 is estimated at USD 38.86 billion, growing from 2025 value of USD 32.53 billion with 2031 projections showing USD 94.65 billion, growing at 19.48% CAGR over 2026-2031. Growing corporate net-zero mandates, escalating electricity prices, and tightening emissions disclosure rules are reshaping enterprise IT procurement toward sustainable solutions. Hyperscale cloud providers are accelerating renewable power purchase agreements that ripple across enterprise supply chains, while AI-driven data-center optimization platforms shorten payback periods and improve workload efficiency. Governments in North America and the EU are introducing mandatory Scope 1-3 reporting that transforms green IT from optional to indispensable compliance infrastructure. Together, these forces spur service providers to expand carbon-intelligent offerings and drive innovation in multi-cloud carbon accounting.
Key Report Takeaways
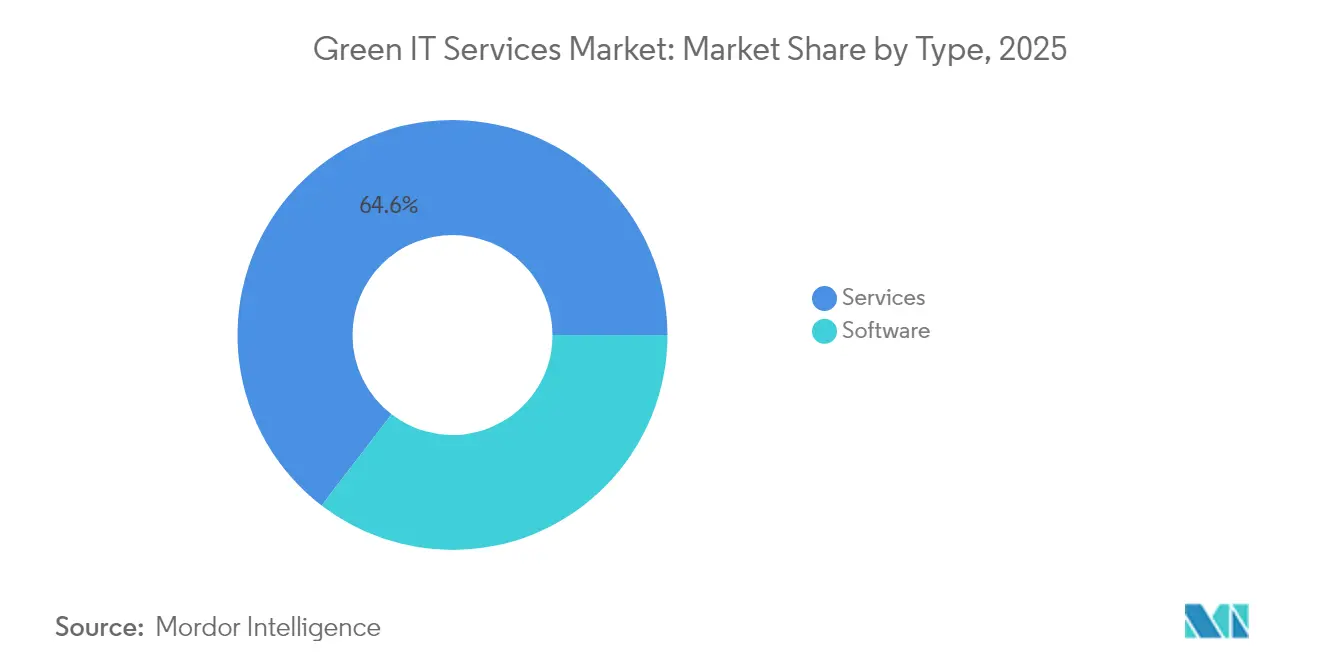
- By type, services held 64.58% of the Green IT services market share in 2025; software is projected to grow at a 20.71% CAGR through 2031.
- By deployment model, cloud accounted for 50.15% revenue share of the Green IT services market in 2025, while hybrid is forecast to expand at 20.88% CAGR to 2031.
- By organization size, large enterprises captured a 69.62% share of the Green IT services market size in 2025; yet, SMEs are poised for a 22.05% CAGR between 2026 and 2031.
- By service area, data-center optimization led with a 31.94% share of the Green IT services market in 2025; asset and infrastructure management is projected to advance at a 21.72% CAGR through 2031.
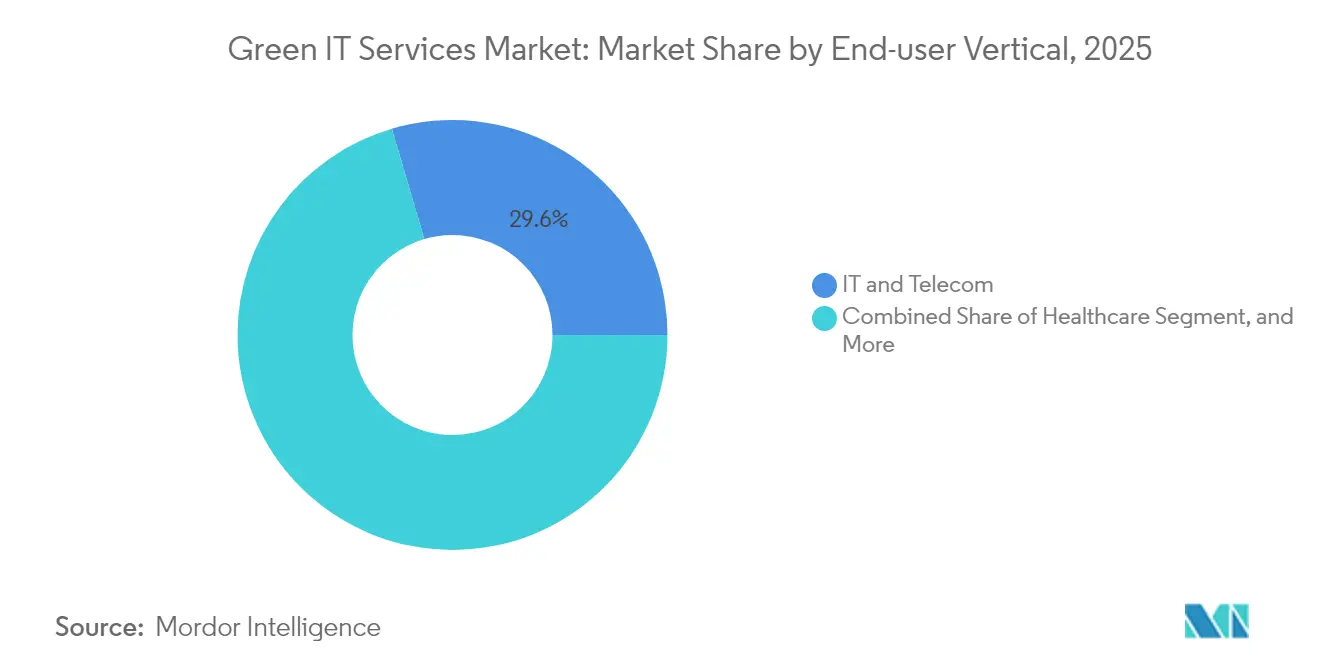
- By end-user vertical, IT and telecom generated 29.55% of the 2025 revenue of the Green IT services market; healthcare is expected to exhibit the fastest growth, with a 21.52% CAGR to 2031.
- By geography, North America accounted for 38.02% of the 2025 revenue of the Green IT services market, whereas the Asia-Pacific region is expected to post a 22.68% CAGR during the forecast period.
Note: Market size and forecast figures in this report are generated using Mordor Intelligence’s proprietary estimation framework, updated with the latest available data and insights as of 2026.
Global Green IT Services Market Trends and Insights
Drivers Impact Analysis*
| Driver | (~) % Impact on CAGR Forecast | Geographic Relevance | Impact Timeline |
|---|---|---|---|
| Growing Corporate Net-Zero Targets | +4.20% | Global, with concentration in North America and EU | Medium term (2-4 years) |
| Rising Energy Costs Increasing ROI on Green IT | +3.80% | Global, particularly Europe and Asia-Pacific | Short term (≤ 2 years) |
| Strengthening Government Regulations on IT Emissions | +3.50% | North America and EU, expanding to APAC | Long term (≥ 4 years) |
| Rapid Growth of Hyperscale DCs adopting Renewable PPAs | +3.10% | Global, led by North America and Europe | Medium term (2-4 years) |
| AI-Driven Real-Time Optimization | +2.90% | Global, early adoption in developed markets | Short term (≤ 2 years) |
| EU Digital Product Passport Mandates | +2.10% | Europe, with spillover to global supply chains | Long term (≥ 4 years) |
| Source: Mordor Intelligence | |||
Growing Corporate Net-Zero Targets
More than 70% of Fortune 500 companies have committed to achieving carbon neutrality by 2030, prompting CIOs to embed sustainability metrics into their IT purchasing criteria. Financial institutions are deepening the trend; JPMorgan Chase has pledged USD 2.5 trillion for sustainable finance, prompting internal IT teams to favor carbon-efficient architectures.[1]JPMorgan Chase, “Sustainable Finance Commitment,” Jpmorganchase.com Linking executive compensation to emissions reductions intensifies demand for measurable green IT outcomes, positioning sustainability platforms as strategic enablers rather than discretionary spend. As firms harmonize ESG frameworks with digital roadmaps, service providers that integrate emissions analytics into existing stacks gain a competitive edge. The influence is expected to peak over the next three years as reporting cycles formalize and penalties for non-compliance escalate.
Rising Energy Costs Accelerate ROI Calculations
European commercial power prices were 40% higher in 2024 versus pre-2022 averages, converting green IT from an ethical pursuit to a financial imperative. Enterprises such as Deutsche Bank have realized USD 15 million in annual savings after deploying AI-based thermal management, which paid back in under 18 months.[2]Deutsche Bank, “Annual Report 2024,” Db.com Parallel carbon-pricing regimes, including the EU ETS at USD 80-100 per ton CO₂e, widen the cost gap between efficient and legacy infrastructure. As volatility persists, CFOs are now quantifying sustainability projects through net-present-value lenses, propelling the rapid adoption of workload orchestration software that reduces megawatt hours consumed. The near-term payoff re-orders IT capital-allocation priorities toward low-carbon assets.
Strengthening Government Regulations Create Compliance-Driven Demand
The EU Corporate Sustainability Reporting Directive will require over 50,000 companies to disclose their IT emissions from 2025 onward, converting green IT solutions into regulatory requirements.[3]European Commission, “Corporate Sustainability Reporting Directive,” Europa.eu Similarly, proposed SEC rules in the United States require Scope 1-3 disclosure, whereas China’s dual-control policy constrains energy intensity in heavy industry sectors. These mandates heighten demand for automated carbon-accounting platforms capable of harmonizing data across multi-cloud estates. Providers with auditable, standards-aligned reporting modules position themselves as key enablers of continuous compliance. Market momentum is expected to remain strong beyond 2028 as additional jurisdictions finalize climate disclosure statutes.
Rapid Growth of Hyperscale Data Centers Adopting Renewable PPAs
Amazon Web Services contracted more than 20 GW of renewable capacity by 2024, catalyzing grid-scale clean-energy projects that shrink the marginal costs of renewables for downstream enterprise clients. Microsoft’s collaboration with Constellation to revive the Three Mile Island nuclear facility underscores hyperscalers’ commitment to carbon-free baseload power.[4]Microsoft Corporation, “Microsoft and Constellation Restart Three Mile Island,” News.microsoft.com These mega-procurements prompt utilities to modernize their grids and offer green tariffs that are attractive to enterprises migrating their workloads. Service providers increasingly bundle renewable PPAs and optimization software, enabling even mid-sized firms to access clean power ecosystems built by hyperscalers.
Restraints Impact Analysis*
| Restraint | (~) % Impact on CAGR Forecast | Geographic Relevance | Impact Timeline |
|---|---|---|---|
| High Up-front Capex for Green IT Infrastructure | -2.80% | Global, particularly impacting SMEs | Short term (≤ 2 years) |
| Lack of Skilled Workforce | -2.30% | Global, acute in developing markets | Medium term (2-4 years) |
| Embedded-Carbon Accounting Complexity in Multi-cloud | -1.90% | Global, concentrated in enterprise segment | Medium term (2-4 years) |
| Intermittent Renewable Supply vs IT Load Variability | -1.60% | Regions with high renewable penetration | Long term (≥ 4 years) |
| Source: Mordor Intelligence | |||
High Capital Requirements Create Adoption Barriers
Energy-efficient servers cost 20-30% more than conventional models, while mid-sized data center retrofits can require USD 5-10 million, which can strain SME budgets.[5]Schneider Electric, “Data Center Solutions,” Se.com Limited access to sustainability-linked financing elevates hurdle rates, delaying refresh cycles. Cloud-based subscription services partially offset the burden, yet many organizations still struggle to allocate capital for holistic modernization. As interest-rate environments normalize and green-bond markets mature, financing innovations are expected to moderate this constraint.
Workforce Skills Gap Constrains Implementation Velocity
Sustainability-oriented IT roles command salary premiums of 25-40%, and supply remains thin, especially in emerging economies.[6]Robert Half, “Technology Salary Guide 2024,” Roberthalf.com The scarcity of professionals proficient in carbon accounting, renewable integration, and AI-powered optimization slows project timelines and increases consulting costs. Large vendors are launching academy programs, but curriculum pipelines will need several years to balance demand. Until talent pools broaden, deployment velocity in many regions will lag market potential.
*Our forecasts treat driver/restraint impacts as directional, not additive. The impact forecasts reflect baseline growth, mix effects, and variable interactions.
Segment Analysis
By Type: Services Dominate, Software Accelerates
Services commanded a 64.58% share of the Green IT services market in 2025, underscoring enterprises’ reliance on consulting-led engagements for sustainability roadmap development. The services category encompasses advisory, integration, and managed operations that tackle complex legacy estates spanning on-premise, cloud, and edge environments. Players like Accenture have deepened their expertise through the acquisition of carbon analytics boutiques, reinforcing their capability breadth. Software, however, is surging at a 20.71% CAGR as standardized SaaS platforms automate emissions tracking and enable rapid scalability. Subscriptions lower entry barriers for SMEs, broaden the addressable demand, and gradually shift the revenue mix toward recurring licenses across the forecast horizon.
Software’s ascent is also fueled by hyperscaler ecosystems that embed carbon-intelligent APIs into DevOps pipelines, thereby shrinking deployment cycles from months to weeks. Early adopters highlight improved auditability and predictive analytics that align IT capacity with renewable generation windows. As regulatory reporting templates converge, software modules that offer pre-populated compliance formats will capture incremental spend, narrowing but not erasing the services lead.


By Deployment Model: Cloud Leads While Hybrid Gains
Cloud deployments accounted for 50.15% of revenue in 2025 as enterprises leveraged hyperscalers’ renewable power footprints and economy-of-scale efficiencies. The Green IT services market size for cloud workloads reached USD 16.32 billion in 2025, reflecting widespread migration of compute-intensive tasks to carbon-optimal regions. Yet hybrid architectures record the fastest 20.88% CAGR, balancing data sovereignty and latency needs with sustainability objectives.
Hybrid strategies typically retain sensitive workloads in on-premise footprints while offloading analytics and AI functions to green cloud zones. Pharmaceutical firms exemplify this approach, leveraging local data centers for intellectual property security and cloud analytics for carbon optimization. On-premise deployments persist in regulated verticals, such as defense, although their share gradually declines as energy-efficient equipment and microgrid integrations improve economics.
By Organization Size: SME Adoption Accelerates
Large enterprises accounted for 69.62% of the revenue in 2025 due to their expansive IT estates and mandatory disclosure regimes. These organizations frequently engage in multi-year transformation programs that bundle consulting, software, and renewable sourcing. However, SMEs post the strongest 22.05% CAGR, benefiting from pay-as-you-go SaaS platforms that democratize sophisticated carbon accounting.
Vendors courting SMEs emphasize low-code configurability and marketplace integrations that seamlessly integrate with existing accounting and ERP systems. Subscription tiers, priced per device or per ton of CO₂e, allow businesses to scale their maturity at a manageable cost. While absolute spending remains lower than in Fortune 500 accounts, the volume of SME clients widens the total addressable base and diversifies revenue streams for providers.

By Service Area: Infrastructure Focus Shifts Toward Asset Management
Data-center optimization accounted for 31.94% of revenue in 2025, reflecting the concentration of enterprise energy consumption in centralized facilities. Real-time thermal analytics, liquid cooling, and AI-driven workload placement underpin energy savings of 20-40% in case studies. Asset and infrastructure management, though smaller, is expanding at 21.72% CAGR as organizations extend sustainability oversight across server fleets, network gear, and edge devices.
Lifecycle platforms integrate procurement, utilization, and end-of-life processes, addressing emerging Scope 3 requirements that demand visibility into embodied carbon. IBM’s acquisition of Envizi signals a strategic pivot toward holistic asset oversight that transcends facility walls. Consulting and integration services combine disparate data sources into unified dashboards, a prerequisite for gaining meaningful insights into emissions.
By End-user Vertical: Healthcare Accelerates Digital Sustainability
IT and telecom captured 29.55% of 2025 spending, driven by heavy compute loads and early adopter cultures. Yet, healthcare advances at a 21.52% CAGR, propelled by the expansion of telehealth and stringent operational efficiency targets. Hospitals deploying AI-based HVAC optimization report 15% declines in power use, validating fast ROI.
Regulatory incentives, such as the U.S. Department of Health and Human Services’ net-zero pledge, amplify demand for carbon-aware cloud electronic medical record systems. Government, BFSI, and industrial customers remain sizeable, focusing investments on facility retrofits and circular hardware programs that dovetail with broader decarbonization agendas.
Geography Analysis
North America generated 38.02% of 2025 revenue, underpinned by Environmental Protection Agency guidelines that limit federal agency data center emissions and by voluntary corporate science-based targets. Tax credits in the Inflation Reduction Act lower capital costs for clean energy integration, bolstering uptake among medium-sized enterprises. U.S. multinationals leverage established renewable energy certificate markets, simplifying compliance and supporting export competitiveness.
Europe represents a mature yet expanding opportunity, where high electricity tariffs sharpen ROI on efficiency upgrades. The EU Digital Product Passport and CSRD compel detailed reporting on IT hardware provenance and emissions, driving demand for granular traceability solutions. Vendor differentiation increasingly hinges on EU taxonomy alignment and ISO 14064 verification services. Eastern European member states receive Cohesion Fund allocations earmarked for sustainable digital infrastructure, broadening regional adoption.
Asia-Pacific posts the fastest 22.68% CAGR to 2031. China’s carbon-neutrality manifesto and energy-intensity caps trigger accelerated modernization of legacy data centers, while India’s renewable auctions and production incentives attract hyperscale investments. Japan’s USD 150 billion Green Transformation program subsidizes low-carbon computing, and Australia’s Safeguard Mechanism tightens baselines for large emitters, including cloud facilities. South America and the Middle East & Africa remain emergent; foreign direct investment in smart-city and fintech projects catalyzes localized demand, though policy frameworks are still coalescing.

Competitive Landscape
Global leadership is moderately fragmented. IBM, Accenture, and Capgemini leverage broad delivery footprints and cross-industry relationships to upsell sustainability modules embedded in existing managed-service contracts. IBM’s USD 200 million purchase of Envizi augmented AI-powered ESG data management, enabling bundled consulting plus software propositions. Accenture’s Avieco acquisition complements its Green Software Engineering practice, signaling focus on application-level efficiency. Capgemini’s Sustainability Technology Center in India demonstrates cost-effective R&D scaling to support global clients.
Specialist vendors such as Accuvio, Dakota Software, and Sphera capitalize on deep domain algorithms that automate Scope 3 calculations, often white-labeled by larger integrators. Start-ups targeting dynamic workload orchestration in carbon-optimized zones lure venture capital, intensifying innovation cycles. Patent filings in sustainable computing climbed 35% in 2024, indicating heightened barriers to imitation and a race to secure intellectual property.
Competition hinges on the ability to integrate real-time telemetry with prescriptive analytics, aligning compute demand with renewable availability. Certification expertise in ISO 14001 and ISO 50001 is becoming a table-stakes qualifier for request-for-proposal shortlists, while vendor marketplaces now showcase emissions dashboards alongside traditional performance metrics. Consulting pedigrees, platform interoperability, and finance-partner ecosystems increasingly determine deal wins as clients seek turnkey decarbonization pathways.
Green IT Services Industry Leaders
IBM Corporation
SAP SE
Accenture PLC
Schneider Electric SE
Johnson Controls International plc
- *Disclaimer: Major Players sorted in no particular order

Recent Industry Developments
- October 2024: Microsoft announced a USD 3 billion investment in sustainable AI infrastructure, aiming to build carbon-negative data centers powered solely by renewables.
- September 2024: IBM completed the USD 200 million Envizi ESG Suite acquisition, integrating advanced analytics to expand environmental intelligence services.
- August 2024: Accenture launched its Green Software Engineering practice with a USD 150 million talent and platform investment.
- July 2024: Amazon Web Services has completed a 500-MW Texas solar farm, costing USD 1.2 billion, to supply multiple data-center regions with 100% renewable power.


Global Green IT Services Market Report Scope
Green IT, also called green computing, is the study where the resources are used efficiently. It helps the manufacturers and encourages IT departments (in government, BFSI, industrial, and others) to produce environment-friendly products and to consider more virtualization, power management, and proper recycling habits.
The Green IT Services Market is segmented by Type (Software, Service), End-user Vertical (Government, BFSI, IT, and Telecom, Industrial, Healthcare), and Geography. The market sizes and forecasts are provided in terms of value (USD million) for all the above segments.
| Software |
| Services |
| On-Premise |
| Cloud |
| Hybrid |
| Large Enterprises |
| Small and Medium Enterprises (SMEs) |
| Data Center Optimization |
| Workplace and End-user Services |
| Asset and Infrastructure Management |
| Consulting and Integration |
| Enterprise Resource Planning |
| Government |
| Banking, Financial Services and Insurance (BFSI) |
| IT and Telecom |
| Industrial |
| Healthcare |
| Other End-user Verticals |
| North America | United States | |
| Canada | ||
| Mexico | ||
| South America | Brazil | |
| Argentina | ||
| Rest of South America | ||
| Europe | Germany | |
| United Kingdom | ||
| France | ||
| Italy | ||
| Spain | ||
| Russia | ||
| Rest of Europe | ||
| Asia-Pacific | China | |
| Japan | ||
| India | ||
| South Korea | ||
| Rest of Asia-Pacific | ||
| Middle East and Africa | Middle East | Saudi Arabia |
| United Arab Emirates | ||
| Turkey | ||
| Rest of Middle East | ||
| Africa | South Africa | |
| Nigeria | ||
| Rest of Africa | ||
| By Type | Software | ||
| Services | |||
| By Deployment Model | On-Premise | ||
| Cloud | |||
| Hybrid | |||
| By Organization Size | Large Enterprises | ||
| Small and Medium Enterprises (SMEs) | |||
| By Service Area | Data Center Optimization | ||
| Workplace and End-user Services | |||
| Asset and Infrastructure Management | |||
| Consulting and Integration | |||
| Enterprise Resource Planning | |||
| By End-user Vertical | Government | ||
| Banking, Financial Services and Insurance (BFSI) | |||
| IT and Telecom | |||
| Industrial | |||
| Healthcare | |||
| Other End-user Verticals | |||
| By Geography | North America | United States | |
| Canada | |||
| Mexico | |||
| South America | Brazil | ||
| Argentina | |||
| Rest of South America | |||
| Europe | Germany | ||
| United Kingdom | |||
| France | |||
| Italy | |||
| Spain | |||
| Russia | |||
| Rest of Europe | |||
| Asia-Pacific | China | ||
| Japan | |||
| India | |||
| South Korea | |||
| Rest of Asia-Pacific | |||
| Middle East and Africa | Middle East | Saudi Arabia | |
| United Arab Emirates | |||
| Turkey | |||
| Rest of Middle East | |||
| Africa | South Africa | ||
| Nigeria | |||
| Rest of Africa | |||


Key Questions Answered in the Report
What is the forecast CAGR for Green IT services between 2026 and 2031?
Spending is projected to rise at a 19.48% CAGR, expanding from USD 38.86 billion in 2026 to USD 94.65 billion by 2031.
Which region is expected to record the fastest revenue expansion through 2031?
Asia-Pacific is set to lead with a 22.68% CAGR as China's carbon-neutrality targets and India's renewable build-out accelerate sustainable IT investments.
How are small and medium enterprises adopting sustainable IT solutions?
SMEs are turning to subscription-based SaaS platforms that bundle carbon tracking and optimization, enabling 22.05% CAGR growth without large upfront capital.
Why are hyperscale cloud providers critical to the shift toward carbon-efficient computing?
Their multi-gigawatt renewable power purchase agreements lower clean-energy costs and let enterprises run workloads on carbon-free infrastructure already built by providers such as Amazon Web Services and Microsoft.
What main regulations are pushing organizations to invest in emissions-focused IT upgrades?
The EU Corporate Sustainability Reporting Directive and proposed U.S. SEC climate-disclosure rules mandate detailed Scope 1-3 reporting, making automated carbon-accounting tools indispensable.
What cost-related barrier still limits green IT uptake for many organizations?
Energy-efficient servers and data-center retrofits carry 20-30% price premiums and can require USD 5-10 million per mid-size facility, delaying adoption for cash-constrained firms.
Page last updated on:


