Market Overview
| Study Period | 2021 - 2031 |
|---|---|
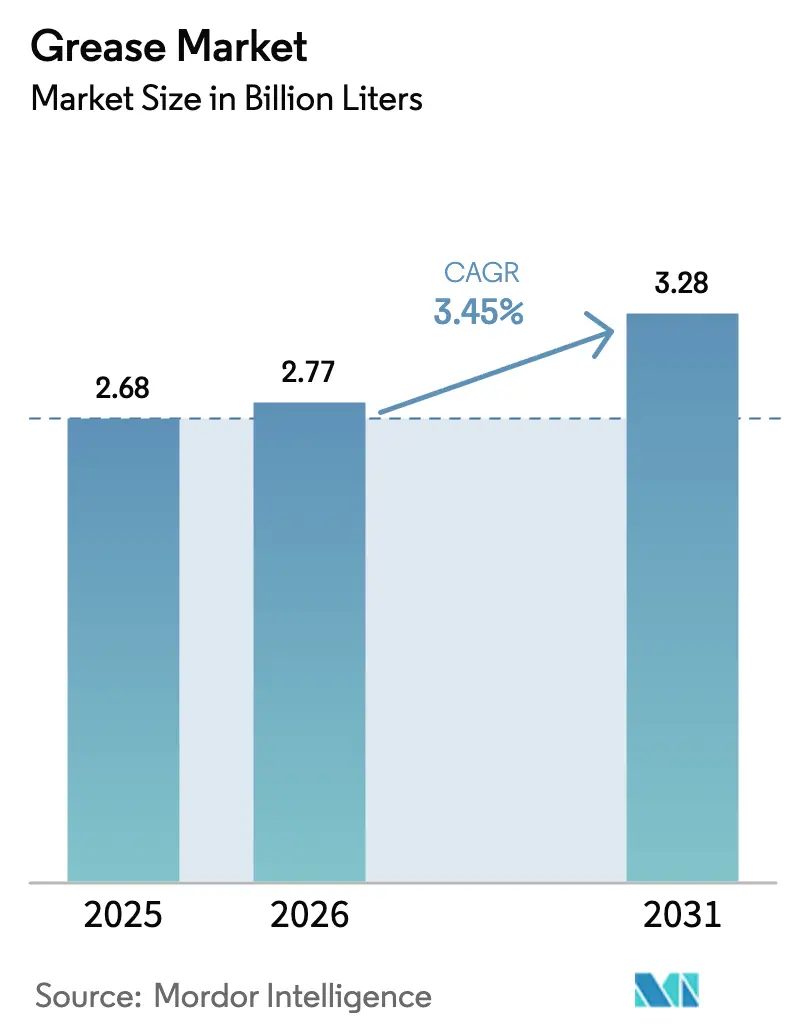
| Market Volume (2026) | 2.77 Billion liters |
| Market Volume (2031) | 3.28 Billion liters |
| Growth Rate (2026 - 2031) | 3.45% CAGR |
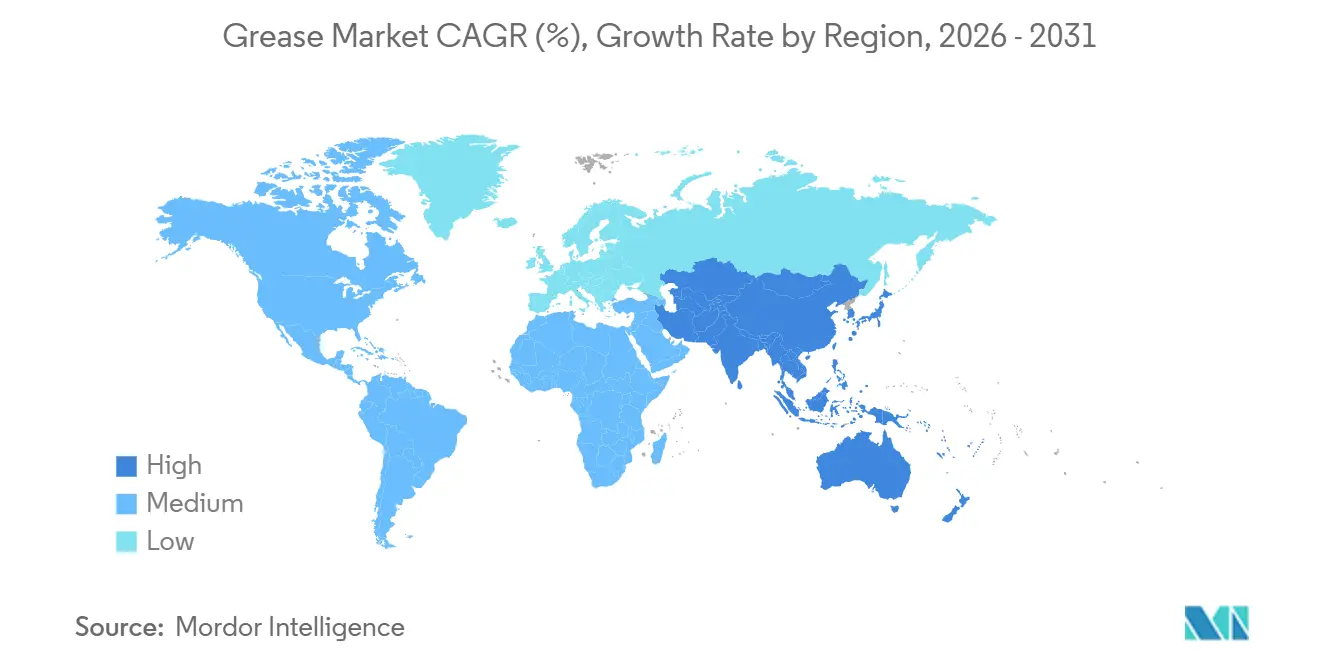
| Fastest Growing Market | Asia Pacific |
| Largest Market | Asia Pacific |
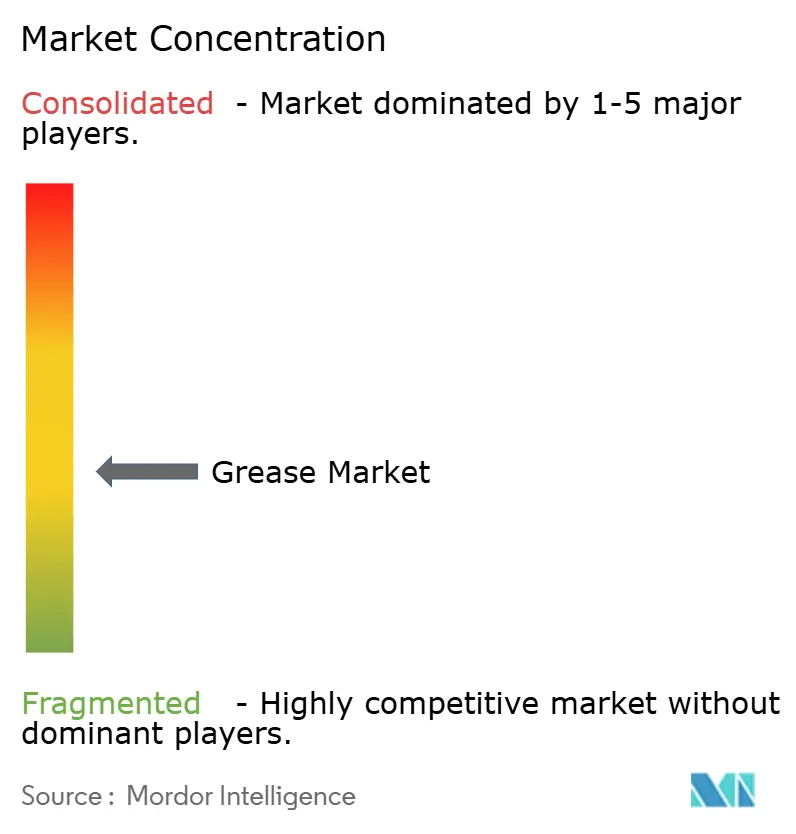
| Market Concentration | Medium |
Major Players *Disclaimer: Major Players sorted in no particular order Image © Mordor Intelligence. Reuse requires attribution under CC BY 4.0. | |
Grease Market Analysis by Mordor Intelligence
The Grease Market size was valued at 2.68 Billion liters in 2025 and is estimated to grow from 2.77 Billion liters in 2026 to reach 3.28 Billion liters by 2031, at a CAGR of 3.45% during the forecast period (2026-2031). This growth reflects ongoing industrialization, surging demand for water-resistant marine grades, and the rapid pivot toward calcium-sulfonate and polyurea chemistries that buffer buyers from lithium-carbonate price swings. Food-processing plants are replacing legacy lithium soaps with NSF H1-certified formulations to mitigate contamination risk, while wind-turbine fleets and electric-vehicle powertrains favor synthetic-oil greases that perform from -40°C to +150°C. Offshore deep-water drilling rigs in the Gulf of Mexico, Brazil, and West Africa now specify calcium-complex grades capable of withstanding cyclic loads and seawater washout, pulling specialty marine volumes into double-digit growth. Parallel investments in re-refined Group II and Group III base-oil projects lower input costs for high-performance products, maintaining manufacturer margins even as competitive intensity rises.
Key Report Takeaways
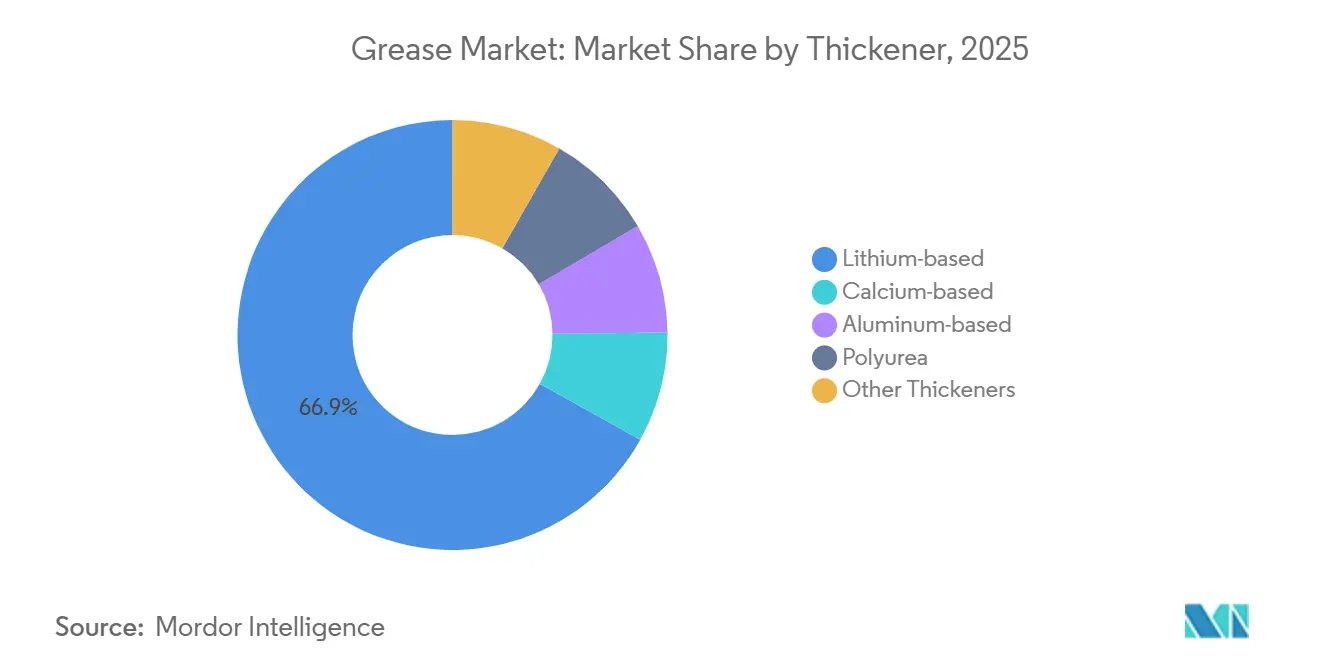
- By thickener, lithium-based accounted for 66.89% of the grease market size in 2025, while calcium-based is advancing at a 8.22% CAGR through 2031.
- By product type, mineral oils accounted for 75.19% of the grease market size in 2025; the synthetic oil segment is advancing at a 4.51% CAGR through 2031.
- By performance grade, high-temperature greases held 36.68% of the grease market size in 2025 and are forecast to grow at a 6.61% CAGR through 2031.
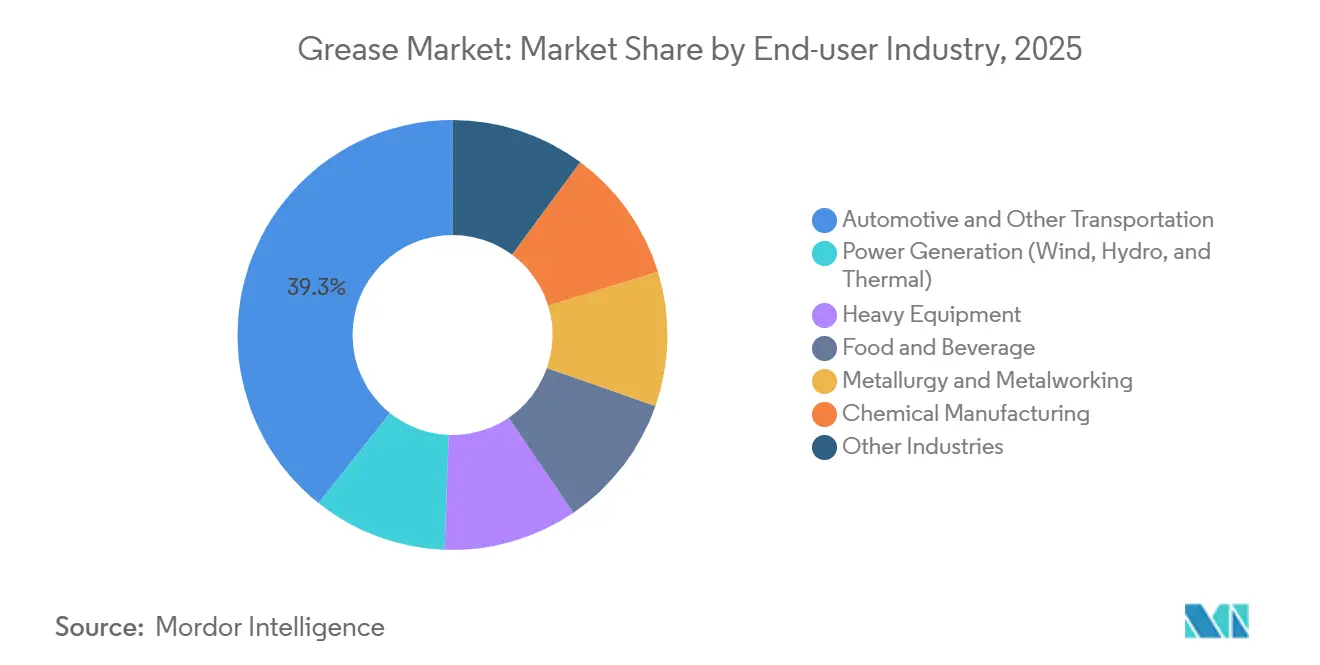
- By end-user, automotive and transportation commanded 39.28% of the grease market size in 2025, while power generation is the fastest-expanding end-user at a 4.82% CAGR through 2031.
- By geography, Asia Pacific dominated with 49.75% of the grease market share in 2025 and is outpacing all other regions at a 4.39% CAGR through 2031.
Note: Market size and forecast figures in this report are generated using Mordor Intelligence’s proprietary estimation framework, updated with the latest available data and insights as of January 2026.
Global Grease Market Trends and Insights
Drivers Impact Analysis*
| Driver | (~) % Impact on CAGR Forecast | Geographic Relevance | Impact Timeline |
|---|---|---|---|
| Hygienic food-grade lubrication uptake | +0.8% | North America, Europe, global food hubs | Medium term (2-4 years) |
| EV e-powertrain bearing shift | +0.9% | Asia-Pacific core, spill-over to North America and Europe | Long term (≥ 4 years) |
| Offshore deep-water drilling demand | +0.6% | Gulf of Mexico, Brazil, Middle East and Africa | Short term (≤ 2 years) |
| Construction equipment expansion | +0.7% | China, India, ASEAN, Middle East | Medium term (2-4 years) |
| Power-generation investments | +0.5% | Europe offshore wind, Asia-Pacific hydro and thermal plants | Long term (≥ 4 years) |
| Source: Mordor Intelligence | |||


Hygienic Food-Grade Lubrication Uptake in Processing Lines
Demand for NSF H1-certified aluminum-complex and calcium-sulfonate greases is climbing because regulatory inspections now treat lubricant selection as a preventive control. Processing plants that handle dairy, brewing, and ready-meal products factor potential recall costs into total-cost-of-ownership analysis, making the 15-25% price premium acceptable. These grades maintain oxidation stability above 150 °C and resist steam-cleaning washout, preventing metallic-soap taste migration. ISO 21469 audits in Europe and North America accelerate adoption as multinational brands unify global hygiene standards. Vendors that offer bundled food-grade grease, technical support, and documentation gain preferred-supplier status with processors seeking audit readiness[1]NSF International, “NSF/ANSI 21469 Certified Lubricants List,” nsf.org.
EV E-Powertrain Bearing Shift to Lithium-Complex & Calcium-Sulfonate Greases
Electric-vehicle motors run at 10,000–15,000 rpm and impose electrical conductivity as well as mixed-rolling conditions that legacy lithium soaps cannot handle. Calcium-sulfonate and lithium-complex greases doped with ionic-liquid additives cut friction losses by up to 45%, reducing rotor temperature and extending driving range. Battery-pack assembly lines in China specify calcium systems to avoid additional lithium-carbonate exposure, a hedge that became standard after the commodity’s 2022-2024 price whiplash. Automakers are locking multi-year contracts for these chemistries, insulating bills of materials from raw-material swings. Polyurea formulations, which remain consistent from -40°C to +180°C, are gaining ground in wheel-bearing and CV-joint applications because they resist water washout.
Offshore Deep-Water Drilling Boosting Water-Resistant Marine Greases
Production start-ups at fields exceeding 1,500 m depth depend on calcium-complex grades with dropping points above 260°C. Blowout-preventer actuators, riser tensioners, and drill-string threads consume 200–300 kg of grease per rig each month. Operators increasingly mandate products meeting ISO 12924 for biodegradability alongside API RP 5A3 thread-compound standards. Calcium-sulfonate formulations surpass lithium soaps in cyclic-load and seawater-washout resistance, improving safety margins. Supply contracts frequently bundle grease with on-site lubrication audits, cementing long-term vendor relationships[2]Chevron Corporation, “Anchor Project Overview,” chevron.com.
Construction Equipment Boom Driving Extreme-Pressure Greases
Megaproject pipelines in India, Indonesia, and Gulf countries elevate excavator and crane utilization above 80%, pushing annual per-machine grease demand to 75–100 kg. Equipment makers now recommend NLGI Grade 2 greases featuring oxidation stability above 200 hours in ASTM D942 testing. Molybdenum-disulfide and graphite help sustain loads over 3,000 MPa when hydrodynamic films collapse. EU REACH restrictions on boron-nitride and PFAS additives compel formulators to adopt organic friction modifiers instead, triggering costly reformulations but opening white space for calcium-sulfonate solutions. Vendors able to certify compliance win a share in fleet contracts.
Restraints Impact Analysis*
| Restraint | (~) % Impact on CAGR Forecast | Geographic Relevance | Impact Timeline |
|---|---|---|---|
| Lithium-carbonate price volatility | -0.4% | Global, acute in Asia-Pacific and North America | Short term (≤ 2 years) |
| EU REACH tightening on PFAS & boron nitride | -0.3% | Europe with spill-over to North America | Medium term (2-4 years) |
| Low penetration of automatic lubrication | -0.2% | South America and parts of Middle East and Africa | Long term (≥ 4 years) |
| Source: Mordor Intelligence | |||
Lithium-Carbonate Cost Volatility Due to Battery-Sector Competition
Spot prices dropped from USD 80,000/t in 2022 to USD 10,000-12,000/t in 2024 when new Chinese brine projects outpaced EV uptake. Grease blenders locked into high-cost contracts saw margins shrink by 200–300 basis points and lengthened purchasing lead times from eight to sixteen weeks. The shock fueled diversification toward calcium-sulfonate and polyurea thickeners that lack battery-sector linkage. Procurement teams now dual-source to cap exposure, but the experience underscores structural fragility in lithium-soap economics. Although prices stabilized by late 2024, risk premiums remain embedded in supplier agreements.
EU REACH Tightening on PFAS & Boron-Nitride Additives
The February 2023 proposal to restrict many PFAS and boron compounds under Annex XVII affects extreme-pressure and high-temperature grades. Some substances phase out by 2026, others later, yet formulators have already moved to substitute chemistries to avoid stranded inventory. Calcium-sulfonate complexes can replace PFAS-laden additives in most cases, though four-ball-wear tests show a 10–15% loss in load-carrying capacity. Multinational OEMs adopt the strictest common denominator, effectively exporting European standards to Asia-Pacific and North America. R&D budgets for specialty greases rose 15–20% to accelerate compliant product launches.
*Our forecasts treat driver/restraint impacts as directional, not additive. The impact forecasts reflect baseline growth, mix effects, and variable interactions.
Segment Analysis
By Thickener: Calcium Formulations Hedge Lithium Exposure
Lithium-based greases maintained a 66.89% grease market share in 2025 as decades of OEM approvals anchor their position. However, calcium-sulfonate greases are advancing at an 8.22% CAGR because they deliver dropping points beyond 260°C, superior water resistance, and excellent four-ball-wear results. Marine, mining, and steel-mill operators adopt them to avoid washout and heavy-load failures. Chevron’s Rykon launch in 2024 targets this space with a load-carrying capacity that surpasses lithium complexes, catalyzing further substitution. Aluminum-complex grades occupy niche high-temperature services such as kiln bearings where 250°C stability offsets a 20–30% price premium. Polyurea chemistries progress as the preferred solution for EV wheel bearings and turbine yaw drives thanks to oxidation resistance over -40°C to +180°C cycles. Specialty thickeners like bentonite and silica gel underpin NSF H1 clean-room applications, reinforcing supplier portfolios.
Calcium and polyurea adoption mirrors procurement strategies that diversify away from lithium-carbonate volatility. Buyers draw dual-sourcing frameworks that blend lithium complexes with calcium equivalents, shifting market-share trajectories through 2031. Polyurea use in wind turbines also supports extended maintenance intervals, cutting downtime and lowering lifecycle cost. Together, these trends raise the calcium-sulfonate and polyurea slices of the grease market size while lithium-based dominance erodes steadily.


By Product Type: Synthetic Oils Gain Ground in Extreme Environments
Mineral-oil greases still account for 75.19% of 2025 volume, yet synthetic formulations grow at 4.51% CAGR as performance needs outstrip conventional limits. Polyalphaolefin and ester bases carry viscosity indices above 140 and resist oxidation beyond 1,000 hours, enabling 12-month turbine relubrication cycles. ExxonMobil’s 2025 re-refined Group II and Group III project in France and the Netherlands lowers synthetic input cost by 10–15%, narrowing historical price gaps with mineral products. Bio-based greases, while niche, secure mandates in forestry and marine zones that enforce low aquatic toxicity under ISO 12924. This segment’s momentum demonstrates that total-cost-of-ownership considerations can outweigh higher unit prices when equipment downtime is critical.
Mineral oil grades continue to dominate automotive chassis lubrication and general industrial services where cost sensitivity prevails. However, as synthetic prices fall and OEM drain intervals lengthen, substitution edges upward. Bio-based products face the steepest adoption curve due to 50–70% price premiums and narrower temperature windows, yet regulatory carrots and sticks are expanding their footprint. Overall, synthetic expansion segments lift the synthetic share of the grease market size year over year.
By Performance Grade: High-Temperature Formulations Lead Volume and Growth
High-temperature greases commanded 36.68% of the 2025 volume and carry a 6.61% CAGR outlook. Steel mills, glass furnaces, and cement kilns run bearings above 200 °C where lithium soaps liquefy, making calcium-sulfonate and polyurea complexes the default choice. Extreme-pressure grades support mining and construction equipment facing loads above 3,000 MPa, though REACH-driven additive reformulations challenge legacy offerings. Low-temperature greases cater to Nordic wind farms and Canadian mining, where -40°C conditions prevail, cementing polyurea’s arctic credentials.
The high-temperature segment benefits from India’s drive to 180 million t of steel by 2030, while low-temperature demand rises with offshore wind installations in the North Sea and Baltic. EU additive restrictions shave performance margins for some extreme-pressure products, spurring R&D into organic modifiers. These dynamics collectively elevate performance-grade differentiation as a key battleground for competitive advantage within the grease market.
By End-User Industry: Power Generation Outpaces Automotive Growth
Automotive and other transportation segments represented 39.28% of 2025 demand, but power-generation assets will grow faster at a 4.82% CAGR as wind, hydro, and thermal fleets age. A single wind turbine consumes 200–300 kg of grease across its life cycle, and the projected 500 GW of new renewable installations through 2030 signals 50,000–60,000 t of incremental volume. OEMs such as Vestas and Siemens Gamesa specify polyurea or lithium-complex products that stretch relubrication intervals, lowering maintenance costs. Construction equipment remains buoyant on Asian and Middle Eastern infrastructure pipelines, raising per-machine grease consumption. Food and beverage processors accelerate NSF H1 adoption, steering demand toward aluminum-complex and calcium-sulfonate bases. Metallurgy and metalworking players migrate from boron-nitride additives to compliant calcium complexes under REACH guidance.
Collectively, these shifts recalibrate the industry mix, with power generation, construction, and food processing chipping away at automotive’s share while supplying higher-margin outlets for specialty formulators. The result is a gradual uptick in average selling price, even as overall grease market share continues to evolve.
Geography Analysis
Asia-Pacific held 49.75% of global volume in 2025 and is forecast to post a 4.39% CAGR. Chinese manufacturing exceeds 30 million vehicles a year, with BYD assembly lines now using calcium-sulfonate greases in cooling modules to reduce exposure to lithium swings. India’s National Infrastructure Pipeline drives extreme-pressure consumption in excavator and crane fleets operating above 80% utilization. Japan and South Korea transition automotive exports to EV platforms, embedding polyurea and lithium-complex solutions that lower bearing friction by 45%. Shell’s 12,000 t Indonesian plant and triple-capacity Thailand site reinforce regional supply security, reflecting long-term confidence in ASEAN industrial growth.
North America benefits from near-shoring that boosts Mexican vehicle production past 4 million units in 2024, encouraging local grease sourcing. The United States leads shale drilling and food-grade adoption, while onshore wind corridors in Texas and the Great Plains absorb synthetic volumes. Chevron’s Anchor field in the Gulf of Mexico consumes marine grades engineered for deep-water loads. Canadian mining operations require arctic-rated greases for sub-zero environments, leaning on polyurea and synthetic PAO chemistries.
Europe presents a mixed picture. German automotive output softened in 2025, yet offshore wind build-outs in the North Sea and Baltic accelerate. Nordic nations demand arctic-grade greases with -50°C pour points, while Turkey’s reconstruction surge spurs extreme-pressure uptake. EU REACH rules on PFAS and boron nitride reshape product portfolios and inflate R&D costs, but offer competitive edge to compliant suppliers.
South America is anchored by Brazil, where Petrobras pre-salt projects fuel marine grease demand. Argentina’s lithium-mining belt boosts extreme-pressure consumption in crushing and conveyor lines. The Middle East and Africa expand construction equipment and power-generation fleets under Saudi Vision 2030 and South African mining investments, respectively. FUCHS’s 40% capacity addition in South Africa evidences confidence in sub-Saharan growth.

Competitive Landscape
The Grease Market is moderately fragmented. BP commenced a sale process for Castrol in May 2025 within a broader USD 20 billion divestment program, signaling that integrated majors reassess downstream assets. Klüber Lubrication’s October 2025 merger with OKS merges food-grade and high-performance portfolios under the Freudenberg umbrella, creating a wider technical service network. Regional independents fill niche gaps in food-grade, low-temperature, and biodegradable segments. Their agility allows rapid compliance with emerging standards, while large players leverage scale and base-oil integration to defend share. Overall, competitive intensity rises as customers demand both sustainability credentials and cost certainty.
Grease Industry Leaders
Exxon Mobil Corporation
Chevron Corporation
BP p.l.c.
FUCHS
Shell plc
- *Disclaimer: Major Players sorted in no particular order

Recent Industry Developments
- September 2025: Klüber Lubrication has acquired TriboServ GmbH & Co. KG, a German company specializing in automatic lubricators and customized lubrication systems. This acquisition strengthens Klüber Lubrication's portfolio to support its growth strategy, with the purchase price undisclosed.
- June 2024: Shell plans to triple its grease production capacity at its Thailand facility to 15,000 tonnes annually, positioning it as Southeast Asia's largest grease hub. This expansion is expected to strengthen Shell's market presence and meet the growing demand in the regional grease market.
- May 2024: Klüber Lubrication has announced an INR 142 crore investment to expand its manufacturing capabilities in India, aiming to strengthen its presence in the Asian food-grade and specialty greases market. This strategic move is expected to enhance competition in the regional grease market.


Research Methodology Framework and Report Scope
Market Definitions and Key Coverage
Our study defines the global grease market as all factory-blended, semi-solid lubricants produced by dispersing metal-soap or non-soap thickeners into mineral, synthetic, or bio-based oils, often fortified with additives to enhance load-carrying, thermal, and corrosion performance. According to Mordor Intelligence, the assessment tracks commercially available volumes and values sold to original-equipment makers, service workshops, and industrial users across 27 countries during 2019-2030.
Exclusion Note: Specialty niche greases formulated solely for vacuum or medical implants are outside this scope.
Segmentation Overview
- By Thickener
- Lithium-based
- Calcium-based
- Aluminum-based
- Polyurea
- Other Thickeners
- By Product type
- Mineral Oil
- Synthetic Oil
- Bio-based Oil
- By Performance Grade
- High-Temperature Greases
- Low-Temperature & Arctic-Grade Greases
- Extreme-Pressure & Heavy-Load Greases
- By End-user Industry
- Automotive & Other Transportation
- Power Generation (Wind, Hydro, Thermal)
- Heavy Equipment
- Food & Beverage
- Metallurgy & Metalworking
- Chemical Manufacturing
- Other Industries
- By Geography
- Asia-Pacific
- China
- India
- Japan
- South Korea
- Indonesia
- Malaysia
- Thailand
- Vietnam
- Rest of Asia-Pacific
- North America
- United States
- Canada
- Mexico
- Europe
- Germany
- United Kingdom
- France
- Italy
- Spain
- NORDIC Countries
- Turkey
- Russia
- Rest of Europe
- South America
- Brazil
- Argentina
- Colombia
- Rest of South America
- Middle East and Africa
- Saudi Arabia
- South Africa
- Nigeria
- Egypt
- Rest of Middle East and Africa
- Asia-Pacific
Detailed Research Methodology and Data Validation
Primary Research
Mordor analysts interview lubricant formulators, base-oil refiners, and maintenance managers in Asia-Pacific, Europe, and North America. These discussions validate grade-specific average selling prices, service-interval shifts in EV drivetrains, and practical adoption barriers that raw statistics rarely reveal.
Desk Research
We collect baseline clues from open, reliable outlets such as UN Comtrade shipment codes, International Energy Agency lubricant balance sheets, European Automobile Manufacturers Association vehicle output, US Geological Survey lithium price trackers, and trade journals that publish quarterly base-oil trends. Company filings, investor decks, and patent listings on Questel help us profile supplier capacities and new thickener chemistries. Subscription databases, including D&B Hoovers for financials and Dow Jones Factiva for archived news, anchor the desk work. The sources listed illustrate, not exhaust, the secondary pool we mine for demand markers, cost curves, and regulatory cues.
Market-Sizing & Forecasting
We reconstruct global demand top-down by starting with national production plus net trade data for lubricants, then applying grease penetration ratios that vary by vehicle parc, industrial machinery stock, and maintenance norms. Results are cross-checked with selective bottom-up rollups derived from sampled supplier shipments and regional channel checks, allowing us to smooth obvious anomalies before locking the base year value. Key model drivers include lithium carbonate and calcium sulfonate cost indices, automotive and construction equipment production, industrial production indices, and EV stock growth. A multivariate regression framework projects these variables forward, while scenario analysis gauges upside from bio-based formulations and downside from extended service intervals.
Data Validation & Update Cycle
Model outputs pass two analyst reviews, variance alerts trigger re-contact of critical respondents, and contradictory indicators are reconciled before sign-off. Reports refresh every twelve months, with mid-cycle updates if currency swings, raw-material shocks, or regulatory shifts materially alter assumptions.
Why Our Grease Market Baseline Stands Up to Scrutiny
Estimates from different publishers seldom align because each selects its own scope boundaries, unit conventions, and refresh cadence. We acknowledge the noise yet believe transparency around variables and reconciliation steps makes Mordor's baseline the dependable reference for planners.
Key gap drivers include whether bio-based niche volumes are counted, differing average selling price ladders, and the frequency with which datasets are re-benchmarked against new trade releases.
Benchmark comparison
| Market Size | Anonymized source | Primary gap driver |
|---|---|---|
| 2.69 billion liters (2025, volume) | Mordor Intelligence | - |
| USD 6.85 billion (2025) | Global Consultancy A | Excludes grease used in power generation and applies fixed 2019 ASPs |
| USD 6.27 billion (2025) | Industry Journal B | Counts only mineral-oil grades and omits synthetic and bio-based segments |
| USD 6.20 billion (2024) | Regional Consultancy C | Converts local currencies with 2022 averages and updates model biennially |
These comparisons show that when scope breadth, price ladders, and update cadence diverge, totals shift noticeably. By documenting every assumption and refreshing annually, Mordor Intelligence offers a balanced, repeatable starting point for decision-makers.


Key Questions Answered in the Report
What is the current grease market size and projected growth through 2031?
The grease market size is 2.77 billion liters in 2026 and is forecast to reach 3.28 billion liters by 2031 at a 3.45% CAGR.
Which thickener type is expected to grow the fastest?
Calcium-based greases are projected to advance at an 8.22% CAGR as users hedge against lithium-carbonate price swings.
Why are synthetic-oil greases gaining popularity?
Polyalphaolefin and ester-based products offer wider temperature ranges and longer relubrication intervals, lowering total ownership cost despite higher unit prices.
How will EU REACH rules affect grease formulations?
Restrictions on PFAS and boron nitride force formulators to adopt alternative chemistries, raising R&D spending and accelerating launches of compliant products.
Which region will contribute the most incremental volume?
Asia-Pacific, led by China, India, and ASEAN countries, is projected to add the largest incremental volume on a 4.39% CAGR to 2031.
Page last updated on:


