Transmission And Distribution Equipment Market Size and Share
Market Overview
| Study Period | 2021 - 2031 |
|---|---|
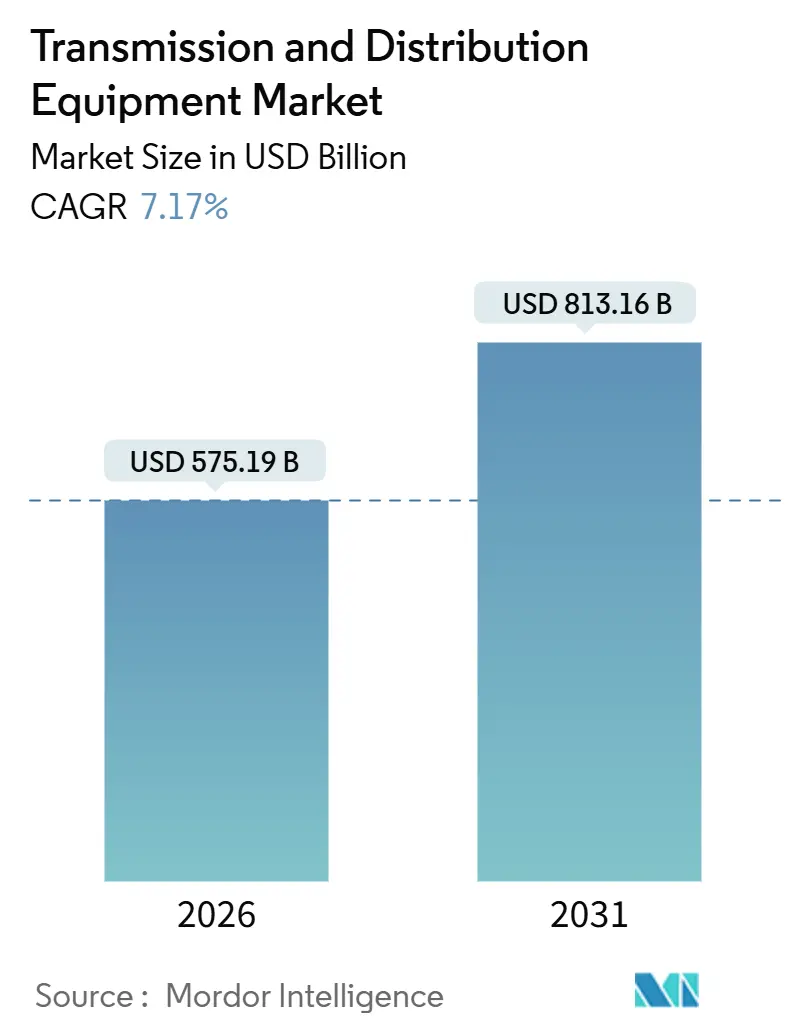
| Market Size (2026) | USD 575.19 Billion |
| Market Size (2031) | USD 813.16 Billion |
| Growth Rate (2026 - 2031) | 7.17% CAGR |
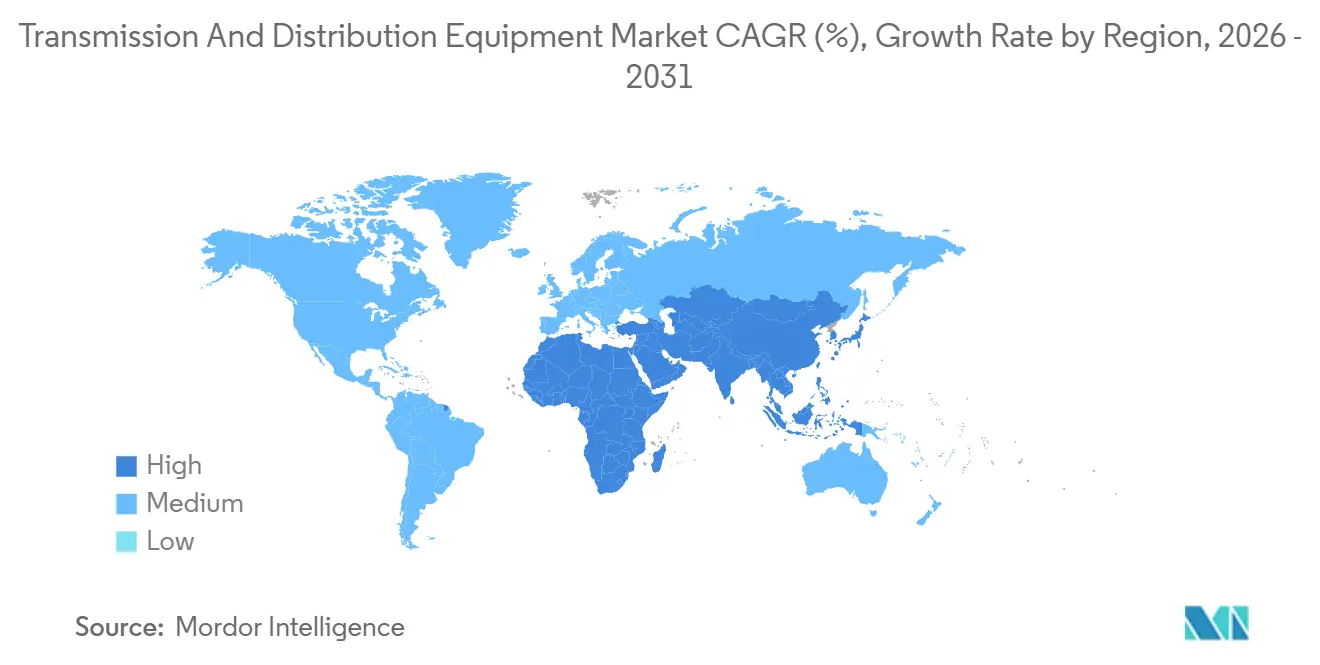
| Fastest Growing Market | Asia Pacific |
| Largest Market | Asia Pacific |
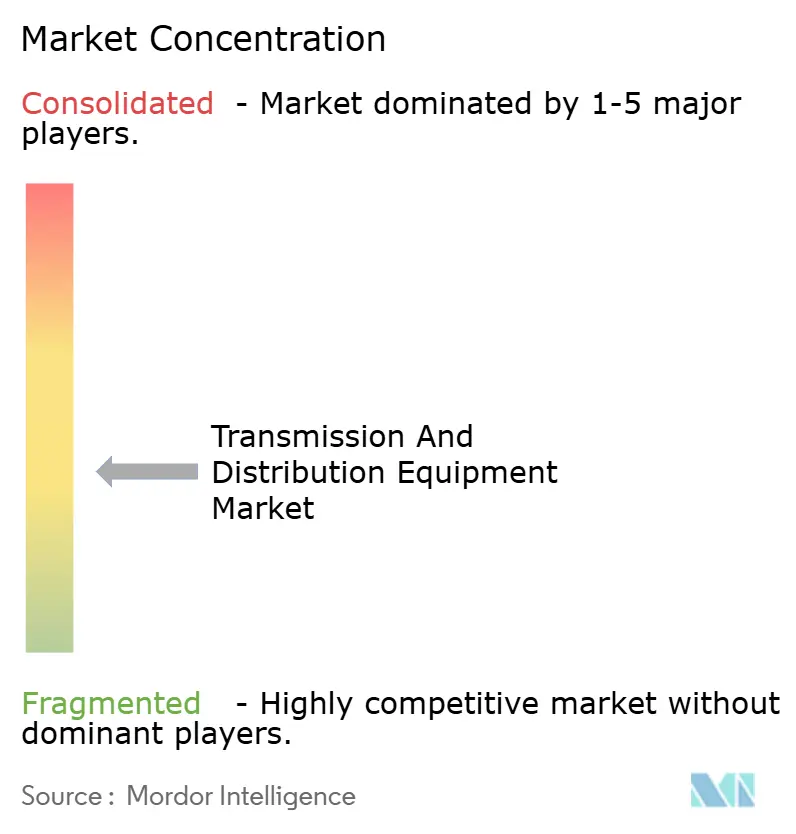
| Market Concentration | Medium |
Major Players *Disclaimer: Major Players sorted in no particular order Image © Mordor Intelligence. Reuse requires attribution under CC BY 4.0. | |
Transmission And Distribution Equipment Market Analysis by Mordor Intelligence
The Transmission And Distribution Equipment Market size is estimated at USD 575.19 billion in 2026, and is expected to reach USD 813.16 billion by 2031, at a CAGR of 7.17% during the forecast period (2026-2031).
Grid-modernization mandates, ultra-high-voltage interconnections, digital substations, and the phase-out of SF₆ switchgear are driving a structural pivot in capex allocations by utilities, data-center operators, and industrial power users. The United States disbursed USD 3.9 billion of Grid Resilience and Innovation Partnerships funds in 2025, while the European Union mobilized EUR 5.8 billion under REPowerEU for cross-border links, together underpinning a resilient near-term order book. China, India, and Saudi Arabia are scaling ±800 kV corridors that halve line losses relative to 500 kV AC systems, creating a premium segment for converter stations, composite insulators, and high-voltage transformers. Suppliers able to deliver factory-tested, modular solutions that compress on-site commissioning and mitigate skilled-labor shortages hold a competitive edge, especially as data centers and green-hydrogen electrolyzers demand 100–500 MW of dedicated substation capacity.
Key Report Takeaways
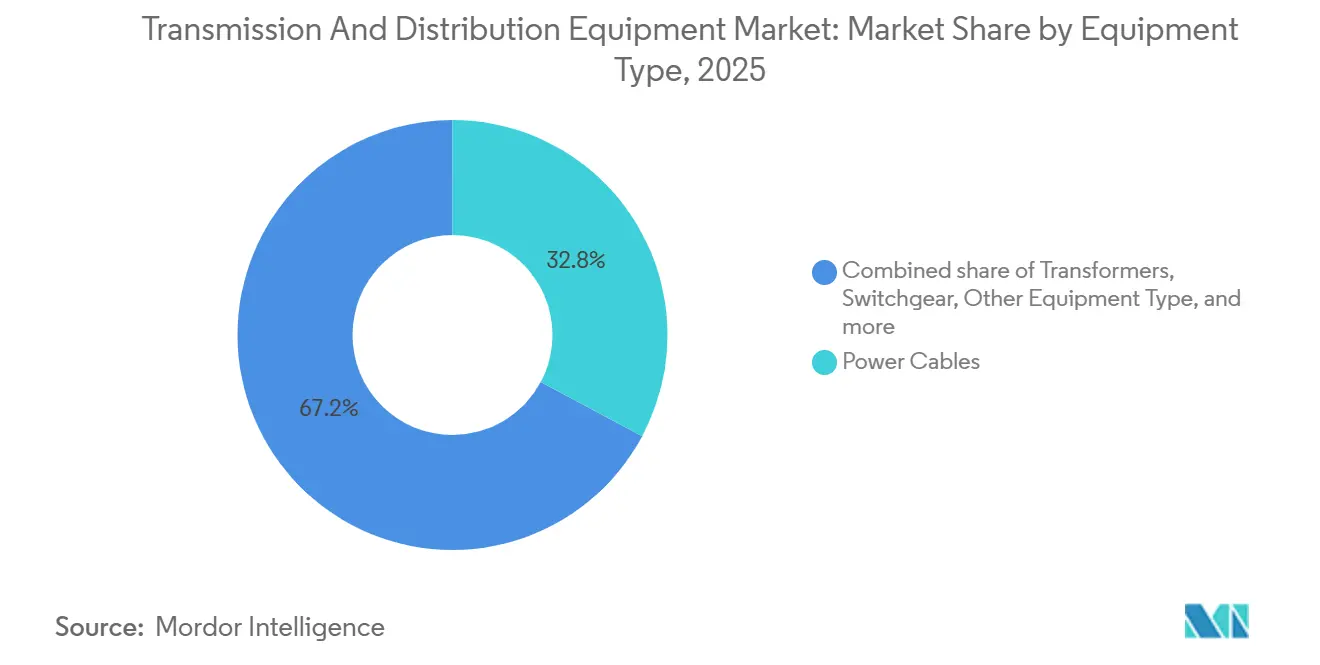
- By equipment type, power cables led with 32.8% of the transmission and distribution equipment market share in 2025; “Other Equipment” is projected to expand at a 9.0% CAGR through 2031.
- By voltage level, high-voltage gear held 43.1% of the transmission and distribution equipment market size in 2025, while ultra-high-voltage equipment is advancing at a 9.8% CAGR through 2031.
- By installation type, upgrade and replacement projects accounted for 58.4% of revenue in 2025; new-build developments record the highest projected CAGR at 8.3% through 2031.
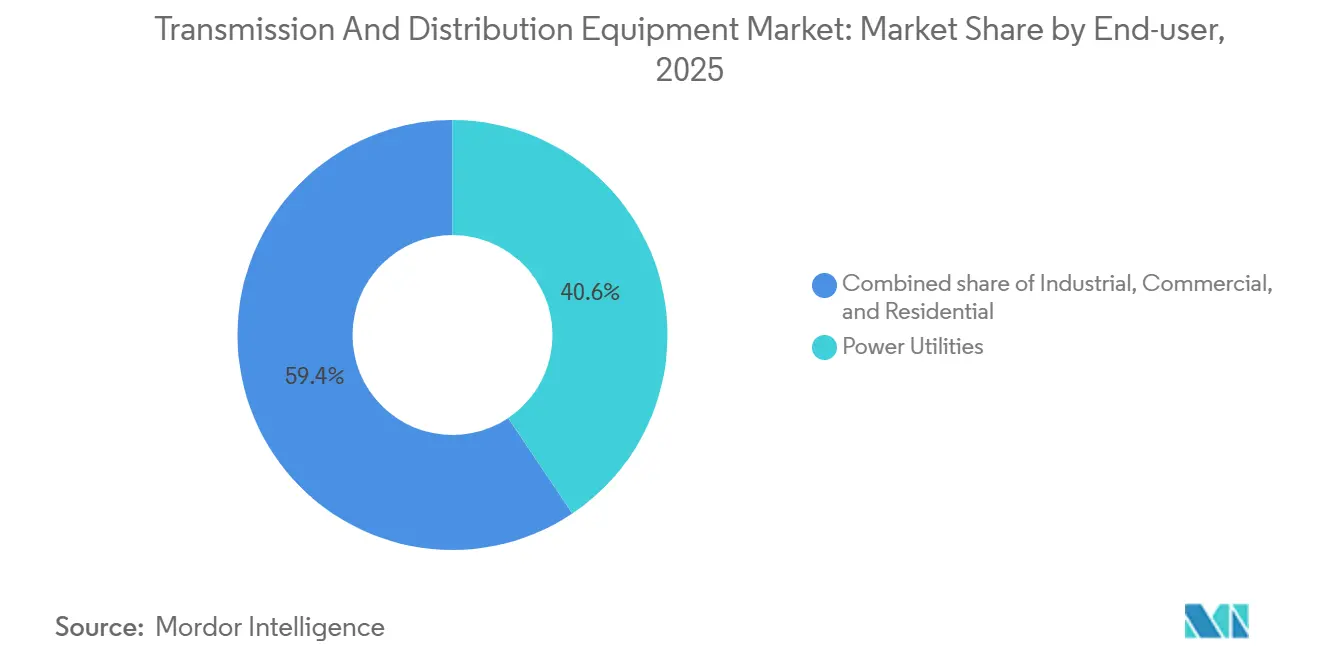
- By end user, utilities commanded 40.6% of demand in 2025, whereas the residential segment is forecast to grow at a 9.0% CAGR to 2031.
- By geography, Asia-Pacific captured 50.5% of 2025 revenue and is forecast to expand at an 8.6% CAGR, the fastest among all regions.
Note: Market size and forecast figures in this report are generated using Mordor Intelligence’s proprietary estimation framework, updated with the latest available data and insights as of January 2026.
Global Transmission And Distribution Equipment Market Trends and Insights
Drivers Impact Analysis*
| Driver | (~) % Impact on CAGR Forecast | Geographic Relevance | Impact Timeline |
|---|---|---|---|
| Accelerated Grid-Modernization Mandates in North America & Europe | 1.2% | North America & Europe | Medium term (2-4 years) |
| Expansion of Ultra-High-Voltage (UHV) Lines in Asia | 1.8% | Asia-Pacific core, spillover to Middle East | Long term (≥ 4 years) |
| Utility Capex Shift Toward Digital Substations & SF₆-Free Switchgear | 1.0% | Global, led by Europe & North America | Medium term (2-4 years) |
| Electrification of Large Industrial Loads (Green Hydrogen, Data-Centers) | 1.3% | Global, concentrated in North America, Europe, Middle East | Short term (≤ 2 years) |
| Rapid Urban Electrification in Middle-Income Economies (ASEAN, Africa) | 1.1% | ASEAN, Sub-Saharan Africa, South Asia | Long term (≥ 4 years) |
| Replacement Cycle of Legacy Oil-Filled Transformers ≥40 Years Old | 0.9% | North America, Europe, mature Asia-Pacific markets | Short term (≤ 2 years) |
| Source: Mordor Intelligence | |||
Accelerated Grid-Modernization Mandates in North America & Europe
National programs are redirecting utility capital toward resilience, capacity, and cybersecurity upgrades. The U.S. Department of Energy allocated USD 10.5 billion for transmission reinforcement, spurring accelerated bids for high-voltage transformers, digital relays, and advanced conductors. In Europe, the REPowerEU initiative targets 25 GW of new cross-border capacity by 2030, propelling demand for IEC 61850 digital substations. Utilities now specify process-bus architectures that cut copper cabling by 80%, reduce footprint, and enable autonomous fault isolation. Nordic pilots are layering blockchain-based peer-to-peer trading onto distribution grids, elevating the functional requirements of medium-voltage switchgear. Collectively, these modernization mandates tighten project timelines, reward suppliers with turnkey capabilities, and reinforce the growth outlook of the transmission and distribution equipment market.
Expansion of Ultra-High-Voltage Lines in Asia
China commissioned 3,500 circuit-kilometers of UHV corridors in 2025, extending ±1,100 kV backbones that move remote wind and solar over 2,000 kilometers with under-3% losses.[1]State Grid Corporation of China, “±1,100 kV Corridor Commissioning Update,” sgcc.com.cn India followed with tenders for six new 800 kV AC substations, while ASEAN utilities evaluate UHV interconnectors for cross-border power trade. UHV equipment relies on specialized silicone rubber insulation and altitude-rated bushings, narrowing the supplier pool and supporting premium pricing. Long-distance corridors lower cumulative right-of-way costs versus multiple 400 kV expansions, making the economic case compelling once lines exceed 1,500 kilometers. These dynamics feed directly into the transmission and distribution equipment market as operators scale orders for 1,000 MVA transformers, composite insulators, and ±800 kV GIS bays.
Utility Capex Shift Toward Digital Substations & SF₆-Free Switchgear
The European Union’s F-Gas regulation caps SF₆ inventory at 2014 levels and mandates a 79% reduction by 2030, triggering rapid adoption of clean-air and fluoronitrile alternatives.[2]European Commission, “REPowerEU Plan,” ec.europa.eu ABB AirPlus and Siemens Blue GIS together captured 35% of 2025 European switchgear orders, underscoring a wholesale pivot toward eco-designs. Digital substations replace copper control wiring with fiber-optic networks, cutting installation labor by 40% yet demanding new cybersecurity protocols. North American utilities retrofit legacy yards with phasor measurement units to meet updated reliability standards, driving incremental demand for outdoor-rated edge servers. This capex reallocation accelerates sensor, software, and low-GWP switchgear sales, deepening the breadth of the transmission and distribution equipment market.
Electrification of Large Industrial Loads
Green-hydrogen electrolyzers reached 12 GW in 2025, each gigawatt-scale complex consuming power on par with an aluminum smelter. Hyperscale data centers used 17 GW in North America alone in 2025, fueled by artificial-intelligence workloads that require continuous baseload power. Both asset classes negotiate direct 220 kV interconnections, bypassing distribution grids and calling for custom transformers with harmonic filters. Utility planners in Virginia’s Loudoun County already fast-track voltage-support projects to accommodate dense data-center clusters.[3]Dominion Energy, “Data Center Transmission Study,” dominionenergy.com Electrolyzer developers specify rectifier transformers with dynamic tap-changers, pushing unit costs 20% above traditional industrial ratings. These heavy, concentrated loads propel steady, high-margin sales across the transmission and distribution equipment market.
Restraints Impact Analysis*
| Restraint | (~) % Impact on CAGR Forecast | Geographic Relevance | Impact Timeline |
|---|---|---|---|
| Volatile Prices of Electrical-Grade Steel & Copper | -0.7% | Global | Short term (≤ 2 years) |
| Lengthy Permitting for New Transmission Corridors in OECD Markets | -0.5% | North America, Europe, Australia | Long term (≥ 4 years) |
| Delayed Utility Cashflows Owing to Tariff Freezes in Emerging Economies | -0.4% | South Asia, Sub-Saharan Africa, parts of South America | Medium term (2-4 years) |
| Skilled-Labour Shortage for High-Voltage Field Services | -0.3% | North America, Europe, parts of Asia-Pacific | Medium term (2-4 years) |
| Source: Mordor Intelligence | |||
Volatile Prices of Electrical-Grade Steel & Copper
Grain-oriented electrical steel climbed 35% between 2024 and 2025, while copper averaged USD 9,200 per ton in 2025, pressuring transformer makers locked into fixed-price contracts.[4]London Metal Exchange, “Specialty Steel and Copper Price Index,” lme.com Manufacturers experiment with amorphous-metal cores to cut steel use and reduce no-load losses; however, material costs rise 40-50%, limiting broad substitution. The concentration of electrical-steel output in East Asia, where three nations supply 75% of capacity, introduces geopolitical vulnerability for Western utilities. Resulting margin compression may delay upgrades, tempering near-term order volumes within the transmission and distribution equipment market.
Lengthy Permitting for New Transmission Corridors in OECD Markets
A typical U.S. transmission line consumes seven to ten years from scoping to energization, with 60% of the timeline tied to environmental reviews and right-of-way negotiations. Europe faces parallel obstacles, as the North Sea Wind Power Hub saw a three-year extension for marine habitat assessments. Financing costs rise sharply during prolonged pre-construction periods, inflating total project budgets by as much as 20%. Utilities increasingly shift toward prefabricated substations that shorten on-site work by 40%, partially mitigating delays but not eliminating permitting bottlenecks. These procedural hurdles restrain growth potential for the transmission and distribution equipment market over the long term.
*Our forecasts treat driver/restraint impacts as directional, not additive. The impact forecasts reflect baseline growth, mix effects, and variable interactions.
Segment Analysis
By Equipment Type: Cables Dominate While Reactive Compensation Surges
Power cables retained 32.8% of 2025 revenue, anchoring the transmission and distribution equipment market through offshore-wind connectors and urban underground feeders. Transformers followed, buoyed by a replacement wave for oil-filled units installed during the 1980s electrification boom. The “Other Equipment” bucket, shunt reactors, capacitors, voltage regulators, and static VAR compensators, is forecast to grow 9.0% annually to 2031, reflecting utilities’ need for dynamic reactive-power support as renewables exceed 40% of peak load. Switchgear demand is pivoting toward SF₆-free designs, with GE Vernova’s g³ booking 47 orders in 2025, validating the commercial readiness of fluoronitrile blends.
Capacitor banks and shunt reactors serve opposite ends of the load curve, and their inclusion in integrated grid-edge packages provides suppliers with cross-selling leverage. Voltage regulators now perform 30 tap operations per day, up from two on legacy designs, highlighting the operational stress induced by rooftop solar swings. Transmission towers and polymer insulators, though lower in value per unit, command significant aggregate spend due to continued corridor rollouts in the Asia-Pacific. Composite insulators that weigh 40% less than porcelain equivalents are particularly favored for mountain spans exceeding 5,000 m elevation.


By Voltage Level: High Voltage Dominates, UHV Surges
High-voltage gear rated 35–220 kV delivered 43.1% of 2025 revenue, underscoring its backbone role in sub-transmission networks. Ultra-high-voltage equipment above 800 kV, although smaller today, is projected to rise at a 9.8% CAGR as continent-scale corridors proliferate in Asia and the Middle East. Medium-voltage products, ring-main units, reclosers, and compact GIS are gaining share in urban grids that mandate self-healing topologies; Schneider Electric’s SM6 now exceeds 2.3 million field installations.
Voltage-source converters enable islanded operation and black-start capability, spurring their specification in India’s Ladakh link despite a 15% cost premium over line-commutated alternatives. Extra-high-voltage transformers integrate online dissolved-gas sensors and IEC 61850 gateways, reducing forced-outage rates by 40% in pilot deployments, while modular medium-voltage switchgear cuts mean-time-to-repair from four hours to 45 minutes, a critical metric for semiconductor fabs.
By Installation Type: Replacements Lead but Greenfield Projects Accelerate
Upgrade and replacement projects represented 58.4% of 2025 revenue as utilities tackled a fleet of 180,000 aging transformers with elevated furfural levels. The new-build segment is set to expand 8.3% annually through 2031, fueled by data-center clusters and green-hydrogen parks that each need 100–500 MW substations. Pacific Gas & Electric extended transformer life by 15 years at 40% of replacement cost via rewinding and sensor retrofits, illustrating the economic case for refurbishment.
Greenfield demand concentrates in Asia-Pacific and the Middle East, where urbanization adds 15–20 GW of substation capacity each year. Containerized substations that energize within 48 hours mitigate labor shortages and reduce site risk, but footprint constraints in retrofits often force utilities to opt for costlier gas-insulated switchgear, reinforcing the premium end of the transmission and distribution equipment market.
By End User: Utilities Anchor Demand, Residential Uptick Accelerates
Utilities held 40.6% of 2025 revenue, reflecting their mandate to build bulk infrastructure, yet procurement cycles lengthened to 14 months as lifecycle-cost models became standard. Residential demand is forecast to grow 9.0% annually through 2031, propelled by rooftop solar-plus-storage systems that require smart meters, pad-mounted transformers, and voltage regulators. Industrial users, accounting for 28% of spend, increasingly self-fund substations under direct-access tariffs, exemplified by ArcelorMittal’s 150 kV build for its Belgian electric-arc furnace.
Commercial data centers now represent 12% of end-user demand, with Northern Virginia’s cluster alone consuming 3.2 GW in 2025 and driving USD 1.8 billion of substation investments through 2028. Suppliers that bundle equipment with multi-year maintenance contracts can command 8–12% price premiums, leveraging utilities’ aging technician workforce and the need for guaranteed uptime.
Geography Analysis
Asia-Pacific captured 50.5% of 2025 revenue and is projected to grow 8.6% annually through 2031, buoyed by China’s ±800 kV backbone, India’s INR 520 billion solar-evacuation schemes, and Indonesia’s 8,500 km rural-distribution rollout. North America and Europe combine for 35% of revenue but are limited to roughly 6% growth as permitting lags negate robust funding. Brazil, Argentina, and Saudi Arabia headline emerging corridors, approving multi-billion-dollar programs that link hydropower and wind zones to metropolitan loads.
Japan and South Korea are replacing oil-filled transformers with dry-type units after a 2024 Tokyo substation fire, creating a USD 800 million annual niche. Sub-Saharan Africa lifted electrification to 54% in 2025, supported by mini-grids financed by multilateral banks, although tariff freezes still hamper utility liquidity. The Middle East’s 3,000 km NEOM-Riyadh backbone, funded with USD 7 billion from the Public Investment Fund, underscores the region’s pivot from oil-fired generation to renewable exports.

Competitive Landscape
The five largest vendors, ABB, Siemens Energy, Hitachi Energy, Schneider Electric, and GE Vernova, collectively hold roughly 42% of global revenue, indicating moderate concentration with ample space for regional champions such as Hyosung Heavy Industries, CG Power, and NARI Technology. Hitachi Energy’s USD 1.2 billion acquisition of a European HVDC cable maker in January 2026 secured scarce subsea-interconnector capacity and deepened its portfolio for North Sea projects. Siemens Energy formed a joint venture with a Chinese insulator producer to trim ultra-high-voltage tower costs by 30% and shave six months off lead times, a model likely to be replicated in cost-sensitive Asian markets.
Competition is most intense in SF₆-free switchgear, where GE Vernova’s g³ landed 47 European orders in 2025, ABB’s AirPlus added Nordic utilities, and Hitachi Energy’s EconiQ progressed in pilot sites across Germany and Japan. Smaller innovators such as NOJA Power disrupt distribution automation with reclosers that slash outage-location time, while Trench Group’s compact instrument transformers target urban GIS retrofits. Cybersecurity mandates in IEC 61850 Ed 2.1 raise entry barriers, favoring vendors with certified engineering teams and validated firmware stacks.
Patent filings show a shift toward solid-state circuit breakers built on wide-bandgap semiconductors, capable of interrupting 100 kA in under one millisecond; ABB and Mitsubishi Electric are early movers. Raw-material hedging, vertical integration in steel slitting, and localized assembly plants (e.g., ABB’s new Bengaluru factory) are additional levers to protect margins amid copper and steel volatility.
Transmission And Distribution Equipment Industry Leaders
ABB Ltd.
Siemens Energy AG
Schneider Electric SE
Mitsubishi Electric Corp.
Eaton Corp. plc
- *Disclaimer: Major Players sorted in no particular order

Recent Industry Developments
- July 2025: ABB introduced the SACE Emax 3 air circuit breaker, featuring predictive-maintenance analytics and zero-trust cybersecurity layers for AI data center feeders.
- July 2025: Siemens Energy has secured the role of preferred bidder for the construction of two HVDC converter stations as part of the GBP 2.5 billion Eastern Green Link 4 subsea electricity project, which will link Scotland and England.
- May 2025: Hitachi Energy acquired Eks Energy to strengthen digital grid capabilities, particularly in renewable integration.
- March 2025: Hitachi Energy announced an additional USD 250 million investment by 2027 to expand global production of critical transformer components.


Research Methodology Framework and Report Scope
Market Definitions and Key Coverage
Our study defines the global transmission and distribution (T&D) equipment market as all new high, medium, and low-voltage hardware that carries electricity from generation plants to the final drop point. Covered products span power and distribution transformers, circuit breakers, switchgear, conductors, towers, poles, insulators, protection and control devices, and overhead and underground power cables installed across utility, industrial, and commercial networks worldwide.
Scope Exclusions: Generation assets, refurbished or rental equipment, and standalone grid-software platforms lie outside our scope.
Segmentation Overview
- By Equipment Type
- Transformers
- Power Transformers (Above 72.5 kV)
- Distribution Transformers (Up to 72.5 kV)
- Switchgear
- Gas-Insulated Switchgear (GIS)
- Air-Insulated Switchgear (AIS)
- Other Switchgears
- Power Cables
- Transmission Cables
- Distribution Cables
- Transmission Towers
- Towers
- Poles
- Voltage Regulators
- Insulators
- Capacitors
- Shunt Reactors
- Other Equipment Type
- Transformers
- By Voltage Level
- Low Voltage (Up to 1 kV)
- Medium Voltage (1 to 35 kV)
- High Voltage (35 to 220 kV)
- Extra-High Voltage (220 to 765 kV)
- Ultra-High Voltage (Above 800 kV)
- By Installation Type
- New Build/Greenfield
- Upgrade and Replacement
- By End-User
- Power Utilities (Transmission System Operators, Distribution Utilities, Renewable Plant Owners and IPPs)
- Industrial (Oil and Gas, Metals and Mining, Petrochemicals)
- Commercial (includes Data-Centers)
- Residential
- By Geography
- North America
- United States
- Canada
- Mexico
- Europe
- Germany
- United Kingdom
- France
- Spain
- Italy
- Nordic Countries
- Russia
- Rest of Europe
- Asia-Pacific
- China
- India
- Japan
- South Korea
- ASEAN Countries
- Rest of Asia-Pacific
- South America
- Brazil
- Argentina
- Colombia
- Rest of South America
- Middle East and Africa
- Saudi Arabia
- United Arab Emirates
- South Africa
- Egypt
- Rest of Middle East and Africa
- North America
Detailed Research Methodology and Data Validation
Primary Research
Mordor analysts then interview grid operators, EPC contractors, component OEMs, and energy-sector regulators across Asia-Pacific, North America, Europe, and emerging regions. These conversations verify installation rates, typical ASPs, lead-time bottlenecks, and policy drivers, letting us close gaps spotted during desk work and refine scenario assumptions.
Desk Research
We begin by mapping the installed grid base and investment flows using open datasets from tier-one public sources such as the International Energy Agency, U.S. Energy Information Administration, UN Comtrade, World Bank, International Renewable Energy Agency, and the International Council on Large Electric Systems. These help us size annual equipment demand through indicators like line-kilometers added, transformer MVA additions, and regional utility capex plans. Company 10-Ks, investor decks, and reputable trade press deepen insight into manufacturer pricing and technology shifts, while D&B Hoovers and Dow Jones Factiva offer revenue splits that anchor supplier roll-ups. The sources listed are illustrative; many additional feeds are consulted to cross-check figures and clarify gray areas.
Market-Sizing and Forecasting
A top-down construct converts national transmission-line, substation, and distribution-feeder expansion budgets into equipment outlays, which are then validated against sampled bottom-up checks on supplier shipments and utility tender data. Key model inputs include annual line-kilometer additions, average transformer MVA per substation, copper-price linked ASP movement, renewable-capacity interconnection queues, and stated national grid-modernization budgets. Forecasts deploy multivariate regression coupled with ARIMA smoothing to project each variable before rolling them into the market outlook. Stress-test scenarios supplied by our primary respondents further bound highs and lows.
Data Validation and Update Cycle
Outputs undergo variance reviews, peer audits, and reconciliation with external grid investment benchmarks. Reports refresh every twelve months, and we trigger interim updates when major tariff reforms, large stimulus bills, or technology cost shocks occur. A final analyst pass right before publication ensures clients receive the latest calibrated view.
Why Mordor's Transmission and Distribution Equipment Baseline Is Dependable
Published estimates often diverge because firms pick different component baskets, voltage bands, and refresh cadences.
Key gap drivers include narrower scopes that omit distribution gear, reliance on historical shipment values without ASP re-indexing, currency translation choices, and varying treatment of utility stockpiles. Mordor's disciplined scope alignment, annual refresh, and dual-lens validation reduce these skews.
Benchmark comparison
| Market Size | Anonymized source | Primary gap driver |
|---|---|---|
| USD 500.24 B (2025) | Mordor Intelligence | |
| USD 342.64 B (2024) | Global Consultancy A | Excludes low-voltage distribution assets; uses trailing line-construction spend only |
| USD 260 B (2023) | Trade Journal B | Counts manufacturer shipments but misses aftermarket replacements and inflation-adjusted ASPs |
| USD 184.12 B (2025) | Industry Association C | Captures direct utility purchases, omits industrial and commercial network upgrades |
Taken together, the comparison shows how definition breadth, input freshness, and price treatment sway totals.
By anchoring values to transparent physical drivers and vetting them through ongoing expert dialogue, Mordor delivers a balanced, traceable baseline decision-makers can rely on.


Key Questions Answered in the Report
What is the current value of the transmission and distribution equipment market?
The market is valued at USD 575.19 billion in 2026 and is projected to hit USD 813.16 billion by 2031.
Which region leads spending on transmission and distribution equipment?
Asia-Pacific holds 50.5% of 2025 revenue, driven by China’s UHV build-out and India’s rural electrification rollout.
Why are utilities shifting toward SF₆-free switchgear?
European F-Gas rules mandate a 79% reduction in SF₆ use by 2030, prompting rapid adoption of clean-air and fluoronitrile alternatives.
How fast will ultra-high-voltage equipment grow?
UHV assets above 800 kV are forecast to expand at a 9.8% CAGR between 2026 and 2031.
Which end-user segment is growing the fastest?
Residential demand is forecast to rise at a 9.0% CAGR between 2026 and 2031.
What factors could restrain market growth?
Volatile electrical-steel and copper prices, along with protracted transmission-line permitting, could temper near-term expansion.
Page last updated on:


