Southeast Asia Power Transmission and Distribution Market Size and Share
Market Overview
| Study Period | 2021 - 2031 |
|---|---|
| Forecast Data Period | 2026 - 2031 |
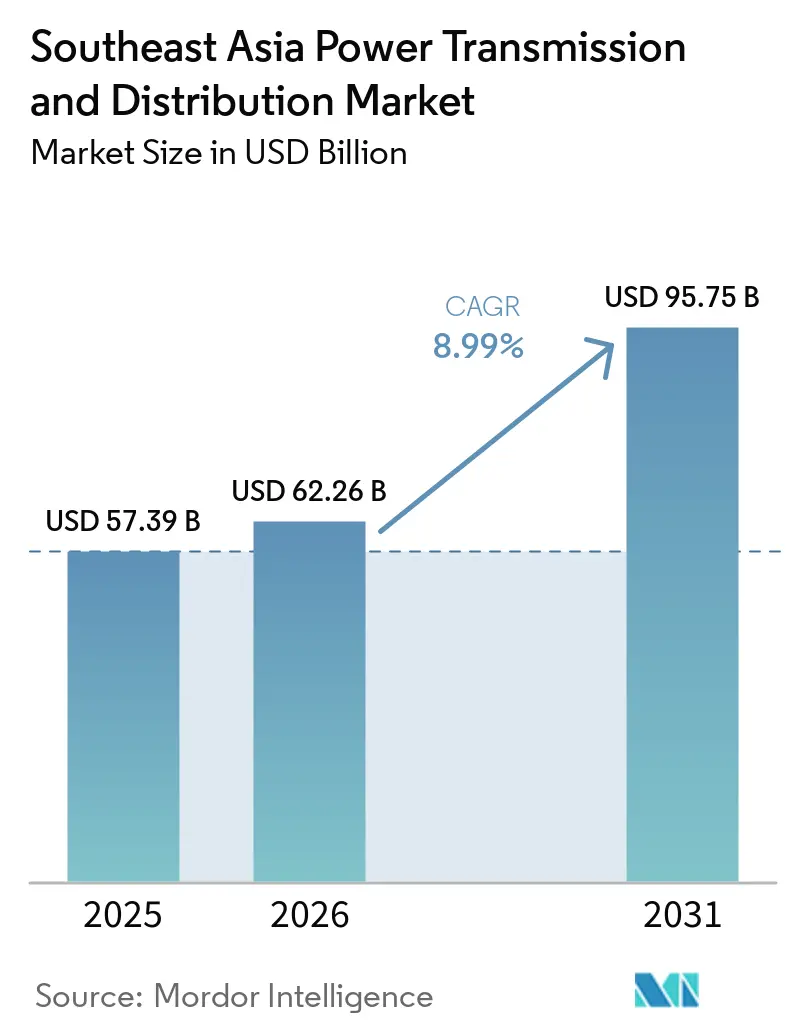
| Base Year Market Size (2025) | USD 57.39 Billion |
| Market Size (2026) | USD 62.26 Billion |
| Market Size (2031) | USD 95.75 Billion |
| Growth Rate (2026 - 2031) | 8.99% CAGR |
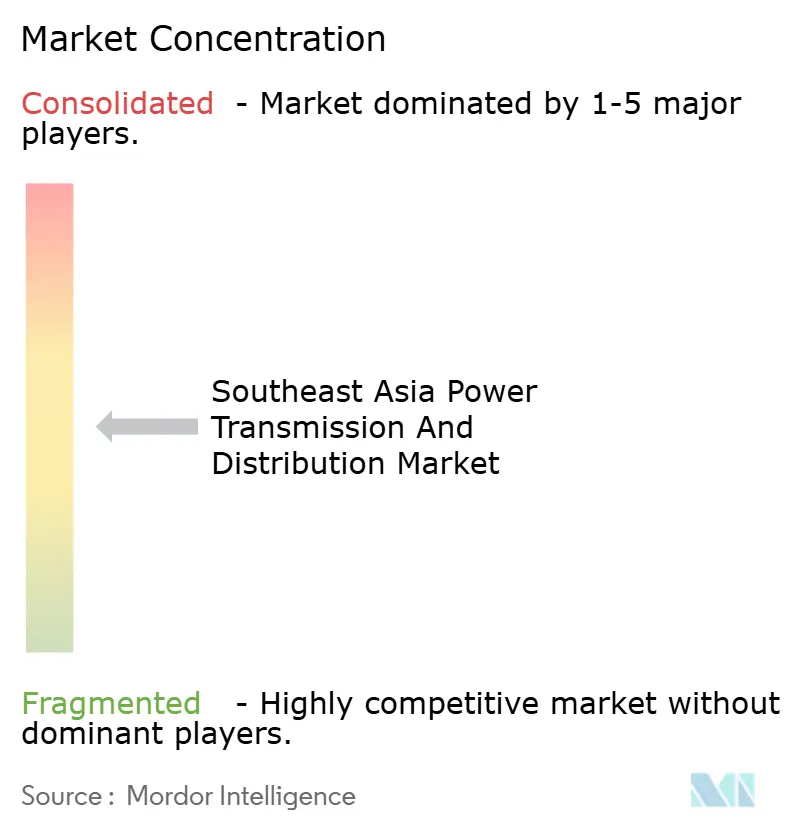
| Market Concentration | Medium |
Major Players *Disclaimer: Major Players sorted in no particular order Image © Mordor Intelligence. Reuse requires attribution under CC BY 4.0. | |
Southeast Asia Power Transmission and Distribution Market Analysis by Mordor Intelligence
The Southeast Asia Power Transmission and Distribution Market size is projected to expand from USD 57.39 billion in 2025 and USD 62.26 billion in 2026 to USD 95.75 billion by 2031, registering a CAGR of 8.99% between 2026 to 2031. Cooling loads already account for 30% of residential demand, and electric-vehicle charging is emerging as a parallel evening peak, forcing utilities to accelerate transformer upgrades and capacitor-bank rollouts. Hyperscale data-center developers have locked in multiyear power-purchase agreements across Singapore, Malaysia, and Indonesia, adding a steady baseload that compels grid operators to build higher-capacity feeders and adopt harmonic mitigation standards. In parallel, 17 ASEAN Power Grid interconnection projects are driving a shift from aging 132 kV routes to bidirectional 500 kV corridors so that surplus renewable output can flow across borders. Competitive intensity is moderate: global original-equipment manufacturers (OEMs) retain technological leadership in extra-high-voltage gear, while regional fabricators win medium-voltage contracts by leveraging shorter delivery cycles and local content rules.
Key Report Takeaways
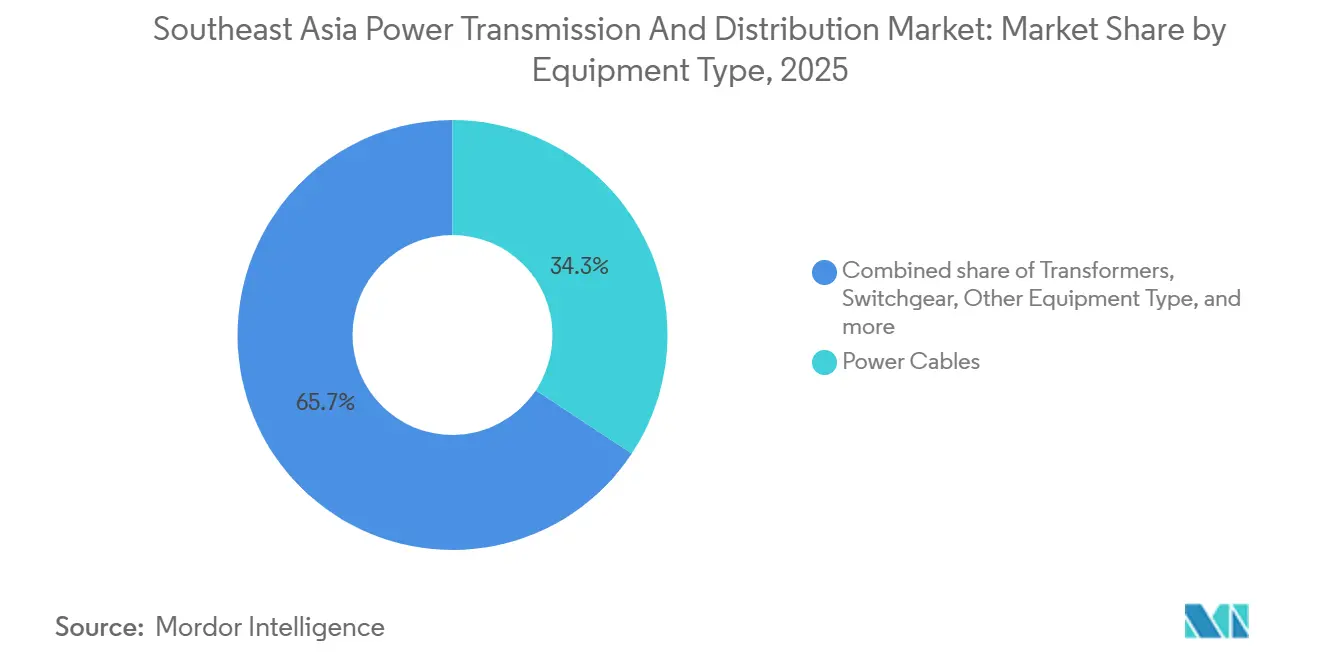
- By equipment type, power cables led with 34.3% revenue share of the Southeast Asia power transmission and distribution market in 2025; the “other equipment” category is forecast to expand at a 10.8% CAGR through 2031.
- By voltage level, high-voltage assets between 35 kV and 220 kV commanded 46.1% of the Southeast Asia power transmission and distribution market share in 2025, whereas ultra-high-voltage systems above 800 kV are advancing at an 11.1% CAGR to 2031.
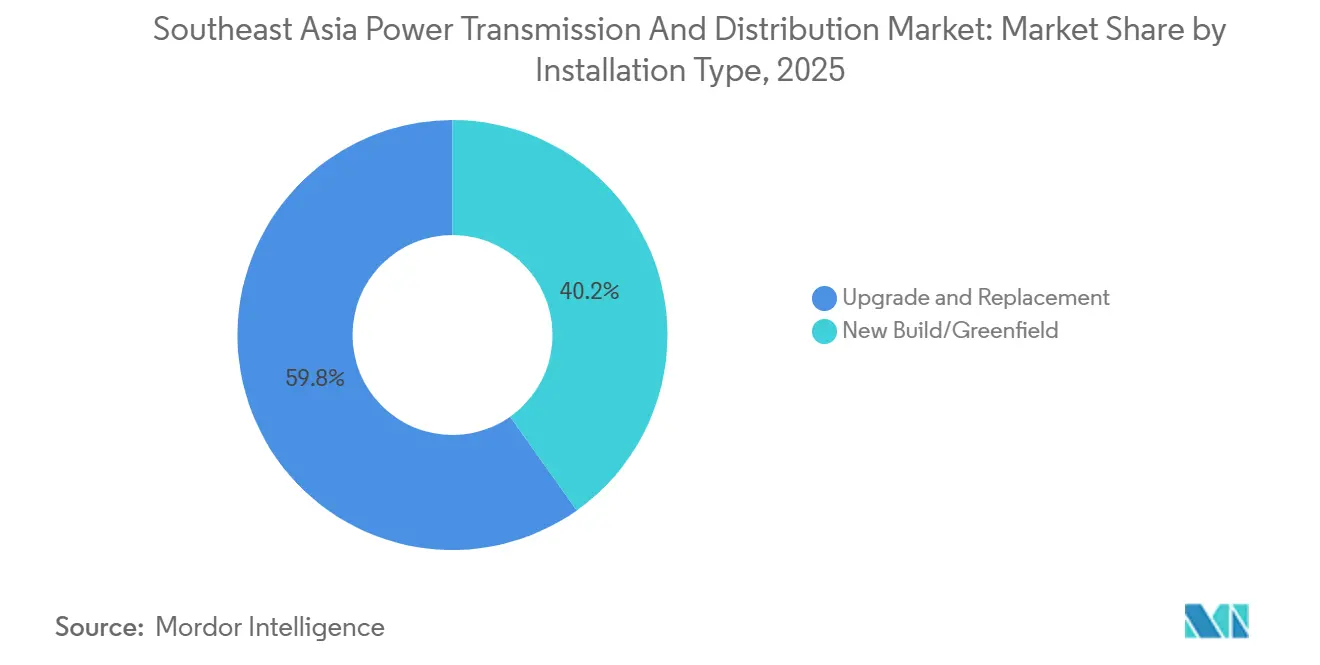
- By installation type, upgrade and replacement activity accounted for 59.8% of the Southeast Asia power transmission and distribution market size in 2025, and new-build projects are growing at a 10.3% CAGR to 2031.
- By end-user, utilities held a 42.5% spending share of the Southeast Asia power transmission and distribution market in 2025, while industrial buyers recorded the highest projected CAGR at 10.5% through 2031.
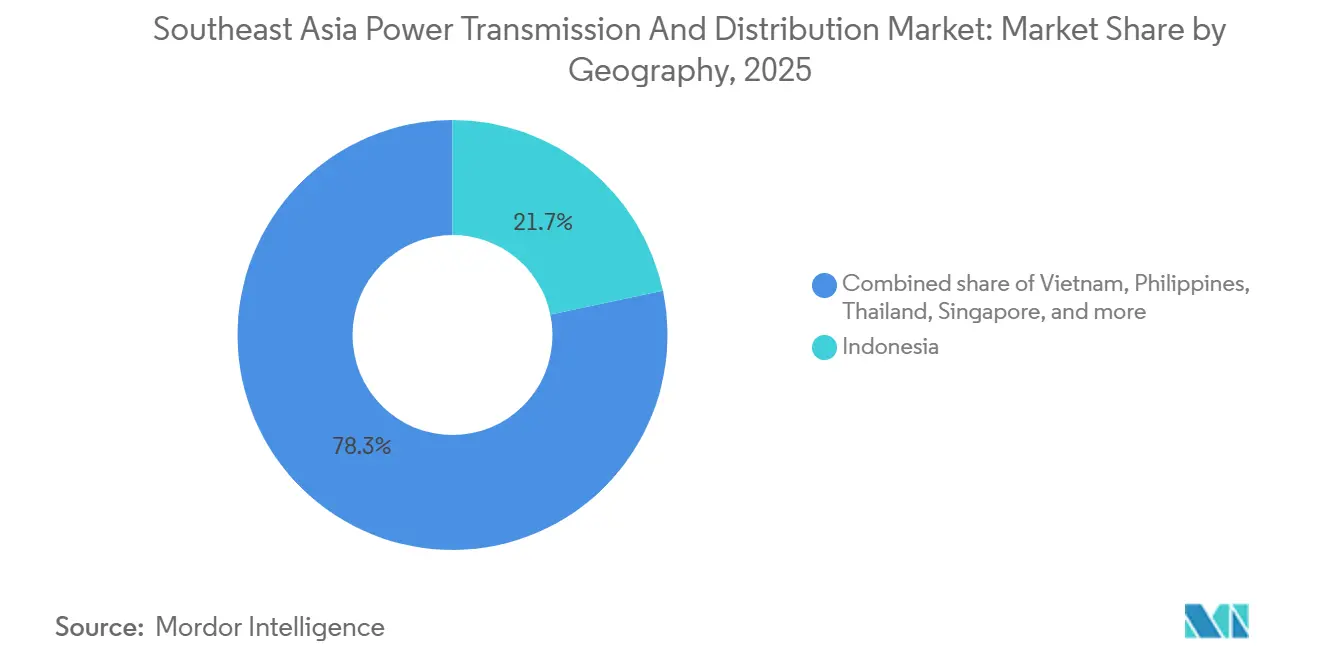
- By geography, Indonesia captured 21.7% of the Southeast Asia transmission and distribution equipment market in 2025, while Vietnam is growing at a 10.4% CAGR, the fastest in the region.
Note: Market size and forecast figures in this report are generated using Mordor Intelligence’s proprietary estimation framework, updated with the latest available data and insights as of January 2026.
Southeast Asia Power Transmission and Distribution Market Trends and Insights
Drivers Impact Analysis*
| Driver | (~) % Impact on CAGR Forecast | Geographic Relevance | Impact Timeline |
|---|---|---|---|
| Surging electricity demand from cooling & EV uptake | 2.1% | Vietnam, Indonesia, Thailand, Philippines | Medium term (2-4 years) |
| Government renewable-integration mandates | 1.8% | ASEAN-wide, concentrated in Vietnam, Thailand, Malaysia | Long term (≥ 4 years) |
| Smart-grid digitalization programs | 1.3% | Singapore, Malaysia, urban Indonesia, Thailand | Medium term (2-4 years) |
| ASEAN Power Grid interconnector build-out | 1.0% | Cross-border corridors: Thailand-Laos, Vietnam-Cambodia, Malaysia-Singapore | Long term (≥ 4 years) |
| Data-center capacity boom | 0.9% | Singapore, Malaysia (Johor), Indonesia (Jakarta, Batam) | Short term (≤ 2 years) |
| Climate-resilient grid design standards | 0.7% | Coastal zones in Vietnam, Philippines, Indonesia; typhoon corridors | Medium term (2-4 years) |
| Source: Mordor Intelligence | |||
Surging Electricity Demand from Cooling & EV Uptake
Air-conditioning penetration is nearing 70% of households in Thailand and Malaysia, and the resulting afternoon-to-night peak forces distribution utilities to oversize transformers and deploy switched capacitor banks to maintain power factor. Parallel growth in electric-vehicle registrations, 120,000 in Thailand alone during 2025, adds localized step-load spikes that require 22 kV dedicated feeders to protect residential circuits. Time-of-use tariffs and advanced metering infrastructure are therefore gaining traction, accelerating procurement of communication-enabled transformers that can support real-time load shedding.[1]Energy Market Authority Singapore, “Nationwide Smart Meter Rollout,” ema.gov.sg Utilities are also testing AI-driven demand forecasts linking weather data with social-media sentiment to predict heat-wave spikes, which calls for fiber backbones and edge-computing nodes at substations. The combined load profile is reshaping the Southeast Asia power transmission and distribution market by prioritizing dynamic reactive compensation and fast-acting voltage regulators.
Government Renewable-Integration Mandates
Vietnam’s Power Development Plan VIII allocates 30.9 GW of offshore wind by 2030, while Indonesia plans to retire 9.2 GW of coal and backfill with solar and geothermal, intensifying the need for long-distance 500 kV routes that wheel power from resource belts to load centers. EVN’s 1,500 km north-south line in Vietnam now channels 5 GW of southern wind toward Hanoi and Haiphong, triggering procurement of shunt reactors and static VAR compensators to stabilize voltage swings. Grid-code revisions also require utilities to maintain ±5% voltage under 40% renewable penetration, amplifying demand for fast-response switchgear. Mandates, therefore, underpin the long-term growth narrative of the Southeast Asia power transmission and distribution market and enlarge the addressable pool for grid-firming equipment.
Smart-Grid Digitalization Programs
Singapore’s nationwide smart-meter rollout will reach 1.5 million endpoints by 2026, and Malaysia’s Tenaga Nasional Berhad (TNB) is piloting digital twins for 132 kV substations that predict transformer failures 90 days in advance. Utilities are embedding dissolved-gas sensors and fiber-optic temperature probes in new transformer fleets, adding 12% to unit cost but cutting unplanned outages by 35%. IEC 61850 communication protocols and cloud SCADA are now standard bid requirements, elevating cybersecurity and data analytics vendors within the Southeast Asia power transmission and distribution market ecosystem. Thailand’s Electricity Generating Authority (EGAT) recorded 25% fewer load-shedding incidents after integrating AI-powered forecasting in 2025, reinforcing the commercial logic for digitalization investment.[2]Electricity Generating Authority of Thailand, “AI-Enabled Load Forecasting Pilot,” bangkokpost.com
ASEAN Power Grid Interconnector Build-Out
Seventeen cross-border projects totaling 6.8 GW were operational by 2025, with expansion to 12 GW scheduled by 2030, catalyzing orders for 500 kV and 800 kV gas-insulated switchgear at border substations. The Lao-Thailand-Malaysia-Singapore Power Integration Project moves 600 MW of hydropower across four time zones, illustrating how coordinated frequency control and settlement platforms can unlock stranded renewable resources.[3]Asian Development Bank, “Lao PDR-Thailand-Malaysia-Singapore Power Integration,” adb.org Technical alignment of grid codes is complex; the Vietnam-Cambodia 220 kV line slipped by 18 months due to control-room integration issues, highlighting execution risks that OEMs and system integrators now price into tenders.
Restraints Impact Analysis*
| Restraint | (~) % Impact on CAGR Forecast | Geographic Relevance | Impact Timeline |
|---|---|---|---|
| High CAPEX & utility budget constraints | -1.4% | Indonesia, Philippines, Vietnam (state-owned utilities with fiscal limits) | Short term (≤ 2 years) |
| Regulatory/land-acquisition delays | -1.1% | Philippines, Indonesia (complex permitting, indigenous land rights) | Medium term (2-4 years) |
| Inflexible coal PPAs limiting grid flexibility | -0.8% | Vietnam, Indonesia, Philippines (markets with legacy coal contracts) | Medium term (2-4 years) |
| Carbon-pricing-driven rise in low-carbon steel costs | -0.6% | ASEAN-wide, concentrated in equipment-importing markets (Singapore, Malaysia, Thailand) | Long term (≥ 4 years) |
| Source: Mordor Intelligence | |||
High CAPEX & Utility Budget Constraints
A 500 kV circuit-kilometer costs USD 1.2–1.8 million, while tariff caps limit average utility revenue growth to 4–6%, squeezing free cash flow and slowing project pipelines.[4]World Bank, “Financing South-East Asian Transmission Lines,” worldbank.org Indonesia’s PLN reported a USD 2.1 billion funding gap in 2025, deferring 12 substations to 2027 and prioritizing lower-voltage distribution projects with faster social payback. The Philippines capped allowable returns for its grid concessionaire at 12%, extending debt-raising timelines for the Mindanao-Visayas link by nine months. Although multilateral lenders shoulder a portion of capex, concessional finance covers only 30–40% of needs, obliging utilities to allocate scarce funds to politically visible rural electrification rather than backbone reinforcement, dampening near-term growth in the Southeast Asia power transmission and distribution market.
Regulatory / Land-Acquisition Delays
The Philippines’ right-of-way process spans indigenous land negotiations and local permits, delaying the Cebu-Negros-Panay 230 kV backbone by 22 months. Indonesia’s spatial-planning law forces developers to coordinate across provincial, regency, and village layers; conflicting zoning pushed the Sumatra-Java HVDC landing back 14 months in 2025. Environmental approvals can take 18 months in Thailand, as seen in EGAT’s 500 kV Kanchanaburi line, which was rerouted 40 km to skirt protected forests. Financing costs inflate as interest accrues during delays, eroding internal-rate-of-return targets and restraining capital inflows into the Southeast Asia power transmission and distribution market.
*Our forecasts treat driver/restraint impacts as directional, not additive. The impact forecasts reflect baseline growth, mix effects, and variable interactions.
Segment Analysis
By Equipment Type: Cables Dominate, Reactive Gear Surges
Power cables secured 34.3% of 2025 revenue, making them the largest line item within the Southeast Asia power transmission and distribution market size. Subway-scale urbanization in Jakarta, Manila, and Bangkok encourages undergrounding to free road corridors and avoid visual clutter. Medium-voltage XLPE designs below 35 kV constitute 60% of total cable kilometers laid, while HVDC export cables serve offshore wind pathways and cross-border links. Transformers are split between power classes above 72.5 kV and distribution classes below; Indonesia alone procured 18,000 distribution units in 2025 to extend electrification. GIS switchgear commands urban and offshore sites despite a 40% cost premium because it cuts footprint by 70% compared with air-insulated alternatives.
The “other equipment” cluster, voltage regulators, capacitors, shunt reactors, and insulators will grow at a 10.8% CAGR to 2031, the highest within the Southeast Asia power transmission and distribution market. Utilities require dynamic reactive compensation as renewable penetration rises toward 40% in Thailand and Vietnam. Shunt reactors mitigate capacitive charging on 500 kV trunks; EVN registered ±150 MVAR swings on light-load nights, prompting accelerated procurement. Polymer insulators now displace porcelain in coastal zones owing to salt-spray corrosion, a policy Malaysia codified in 2025. Rising steel prices linked to the EU Carbon Border Adjustment Mechanism pressured tower manufacturers to pursue composite alternatives, highlighting cost volatility across the supply chain.


By Voltage Level: High-Voltage Backbone, Ultra-High Future
Assets between 35 kV and 220 kV delivered 46.1% of 2025 revenue and remain the workhorse backbone, interlinking regional grids and stepping bulk power to distribution. Thailand's 115 kV mesh supports load transfers during maintenance and limits solar curtailment. Distribution utilities in Vietnam and Indonesia migrate from 11 kV to 22 kV feeders, cutting copper consumption 35% per kilometer and improving loss performance.
Ultra-high-voltage routes above 800 kV are poised for an 11.1% CAGR, driven by Laos' hydropower exports and potential links to China's southern grid. Trial ±800 kV UHVDC corridors show 3.5% losses over 2,000 km, making them attractive for remote wind integration. Extra-high-voltage (220–765 kV) remains dominant for national grids; Indonesia operates 9,200 circuit-km of 500 kV and plans 3,500 km more by 2030. GIS at 500 kV slices substation land use 40%, a decisive advantage in land-scarce Singapore, thereby steering procurement toward compact designs in the Southeast Asia power transmission and distribution market.
By Installation Type: Replacement Leads, Greenfield Gains
Upgrade and replacement accounted for 59.8% of 2025 spending, reflecting a fleet of 1970s-era transformers at end-of-life. Manila identified 320 overloaded units with failure rates climbing to 8% annually, triggering a USD 180 million transformer swap program. Singapore completed a network-wide transition to ester-fluid transformers that cut fire risk 30% and environmental liability by 20%. XLPE retrofits of legacy PILC cables reduce dielectric losses by 15% and double service life, anchoring recurrent demand in the Southeast Asia power transmission and distribution market.
Greenfield installations, however, will expand at a 10.3% CAGR through 2031, fueled by Indonesia’s industrial estates, Vietnam’s renewable energy zones, and Thailand’s Eastern Economic Corridor. Modular substations and containerized control rooms now trim on-site work from 18 months to 10 months, appealing to project-finance schedules. Public-private partnerships secure 15–20-year revenue certainty, positioning new-build corridors as an integral growth vector for the Southeast Asia power transmission and distribution market.
By End-User: Utilities Anchor, Industrials Accelerate
Utilities absorbed 42.5% of 2025 outlays, consistent with their universal-service mandates. Procurement rules emphasize the lowest evaluated bid under multilateral guidelines, favoring standardized designs that ease spare-parts logistics. Renewable plant operators within the utility segment specify 99.5% equipment availability and embedded SCADA to dodge curtailment penalties, reinforcing high-reliability criteria in tender documents.
Industrial customers will grow spending at a 10.5% CAGR, the fastest among end-users, as nickel smelters, petrochemical complexes, and mining hubs self-finance 150 kV and 230 kV substations to secure priority dispatch. Indonesia’s Sulawesi smelters added 1.2 GW of captive substations in 2024-2025, showcasing how private buyers reshape the Southeast Asia power transmission and distribution market share. Data-center operators now form a distinct commercial subsegment, ordering dual-feed topologies, harmonic filters, and uninterruptible power systems that surpass legacy voltage-regulator capabilities.
Geography Analysis
Indonesia generated 21.7% of 2025 revenue, aided by PLN’s USD 25.4 billion electrification drive to build 50,000 circuit-km of lines by 2030. The archipelago’s island topology necessitates HVDC undersea links and localized microgrids; Sulawesi and Papua remain isolated but see solar-storage deployments across 1,200 villages in 2025-2026. Nickel and aluminum smelting in Sulawesi and Kalimantan accelerated demand for 150 kV dedicated feeders, and streamlined permitting under the Omnibus Law cut approval timelines from 24 months to 14 months.
Vietnam will post the fastest 10.4% CAGR to 2031 on the back of 30.9 GW offshore wind targets and the 1,500 km 500 kV north-south corridor that wheels 5 GW toward northern industrial zones. Sixteen 220 kV substations broke ground in 2024-2025 across renewable energy provinces, each integrating static VAR compensators. Coal power purchase agreements still curtail renewables, though Hanoi’s 500,000 smart meters deployed in 2025 trimmed peak by 8% and deferred USD 140 million in upgrades.
Thailand, Malaysia, and the Philippines contribute 14–16% of regional revenue apiece. Thailand’s Eastern Economic Corridor attracted USD 3.8 billion of battery and EV manufacturing in 2024-2025, triggering six new 230 kV substations. Malaysia’s Johor state is the data-center spillover for Singapore; twelve facilities totaling 800 MW under construction require GIS-based 132 kV feeders. The Philippines energized the Cebu-Negros-Panay 230 kV link in 2024, integrating 600 MW of geothermal and hydro while reducing Visayas diesel reliance. Singapore and the rest of Southeast Asia combine for 8% of revenue, with Singapore investing USD 450 million in grid digitalization during 2024-2025.
Competitive Landscape
Four OEMs, Siemens, Hitachi Energy, ABB, and Schneider Electric, control roughly 45-50% of extra-high-voltage hardware spend, leveraging HVDC converter patents and multidecade ties with state utilities. Regional producers such as CG Power, LS Electric, and Hyosung Heavy Industries claim a 30-35% share in medium-voltage switchgear and distribution transformers by offering 20-30% price savings and faster delivery from local factories. Market white space sits at the grid edge: utilities seek bundled hardware-plus-analytics contracts, while most OEMs still sell components separately.
Technology differentiation is sharpening. Hitachi Energy’s transformer digital-twin suite extended asset life 25% in 12 utility awards during 2024-2025. ABB’s fluoronitrile GIS met Singapore’s 2025 SF6 phase-down rules, capturing early-mover advantage. Compliance with IEC 61850 and IEEE C57 standards is now non-negotiable, sidelining smaller entrants lacking accredited labs.
Battery storage developers are emerging disruptors, co-locating 100 MW units at solar plants to time-shift generation and defer 500 kV upgrades, a model that secured eight approvals in Vietnam during 2025. Steel price volatility from carbon-border tariffs compressed tower-maker margins by 8% in 2025, forcing supply-chain pivots to composite poles and modular lattices. Overall, vendor competition hinges on lifecycle service offerings, low-carbon materials, and software integration, shaping the strategic contours of the Southeast Asia Power Transmission And Distribution Market.
Southeast Asia Power Transmission and Distribution Industry Leaders
Mitsubishi Electric Corporation
General Electric Company
Siemens AG
Hitachi Energy
Schneider Electric SE
- *Disclaimer: Major Players sorted in no particular order

Recent Industry Developments
- January 2026: Malaysia's national utility, Tenaga Nasional Berhad (TNB), announced the formal signing of the second phase of the Laos–Thailand–Malaysia–Singapore Power Integration Project (LTMS-PIP 2.0).
- December 2025: In Lahad Datu, Sabah Electricity unveiled Southeast Asia's largest Battery Energy Storage System (BESS), a significant 100MW/400MWh initiative. This move aims to stabilize Sabah's power grid, curtail its reliance on diesel, and bolster the growth of renewable energy.
- August 2025: The 600 MW Monsoon Wind Power Project, spearheaded and predominantly owned by IES, commenced commercial operations. This pioneering venture, Asia's inaugural cross-border renewable energy project, channels clean energy from the southern mountains of Lao PDR directly into Vietnam.
- August 2025: Manila Electric Co. (Meralco) completed nine major projects in the second quarter of 2025, enhancing grid reliability and increasing capacity by 450 megavolt-amperes (MVA) across Metro Manila, Bulacan, Laguna, and Quezon.


Southeast Asia Power Transmission and Distribution Market Report Scope
Power transmission is the large-scale movement of electricity at high voltage levels from a power plant to a substation. Power distribution converts high-voltage electricity at substations to lower voltages that can be distributed and used by private, public, and industrial customers.
The Southeast Asia power transmission and distribution market is segmented by equipment type, voltage level, installation type, end-user, and geography. By equipment type, the market is segmented into transformers, switchgear, power cables, transmission towers, voltage regulators, insulators, capacitors, shunt reactors, and other equipment. By voltage level, the market is segmented into low voltage, medium voltage, high voltage, extra-high voltage, and ultra-high voltage. By installation type, the market is segmented into new build/greenfield projects and upgrade and replacement activities. By end-user, the market is segmented into power utilities, industrial, commercial, and residential consumers. For each segment, market sizing and forecasts are provided on the basis of value (USD).
| Transformers | Power Transformers (Above 72.5 kV) |
| Distribution Transformers (Up to 72.5 kV) | |
| Switchgear | Gas-Insulated Switchgear (GIS) |
| Air-Insulated Switchgear (AIS) | |
| Other Switchgears | |
| Power Cables | Transmission Cables |
| Distribution Cables | |
| Transmission Towers | Towers |
| Poles | |
| Voltage Regulators | |
| Insulators | |
| Capacitors | |
| Shunt Reactors | |
| Other Equipment Type |
| Low Voltage (Up to 1 kV) |
| Medium Voltage (1 to 35 kV) |
| High Voltage (35 to 220 kV) |
| Extra-High Voltage (220 to 765 kV) |
| Ultra-High Voltage (Above 800 kV) |
| New Build/Greenfield |
| Upgrade and Replacement |
| Power Utilities (Transmission System Operators, Distribution Utilities, Renewable Plant Owners and IPPs) |
| Industrial (Oil and Gas, Metals and Mining, Petrochemicals) |
| Commercial (includes Data-Centers) |
| Residential |
| Vietnam |
| Indonesia |
| Philippines |
| Thailand |
| Malaysia |
| Singapore |
| Rest of Southeast Asia |
| By Equipment Type | Transformers | Power Transformers (Above 72.5 kV) |
| Distribution Transformers (Up to 72.5 kV) | ||
| Switchgear | Gas-Insulated Switchgear (GIS) | |
| Air-Insulated Switchgear (AIS) | ||
| Other Switchgears | ||
| Power Cables | Transmission Cables | |
| Distribution Cables | ||
| Transmission Towers | Towers | |
| Poles | ||
| Voltage Regulators | ||
| Insulators | ||
| Capacitors | ||
| Shunt Reactors | ||
| Other Equipment Type | ||
| By Voltage Level | Low Voltage (Up to 1 kV) | |
| Medium Voltage (1 to 35 kV) | ||
| High Voltage (35 to 220 kV) | ||
| Extra-High Voltage (220 to 765 kV) | ||
| Ultra-High Voltage (Above 800 kV) | ||
| By Installation Type | New Build/Greenfield | |
| Upgrade and Replacement | ||
| By End-User | Power Utilities (Transmission System Operators, Distribution Utilities, Renewable Plant Owners and IPPs) | |
| Industrial (Oil and Gas, Metals and Mining, Petrochemicals) | ||
| Commercial (includes Data-Centers) | ||
| Residential | ||
| By Geography | Vietnam | |
| Indonesia | ||
| Philippines | ||
| Thailand | ||
| Malaysia | ||
| Singapore | ||
| Rest of Southeast Asia | ||


Key Questions Answered in the Report
How fast is Southeast Asia spending on new transmission lines growing?
The Southeast Asia power transmission and distribution market is projected to expand at an 8.99% CAGR between 2026 and 2031, reaching USD 95.75 billion by 2031, up from USD 62.26 billion in 2026.
Which equipment category leads regional revenue?
Power cables held the largest 34.3% share in 2025, reflecting urban undergrounding and offshore wind export-cable demand.
What voltage class will see the quickest growth this decade?
Ultra-high-voltage systems above 800 kV will rise at an 11.1% CAGR as Laos hydropower and offshore wind require long-haul HVDC corridors.
Why are industrial buyers increasing their grid-equipment spending?
Captive substations let smelters, refineries, and data centers bypass congested public networks and secure priority dispatch for on-site renewables, driving a 10.5% CAGR in industrial outlays.
What are the main barriers to timely project execution?
High capital-expenditure needs and land-acquisition delays can push schedules back by up to two years, inflating financing costs and dampening near-term market growth.
Page last updated on:


