
Market Overview
| Study Period | 2020 - 2031 |
|---|---|
| Market Size (2026) | USD 6.51 Billion |
| Market Size (2031) | USD 7.89 Billion |
| Growth Rate (2026 - 2031) | 3.89 % |
| Fastest Growing Market | Asia Pacific |
| Largest Market | Asia Pacific |
| Market Concentration | Medium |
Major Players *Disclaimer: Major Players sorted in no particular order Image © Mordor Intelligence. Reuse requires attribution under CC BY 4.0. | |
Traffic Signal Recognition Market Analysis by Mordor Intelligence
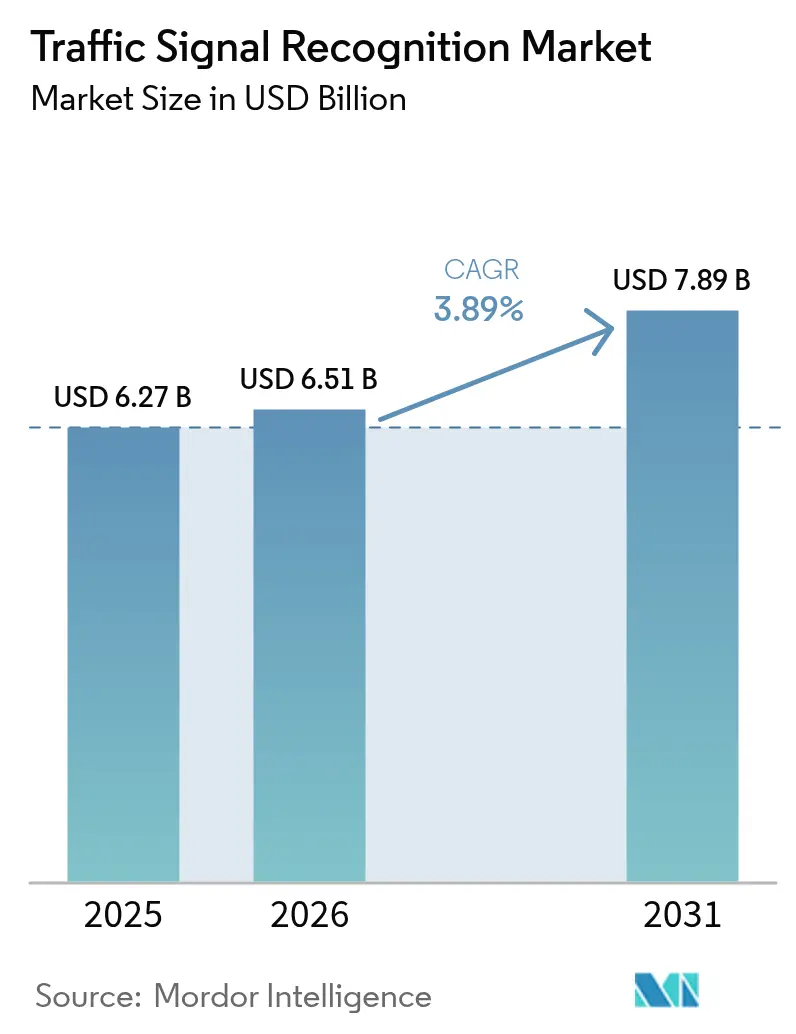
The Traffic Signal Recognition market size is expected to grow from USD 6.27 billion in 2025 to USD 6.51 billion in 2026 and is forecast to reach USD 7.89 billion by 2031 at 3.89% CAGR over 2026-2031. Regulatory mandates, lower camera prices, and Level-2 Plus autonomy expand the addressable base beyond premium models. Original-equipment volumes now give sensor suppliers the economies of scale needed to hold camera costs below the pivotal USD 10 threshold. At the same time, software enhancements sharpen recognition accuracy that feeds insurance telematics scoring and future autonomous-vehicle certification.
Key Report Takeaways
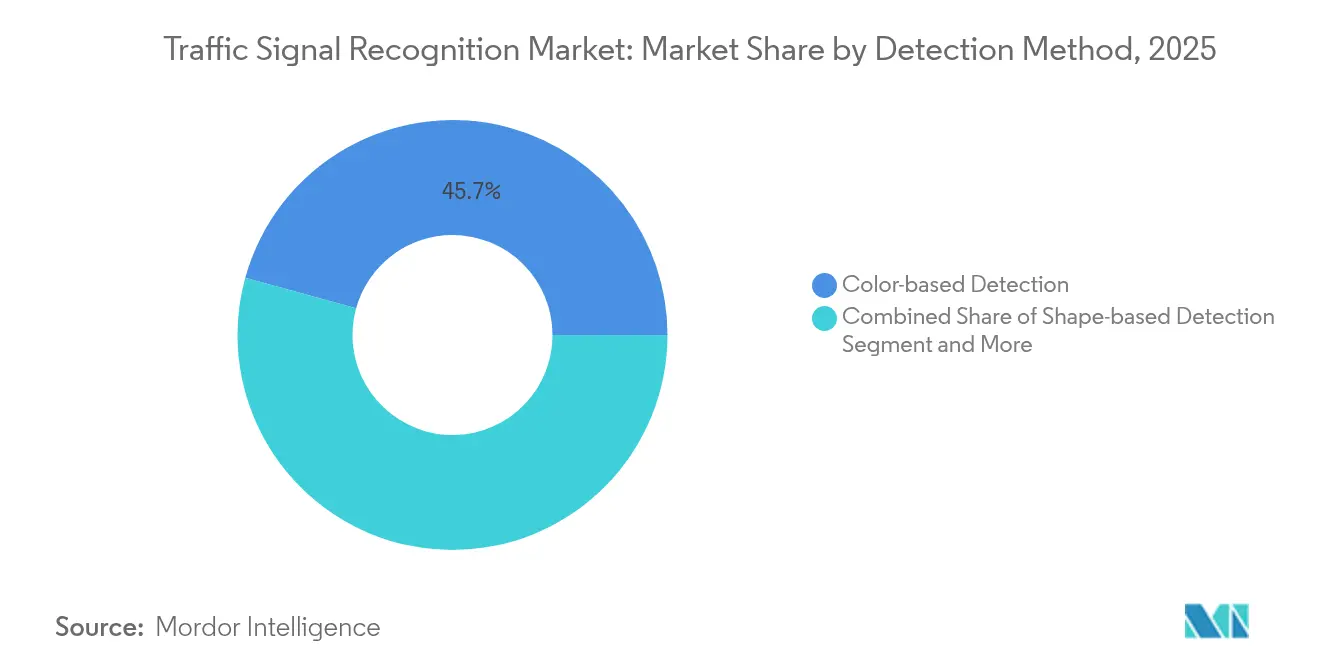
- By detection method, Color-based Detection led with 45.71% of the traffic signal recognition market share in 2025; Deep-Learning Detection is advancing at a 4.47% CAGR through 2031.
- By sensor technology, Camera Systems captured 62.55% of the traffic signal recognition market r revenue in 2025, while LiDAR-Camera Fusion is expanding at a 4.12% CAGR.
- By vehicle type, Passenger Cars accounted for 85.98% of the traffic signal recognition market share in 2025 revenue; Light Commercial Vehicles are progressing at a 4.37% CAGR.
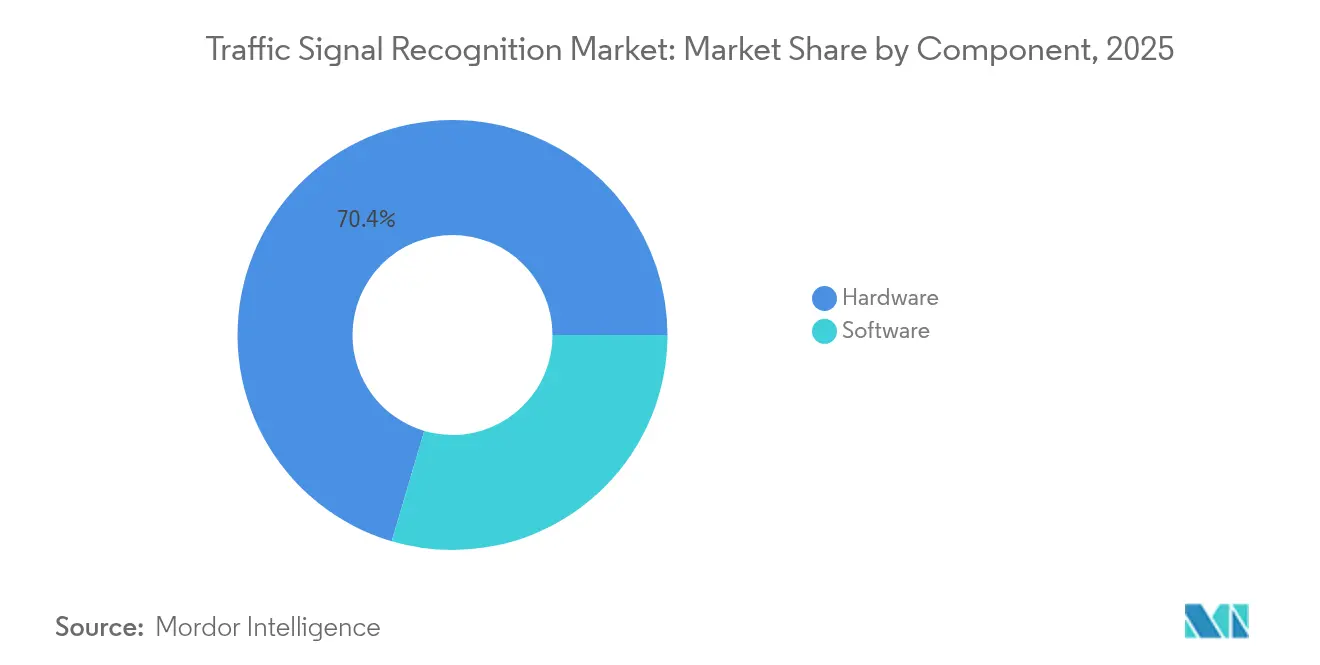
- By component, Hardware held 70.44% of the traffic signal recognition market share in 2025; Software is growing fastest at a 4.95% CAGR.
- By end-user, OEM-installed systems commanded 88.57% of the traffic signal recognition market share in 2025; Aftermarket Retrofit is rising at a 5.41% CAGR.
- By geography, Asia-Pacific represented 38.31% of the traffic signal recognition market share in 2025 and is tracking a 3.98% CAGR to 2031.
Note: Market size and forecast figures in this report are generated using Mordor Intelligence’s proprietary estimation framework, updated with the latest available data and insights as of 2026.
Market Trends and Insights
Drivers Impact Analysis of Traffic Signal Recognition Market*
| Driver | (~) % Impact on CAGR Forecast | Geographic Relevance | Impact Timeline |
|---|---|---|---|
| Regulation-Mandated ADAS | +1.2% | Global, with EU and North America leading | Short term (≤ 2 years) |
| Camera Cost Curve Drops | +0.8% | Global, with Asia-Pacific manufacturing advantage | Medium term (2-4 years) |
| Level-2 Plus Autonomy Proliferation | +0.7% | North America and EU premium segments, spill-over to Asia-Pacific | Medium term (2-4 years) |
| V2I-Enabled Dynamic Sign Updates | +0.5% | National pilots in US, EU, China with urban focus | Long term (≥ 4 years) |
| HD-Map Digital-Twin Build-Outs | +0.4% | Asia-Pacific core, spill-over to developed markets | Long term (≥ 4 years) |
| Insurance Telematics Rewarding TSR Accuracy | +0.3% | North America and EU mature insurance markets | Medium term (2-4 years) |
| Source: Mordor Intelligence | |||
Regulation-Mandated ADAS Inclusion
Binding rules have turned traffic light detection from an optional extra into a required safety feature. The European Union’s General Safety Regulation II, effective July 2024, obliges every new model to include intelligent speed assistance underpinned by traffic-signal inputs, while a parallel NHTSA rule on automatic emergency braking heightens demand for perception suites. OEMs now architect their electrical systems around scalable perception capacity that anticipates future rule-making, effectively locking in multi-year demand for the traffic signal recognition market[1]“General Safety Regulation II Overview,” European Commission, ec.europa.eu.
Camera Cost Curve Drops Below USD 10/Unit
Imaging sensors finally cleared the cost hurdle that once kept advanced vision off mass-market vehicles. Sony’s automotive CMOS roadmap and onsemi’s 3 µm pixel process have driven unit prices beneath USD 10 while boosting HDR to 120 dB and cutting dark current by 28 times[2]“AR0820AT HDR Sensor Product Brief,” onsemi, onsemi.com . Low prices let OEMs deploy eight or more cameras per vehicle, multiplying viewpoints that collectively raise recognition precision across glare, back-light, and LED-flicker scenarios.
Level-2 Plus Autonomy Proliferation
Automakers increasingly see Level-2 Plus as the sweet spot between driver convenience and regulatory complexity. Programs such as Volkswagen’s collaboration with Mobileye and Valeo integrate 360° surround perception so vehicles can hold lane, manage intersections, and read traffic lights hands-free while the driver supervises. These deployments depend on fault-tolerant traffic-signal detection that also feeds next-generation map-matching and cloud-based validation workflows.
V2I-Enabled Dynamic Sign Updates
Vehicle-to-Infrastructure (V2I) pilots in Los Angeles, Hamburg, and Shanghai transmit Signal Phase and Timing data over cellular, shrinking latency to meet safety-critical thresholds. Real-time knowledge of phase transitions lets on-board software predict optimal approach speed and reduces red-light idling, creating municipal incentives for broader network build-outs[3]“Final Rule for Automatic Emergency Braking,” National Highway Traffic Safety Administration, nhtsa.gov.
Restraints Impact Analysis of Traffic Signal Recognition Market*
| Restraint | (~) % Impact on CAGR Forecast | Geographic Relevance | Impact Timeline |
|---|---|---|---|
| Poor Recognition in Low-Visibility | -0.6% | Global, with northern climates most affected | Short term (≤ 2 years) |
| Country-Specific Dataset Validation Costs | -0.4% | Global fragmentation, emerging markets most impacted | Medium term (2-4 years) |
| Cyber-Liability for Erroneous Sign Display | -0.2% | North America and EU regulatory focus, global implications | Medium term (2-4 years) |
| OEM Budget Shift to Competing Sensor Priorities | -0.1% | Global, with premium segment concentration | Short term (≤ 2 years) |
| Source: Mordor Intelligence | |||
Poor Recognition in Low-Visibility and Weather Eextremes
Snow, fog, and heavy rain still challenge cameras, creating service drops that undermine public trust. Laboratory gains such as Snow-CLOCs (86.61% detection accuracy in winter) have yet to translate into uniform street performance, pushing developers toward LiDAR-camera fusion and thermal overlays. Reliability gaps weigh on regulators who demand clearly defined performance envelopes before advancing hands-free legislation.
Country-Specific Dataset Validation Costs
Signal head color, shape, mounting height, and background clutter differ widely between markets, forcing each algorithm vendor to gather, annotate, and test local images. Waymo’s internal audit found 71.7% of traffic-signal states missing or unknown in third-party sets and had to rebuild labels before deployment, illustrating the hidden cost of global scale. Smaller suppliers face prohibitive collection and verification expense that slows entry into the traffic signal recognition market.
*Our forecasts treat driver/restraint impacts as directional, not additive. The impact forecasts reflect baseline growth, mix effects, and variable interactions.
Traffic Signal Recognition Market Segment Analysis
By Detection Method:
AI Algorithms Drive Recognition EvolutionColor-based Detection held 45.71% of the traffic signal recognition market revenue in 2025, a testament to its long-standing use of RGB thresholds. Yet Deep-Learning Detection is rising at 4.47% CAGR to 2031 as convolutional and transformer networks prove superior under occlusion and variable lighting. The traffic signal recognition market size for Deep-Learning Detection is projected to grow exponentially by 2031, reflecting OEM preferences for software-upgradable accuracy gains.
YOLOv5 and attention-based networks now achieve more than 95% precision and over 98% recall while keeping inference below 45 ms, meeting real-time safety budgets. As over-the-air pipelines mature, automakers can retrain models on edge-case footage and push updates without hardware swaps. The traffic signal recognition market continues transitioning toward AI-centric stacks where differentiators sit in data curation, not circuit design.



By Sensor Technology:
Multi-Modal Fusion Gains MomentumIn 2025, Camera Systems captured 62.55% of the traffic signal recognition market revenue, driven by declining BOM costs and the integration of advanced software tooling, which enhanced system efficiency and functionality. This dominance highlights the growing adoption of Camera Systems in traffic signal recognition applications. Despite a moderation in growth rates, the market size for Camera Systems in traffic signal recognition is projected to surge at a strong CAGR through 2031, supported by continuous technological advancements.
LiDAR-Camera Fusion is the fastest-advancing sub-segment at 4.12% CAGR as suppliers like Hesai plan 50% price cuts that place solid-state units within mainstream trims. SparseLIF and similar frameworks align point-cloud geometry with image texture, producing redundancy that sustains recognition when glare or precipitation blinds cameras. Radar-assisted options add speed vectors that predict phase changes, illustrating how multi-sensor blending reshapes the traffic signal recognition market.
By Vehicle Type:
Commercial Applications Drive GrowthIn 2025, Passenger Cars commanded a significant 85.98% share of consumer spending in the traffic signal recognition market, underscoring the impact of consumer-centric safety regulations prioritizing advanced safety features and compliance with stringent standards. Meanwhile, Light Commercial Vehicles are growing, registering a 4.37% CAGR. This growth is driven by fleet operators' increasing adoption of driver-scorecard programs.
Fleet managers quantify ROI through lower collision rates and fuel savings from smoother intersection approaches. Partnerships such as Aurora-Continental-NVIDIA target heavy-duty trucks, where long-haul duty cycles magnify the gains of intersection automation. These dynamics broaden the customer base beyond traditional sedan segments and firmly embed the phrase traffic signal recognition market in logistics strategy discussions.
By Component:
Software Differentiation AcceleratesHardware still brought in 70.44% of the traffic signal recognition market revenue share in 2025, mirroring the tangible bill of materials. However, Software grows 4.95% annually as OEMs pivot to software-defined vehicles. Mobileye’s SuperVision and Chauffeur show that algorithms command more revenue than glass and silicone.
Code-centric value unlocks recurrent earnings via feature subscriptions and map-update fees, an angle increasingly critical in the traffic signal recognition industry. Continuous learning loops that harvest anonymized camera frames keep perception fresh without recalls. As a result, the traffic signal recognition market is evolving into a platform play rather than a one-time hardware sale.
By End-User:
Aftermarket Retrofit Gains TractionOEM-installed platforms claimed 88.57% of the traffic signal recognition market revenue share in 2025 outlays, buoyed by policy-driven integration. Nonetheless, Aftermarket Retrofit is rising at 5.41% CAGR as operators retrofit aging fleets to meet insurer or municipal tender requirements. Cambridge Mobile Telematics measured a 20% drop in distraction and a 27% drop in speeding among users of retrofitted safety kits.
The segment’s resilience highlights unmet demand in regions with slow new-vehicle turnover. Modular camera pods with CAN bus adapters let installers add signal recognition to a ten-year-old chassis within an hour. Despite Mobileye’s decision to wind down its own retrofit unit, niche specialists remain positioned to capture share in the traffic signal recognition market, where fleet ROI calculations trump consumer brand cachet.
Geography Analysis
APAC Traffic Signal Recognition Market
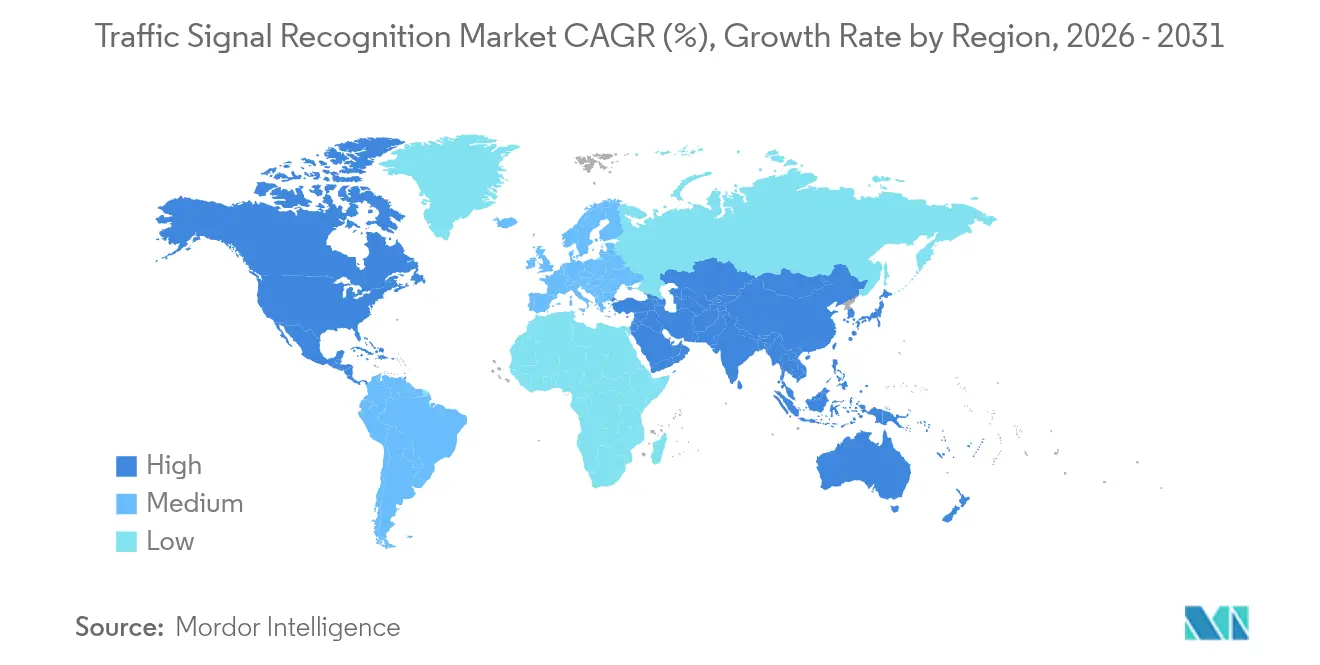
Asia-Pacific led with 38.31% of the traffic signal recognition market revenue share in 2025 and is expected to grow at a 3.98% CAGR through 2031. Domestic regulations, smart-city pilots, and vertical integration concentrate the traffic signal recognition market in China, Japan, and South Korea. Shenzhen’s V2I corridors feed real-time phase maps to test fleets, while Tokyo’s sensor industry supplies HDR imagers to global OEMs. Regional high-density traffic creates diverse datasets that sharpen deep-learning robustness and accelerate global validation cycles.
Europe Traffic Signal Recognition Market
Europe follows, propelled by General Safety Regulation II. Continental’s new Aumovio division and Bosch’s sensor-fusion suites anchor supply, while stringent cybersecurity rules shape data-handling architectures. Insurance telematics in Germany and the United Kingdom reward verified compliance, channeling consumer demand into the traffic signal recognition market.
North America Traffic Signal Recognition Market
North America benefits from federal safety mandates and venture-backed autonomy pilots. California’s edge-case legal scrutiny pushes suppliers to document fail-safe performance, while Canada’s winter climate provides natural laboratories for adverse-weather testing. Together, these factors sustain a diversified yet interconnected geography where advances in one region ripple quickly to others through globally distributed OEM programs.

Regulatory Landscape
Traffic signal recognition demand is anchored to type-approval and ADAS mandates that pull vision-based perception into standard equipment. In the European Union, the General Safety Regulation framework (Regulation (EU) 2019/2144, as applicable from July 2024 for new types) requires safety features such as Intelligent Speed Assistance that rely on traffic sign and signal inputs, which pushes OEMs and Tier-1s to validate perception performance across lighting, LED flicker, and jurisdiction-specific signal conventions.
At the international level, UNECE Regulation No. 171 on Driver Control Assistance Systems (DCAS) entered into force on 22 September 2024 and was amended with registrations noted in January 2026, strengthening the compliance context for higher-function driver assistance where perception and HMI behavior must be controlled and auditable. In parallel, interface and data-handling standardization is advancing through ISO 23150:2023, which defines logical data communication between environment sensors (camera, radar, lidar) and fusion units, reinforcing the need for interoperable, safety-oriented perception pipelines in multi-sensor TSR deployments.
Value Chain Analysis
The value chain starts with imaging and ranging hardware (automotive CMOS image sensors and optics, plus radar and LiDAR where fusion is used) and extends through in-vehicle connectivity and compute. Component suppliers such as STMicroelectronics (automotive image sensors) and sensor module specialists such as First Sensor feed camera and sensing subsystems, while vision SoC and accelerator providers such as Ambarella and Mobileye supply the processing layer needed for real-time inference and video pipelines. Data transport and in-vehicle interfaces (for example, MIPI CSI-2 with functional-safety extensions) sit between sensors and domain controllers, making signal integrity and latency part of the performance budget.
Tier-1 integrators package these elements into production ADAS modules (for example, Valeo Smart Front Camera) and deliver them into OEM vehicle programs, where system validation, calibration, and regulatory documentation are completed at the vehicle level. Functional safety engineering under ISO 26262, including SEooC-style safety building blocks, fault injection, diagnostics coverage, and ASIL-targeted architectures, has become a gating activity that affects schedules and supplier selection as TSR moves from feature differentiation to safety-relevant compliance in high-volume platforms.
Competitive Landscape
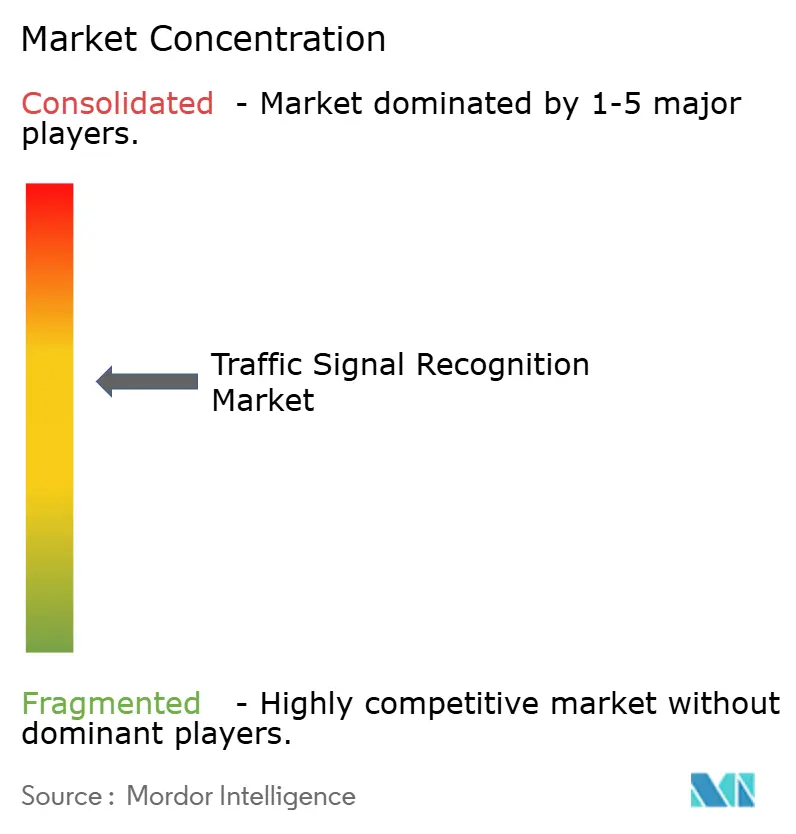
The traffic signal recognition market is moderately consolidated: the top five vendors controlled a noteworthy global revenue share in 2024. Tier-1 giants—Continental, Bosch, DENSO—capitalize on production scale and long-standing OEM integration. Specialist players like Mobileye focus on perception software and have licensed their platforms to multiple automakers. Silicon partnerships illustrate the blurred line between component and algorithm; DENSO is co-developing next-generation ADAS ASICs with onsemi, while Bosch procures HDR imagers from Sony.
Strategic moves underscore a shift toward ecosystem plays. Continental carved out its sensor activities under the Aumovio label in April 2025, targeting a September 2025 IPO to attract capital for software-defined autonomy. Volkswagen deepened ties with Mobileye and Valeo for Level-2 Plus MQB programs, pooling camera and radar data to refine signal recognition. Hesai’s announced 50% LiDAR price cut will likely spur broader sensor-fusion packages among mid-tier suppliers, intensifying price pressure in the traffic signal recognition market.
White-space opportunities revolve around construction zone detection, temporary traffic lights, and connected intersection analytics. Ouster’s BlueCity unit illustrates how combining curbside LiDAR with in-vehicle perception yields citywide optimization dashboards. To win OEM design slots, startups entering the traffic signal recognition industry must prove data pipeline scalability and weather resilience. Still, niche contracts in smart-city infrastructure remain accessible with focused offerings.
Traffic Signal Recognition Industry Leaders
Continental AG
Robert Bosch GmbH
Mobileye Corporation
DENSO Corporation
ZF Friedrichshafen AG
- *Disclaimer: Major Players sorted in no particular order
Traffic Signal Recognition Market Companies Covered in this Report
- Continental AG
- Robert Bosch GmbH
- DENSO Corporation
- Mobileye (Intel)
- ZF Friedrichshafen AG
- HELLA (FORVIA)
- Aptiv PLC
- Valeo SA
- Magna International Inc.
- Panasonic Holdings
- Hyundai Mobis
- Hitachi Astemo
- Veoneer / S-SW
- Ford Motor Company
- General Motors Company
- Tesla Inc.
- NVIDIA Corporation

Market Opportunities and Future Outlook
Connected-intersection and V2I data creates whitespace for hybrid traffic-signal recognition that combines on-board vision with infrastructure messages (SPaT/MAP) to reduce ambiguity at complex junctions and in adverse visibility. A concrete standardization anchor is SAE J2945/BS_202511 (issued November 2025), which specifies minimum requirements for supporting traffic signal priority and preemption, enabling more consistent vehicle-intersection interoperability where deployments exist. This aligns with ongoing city-side pilots referenced in the report context (for example, Los Angeles, Hamburg, and Shanghai transmitting Signal Phase and Timing), opening an opportunity for suppliers that can fuse V2I with camera-based state classification while managing cybersecurity and data provenance.
Another opportunity is embedded optimization and dataset-driven software differentiation, particularly for retrofit and cost-sensitive trims where compute and power budgets are constrained. In March 2026, the TS-1M dataset (over one million real-world images across 454 standardized categories) was published for autonomous driving benchmarking, supporting faster iteration on edge-case coverage and cross-region generalization. Research demonstrations in 2026 also highlight momentum toward lightweight, end-to-end and temporal (video-based) recognition models running on embedded platforms, which supports OEM and fleet buyer requirements for software upgradability, lower validation friction, and improved handling of arrows and flashing patterns without redesigning the sensor stack.
Recent Industry Developments in Traffic Signal Recognition Market
- January 2026: Robert Bosch GmbH showcased AI-driven perception as part of its mobility technology focus at CES 2026, emphasizing cross-domain software and hardware integration. The messaging reinforces the supplier shift toward software-defined perception stacks where camera-based recognition features, including traffic-signal interpretation, are packaged as updatable capabilities rather than fixed-function modules.
- April 2025: Continental unveiled the Aumovio brand as part of a broader software-defined ADAS platform strategy, aligning its sensor and software activities to unify perception sensing, fusion, and vehicle compute roadmaps. The move signals a deeper integration of traffic-signal recognition into its broader ADAS platforms and sets the stage for updated product lines.
- July 2024: The European Union General Safety Regulation II took effect for new vehicle types, elevating the baseline requirement for ADAS functions such as Intelligent Speed Assistance that depend on robust sign and signal inputs. This regulatory milestone accelerated mainstream fitment of forward cameras and the associated validation work for traffic-signal and traffic-sign interpretation across multiple markets.


Traffic Signal Recognition Market Report Scope and Research Methodology
Market Definition and Coverage
For this study, the market covers revenue generated from traffic signal recognition solutions used in vehicles to detect and interpret traffic lights and related road signals, using in-vehicle sensing and software, and sold through OEM and aftermarket channels across regions.
Scope exclusions: This sizing excludes general traffic management infrastructure and non-vehicle roadside systems that do not directly enable in-vehicle recognition.
Segments Covered in This Report
- By Detection Method
- Color-based Detection
- Shape-based Detection
- Feature / Deep-Learning Detection
- By Sensor Technology
- Camera Systems
- Radar-Assisted TSR
- LiDAR-Camera Fusion
- Multi-modal
- By Vehicle Type
- Passenger Cars
- Light Commercial Vehicles
- Medium and Heavy Commercial Vehicles
- Buses and Coaches
- By Component
- Hardware
- Software
- By End-User
- OEM-installed
- Aftermarket Retrofit
- Geography
- North America
- United States
- Canada
- Rest of North America
- South America
- Brazil
- Argentina
- Rest of South America
- Europe
- Germany
- United Kingdom
- France
- Spain
- Italy
- Rest of Europe
- Asia-Pacific
- China
- Japan
- South Korea
- India
- Rest of Asia-Pacific
- Middle East and Africa
- Saudi Arabia
- United Arab Emirates
- Egypt
- South Africa
- Rest of Middle East and Africa
- North America
Data Sources, Market Sizing, and Validation
Desk Research
Desk research was first used to build the base structure of the market and to pin down what is actually being counted as traffic signal recognition in vehicles, before numbers were modeled. We referenced public sources such as UNECE and national road safety agencies for ADAS-related rules and timelines, vehicle sales and parc releases such as OICA, and crash and exposure statistics from sources such as WHO and national transport departments.
To quantify the demand pool and conversion logic, we also used customs and trade statistics for selected sensing and electronic categories, association and standards body publications (for example, ISO style references on safety and camera performance), plus peer reviewed papers that discuss traffic light detection accuracy and sensor fusion trends. Company annual reports, investor decks, and reputable press were reviewed to understand product positioning and how TSR features are packaged with ADAS. Select paid subscriptions that support company financials, news, and patent intelligence were used only to cross-check timelines and activity signals. The desk sources listed here are illustrative, and additional public documents were used for data collection, validation, and clarification.
Primary Interviews and Surveys
Primary work was carried out with executives, product and engineering leaders, and managers involved in ADAS hardware, perception software, and vehicle program planning, followed by checks with downstream stakeholders who influence fitment and feature adoption. Since this is a global market, inputs were balanced across APAC, EMEA, and the Americas so regional fitment rates, price expectations, and regulatory pull were validated rather than assumed.
Distribution of primary research fieldwork respondents
| Company type | Respondent position | Region |
|---|---|---|
| Top tier: 27% | CXOs: 15% | APAC: 44% |
| Mid tier: 52% | Functional/Unit leaders: 34% | EMEA: 36% |
| Smaller Players: 21% | Managers: 51% | Americas: 20% |
Market-Sizing & Forecasting
The core model was built using a top-down approach where global light vehicle production and parc trends were converted into an addressable ADAS demand pool, then filtered using feature penetration for traffic signal recognition by vehicle class and region. To keep the totals grounded, we corroborated them with selective bottom-up checks, such as sampled program level fitment, typical content-per-vehicle assumptions, and volume weighted ASP ranges gathered from interviews.
A few inputs carried most of the weight in the model, including new vehicle sales by region, mix shift toward camera and multi-sensor ADAS stacks, OEM versus aftermarket fitment share, software versus hardware revenue split, and the ASP progression curve as TSR moves from premium trims to wider adoption. Where direct observations were thin, we used conservative adoption bands and then tightened them during follow-up calls, especially for emerging markets where feature packaging differs.
For forecasting, scenario analysis was used, supported by a simple multivariate regression check that linked TSR revenue growth to vehicle production, ADAS penetration, and camera-based perception content trends. Assumptions were not locked until the demand drivers and price paths matched what experts described as realistic over model years and platform refresh cycles.
Data Validation & Update Cycle
Outputs were checked in several passes so large jumps were explained before the final numbers were released. Our team compared modeled totals with independent signals such as regional vehicle sales movement, the pace of ADAS feature standardization, and practical ASP ranges, then flagged outliers for review.
When variances appeared, the underlying drivers were re-tested through follow-up questions, and adjustments were made only when there was a clear logic trail. Reports are refreshed every year, and interim updates are triggered when material events occur, such as regulation changes or major shifts in sensor cost curves. Before delivery, an analyst performs a final pass to ensure the latest public data and validated assumptions are reflected.
Mordor Intelligence's Global Traffic Signal Recognition Market Market Size Versus Other Published Estimates
Published market sizes for traffic signal recognition often do not match because the counted revenue boundary can shift, and because pricing and adoption assumptions are refreshed at different times. Some studies also use different timing for currency conversion, which can move a global USD value even when local demand is unchanged.
Key gap drivers in this market usually come from whether traffic sign recognition is combined with broader ADAS perception stacks, how OEM software is priced versus bundled, and whether aftermarket retrofits are treated as a meaningful revenue stream. By re-checking ASPs and penetration using recent model-year signals and then locking FX timing to the same reference window, Mordor Intelligence keeps the 2026 estimate tied to repeatable price-times-volume logic rather than a mixed-year average.
Benchmark comparison
| Source | Market Size | Gaps in Research Methodology |
|---|---|---|
| Mordor Intelligence | USD 6.51 B (2026) | |
| Industry Research Portal A | USD 1.89 B (2024) | The lower value likely reflects an earlier base year and a tighter scope that prices only a subset of TSR-related revenue, which can undercount bundled OEM ADAS packaging and later-year ASP progression. |
| Global Market Publisher B | USD 3.10 B (2024) | The estimate appears to use a shorter horizon with a more aggressive growth path, and it may apply broader technology groupings where adjacent perception functions are counted together, which shifts the boundary and the effective ASP used. |
The spread in the table mainly comes from year choice and what gets bundled into the priced solution, followed by how quickly ASP is assumed to normalize as the feature scales. When the scope is kept consistent and the adoption and pricing inputs are refreshed in a disciplined way, the resulting market size stays easier to trace back to clear drivers and to update when new vehicle programs and regulations appear.


Key Questions Answered in the Report
What is driving the recent growth of the traffic signal recognition market?
Mandatory ADAS regulations in the European Union and the United States, coupled with camera prices dropping below USD 10 per unit, are rapidly expanding OEM adoption and pushing the market toward mainstream volumes.
Which detection method is gaining the most momentum?
Deep-Learning Detection is the fastest-growing method, advancing at a 4.47% CAGR as convolutional and transformer networks outperform traditional color-based approaches under challenging conditions.
How significant is LiDAR-Camera Fusion to future deployments?
While cameras remain dominant, LiDAR-Camera Fusion is the quickest-rising sensor technology segment at 4.12% CAGR because it mitigates weather-related visibility issues and enhances redundancy.
Why are fleet operators investing in aftermarket retrofit solutions?
Retrofit kits allow commercial fleets to equip older vehicles with traffic-signal recognition, lowering insurance premiums and improving safety metrics without waiting for new-vehicle turnover.
Which region leads the traffic signal recognition market?
Asia-Pacific commands the largest regional share at 38.31% due to its manufacturing scale, supportive government policies, and dense urban test environments.
How are insurance companies influencing adoption?
Usage-based telematics programs in North America and Europe tie premium discounts to verified compliance with traffic signals, encouraging both drivers and fleets to activate and maintain recognition features.
Page last updated on:





