
Textured Soy Protein Market Size and Share
Market Overview
| Study Period | 2021 - 2031 |
|---|---|
| Market Size (2026) | USD 1.37 Billion |
| Market Size (2031) | USD 1.87 Billion |
| Growth Rate (2026 - 2031) | 6.37 % |
| Fastest Growing Market | Middle East and Africa |
| Largest Market | North America |
| Market Concentration | Medium |
Major Players
*Disclaimer: Major Players sorted in no particular order Image © Mordor Intelligence. Reuse requires attribution under CC BY 4.0. |
|
Textured Soy Protein Market Analysis by Mordor Intelligence
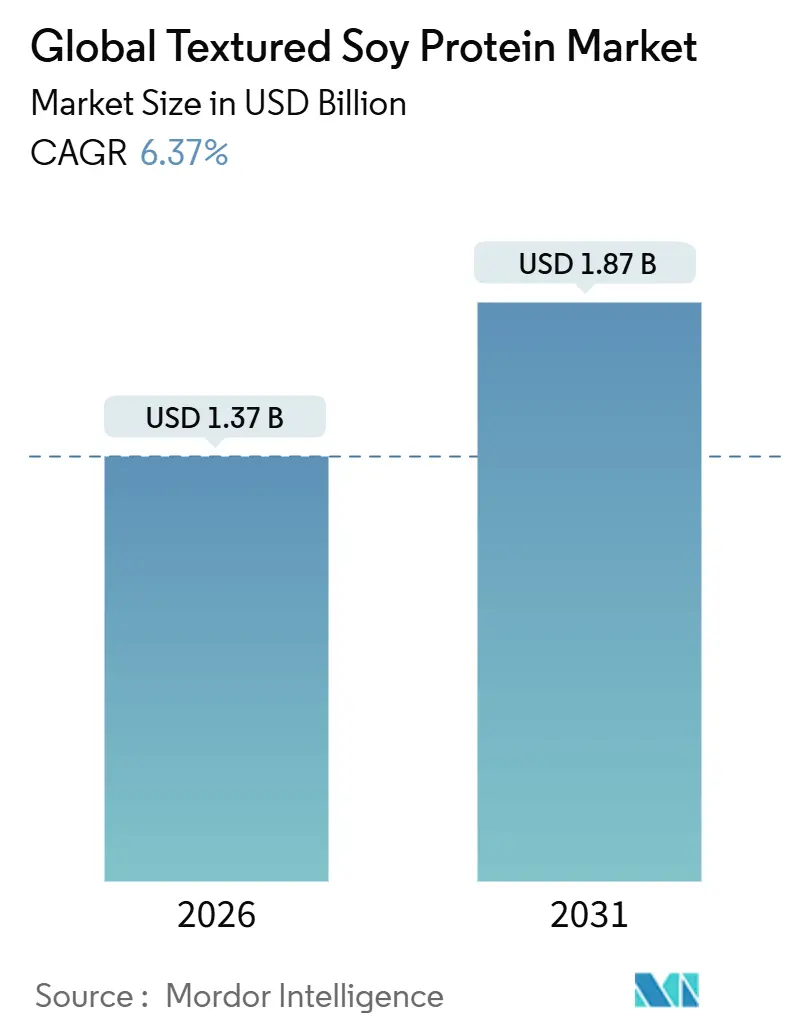
The textured soy protein market, valued at USD 1.37 billion in 2026, is projected to reach USD 1.87 billion by 2031, growing at a CAGR of 6.37%. Clean-label mandates are driving investments in certified organic and non-GMO products, while advancements in twin-screw extrusion technology, operating at around 180°C, are creating fibrous structures that mimic whole-muscle meat, boosting adoption. Processors are expanding Midwest capacity to optimize supply chains, though droughts and transport delays continue to cause input cost volatility. Halal-certified products are unlocking growth in the Middle East, and sustainability policies in Europe, China, and India are promoting soy protein as a low-carbon alternative to animal protein. These factors collectively support steady market growth despite raw material challenges.
Key Report Takeaways
- By type, conventional textured soy protein captured 86.71% of 2025 revenue, while organic is forecast to expand at a 7.81% CAGR through 2031.
- By application, food and beverages held 78.31% of 2025 revenue, and animal feed is projected to advance at an 8.01% CAGR to 2031.
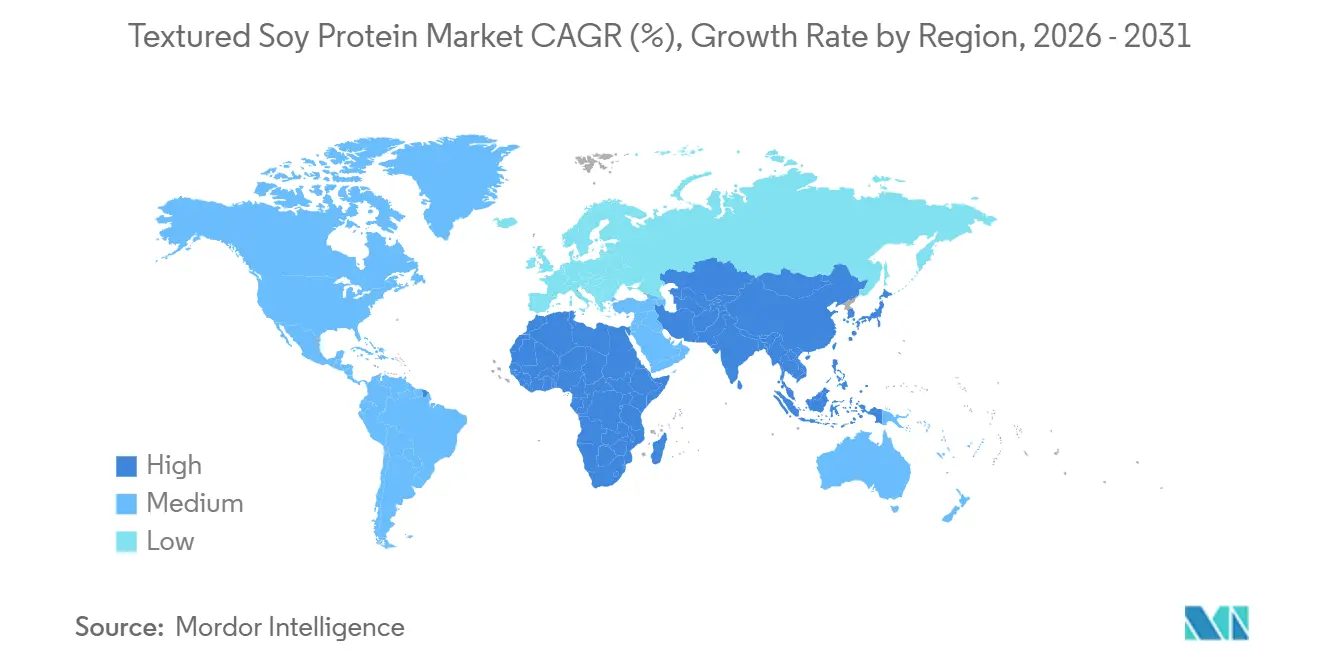
- By geography, North America led with 36.33% of the 2025 revenue base, whereas the Middle East and Africa are predicted to grow at 7.50% CAGR through 2031.
Note: Market size and forecast figures in this report are generated using Mordor Intelligence’s proprietary estimation framework, updated with the latest available data and insights as of January 2026.
Market Trends and Insights
Drivers Impact Analysis of Textured Soy Protein Market*
| Drivers | (~) % Impact on CAGR Forecast | Geographic Relevance | Impact Timeline |
|---|---|---|---|
| Awareness of obesity and chronic diseases drives soy protein demand | +1.2% | Global, with peak intensity in North America and Europe | Medium term (2-4 years) |
| Clean-label and allergen-managed proteins boost textured soy protein's appeal | +1.0% | North America, Europe, and Australia | Short term (≤ 2 years) |
| Broad application in food processing, from ground meat extenders to ready-to-eat meals and snacks | +1.5% | Global, led by Asia-Pacific and North America | Medium term (2-4 years) |
| Extrusion technology improves soy-based analogue textures | +0.9% | Global, with early adoption in North America and Europe | Long term (≥ 4 years) |
| Environmental concerns favor sustainable plant proteins like soy | +1.1% | Europe, North America, and emerging markets in Middle East & Africa | Long term (≥ 4 years) |
| Governments promote alternative proteins for sustainability | +0.8% | Europe (UK, Denmark), Asia-Pacific (China, India), and Middle East | Medium term (2-4 years) |
| Source: Mordor Intelligence | |||
Awareness of Obesity and Chronic Diseases Drives Soy Protein Demand
By 2050, the Lancet Global Burden of Disease study predicts that over 1 billion people globally will grapple with obesity. This trend is steering protein consumption towards lower-fat, plant-based alternatives. Textured soy protein, boasting a protein content of 50% to 70% and minimal saturated fat, is carving a niche as a functional ingredient in processed foods aimed at weight management and heart health. This trend is especially evident in North America and Europe, where public health initiatives and front-of-pack nutrition labels heighten consumer awareness of ingredient choices. The U.S. Department of Agriculture's Dietary Guidelines for Americans advocate for plant protein consumption, subtly endorsing soy-based products in school meals and institutional catering. Moreover, corporate wellness initiatives are embracing plant-centric menus, paving a B2B avenue for textured soy protein in office cafeterias. This suggests that the rising demand isn't just confined to retail but is also making inroads into foodservice and institutional sectors, offering processors a chance for stable revenue through volume contracts.
Clean-Label and Allergen-Managed Proteins Boost Textured Soy Protein's Appeal
The Food and Drug Administration enforces the Food Allergen Labeling and Consumer Protection Act, requiring soy to be clearly labeled as one of the nine major allergens. This regulation enhances transparency and builds trust among consumers managing dietary restrictions. In response, manufacturers are increasingly sourcing identity-preserved soybeans and obtaining third-party certifications like the Non-GMO Project Verified label, which commands a 20% to 30% retail price premium over conventional options. Additionally, the United States Department of Agriculture's National Organic Program standards have created a niche for organic textured soy protein, appealing to consumers who value pesticide-free farming and regenerative agriculture. This regulatory framework has led to a two-tiered market, where conventional products compete on price, while certified offerings target premium segments. To succeed in clean-label positioning, companies must invest in upstream traceability, from seed selection to processing. Those unable to meet these requirements risk margin compression as retailers increasingly demand detailed documentation.
Broad Application in Food Processing, from Ground Meat Extenders to Ready-to-Eat Meals and Snacks
Textured soy protein is widely used across various applications due to its versatility. It acts as a ground meat extender, reducing formulation costs by 15% to 25% while maintaining protein density. It is also a key ingredient in ready-to-eat meals and high-protein snack bars designed for on-the-go consumers. In the processed meat sector, the USDA's Food Safety and Inspection Service permits up to 30% textured vegetable protein in ground beef products labeled "with textured vegetable protein," setting a regulatory standard for blending ratios. In dairy alternatives, textured soy protein improves the body and mouthfeel of plant-based yogurts and cheese analogues, addressing texture challenges that previously limited market growth. For infant nutrition, soy-based formulas meet FDA standards, providing hypoallergenic options for infants with lactose intolerance or galactosemia. Additionally, bakery and snack manufacturers utilize its water-binding properties to extend shelf life and enhance crumb structure in high-protein breads and extruded snacks. This broad range of applications helps stabilize the market against downturns in specific categories but also requires processors to navigate complex and fragmented regulatory requirements, emphasizing the importance of dedicated compliance teams.
Extrusion Technology Improves Soy-Based Analogue Textures
Research by VTT Technical Research Centre of Finland shows that barrel temperatures between 140°C and 180°C, combined with cooling dies, can produce fibrous structures that replicate the anisotropic texture of chicken breast and pork loin[1]Source: VTT Technical Research Centre of Finland, "Extrusion Technology for Plant-Based Proteins", vttresearch.com/en.. Twin-screw extruders, which cost over USD 2 million per production line, provide precise control over shear forces and residence time, key factors in creating the layered protein matrices associated with whole-muscle meat. Thermo Fisher Scientific’s process analytical technology, featuring real-time moisture and temperature sensors, minimizes batch-to-batch variability and reduces off-spec production. These technological advancements are closing the sensory gap that has historically discouraged flexitarians, individuals who reduce but do not eliminate meat, from adopting plant-based alternatives. However, the high capital cost of extrusion equipment limits access for small and medium-sized processors, concentrating production capacity among vertically integrated companies like Archer-Daniels-Midland and Cargill. This indicates that while achieving texture parity with animal protein is possible, it requires significant capital investment and advanced process engineering, favoring financially strong incumbents.
Restraints Impact Analysis of Textured Soy Protein Market*
| Restraint | (~) % Impact on CAGR Forecast | Geographic Relevance | Impact Timeline |
|---|---|---|---|
| Perception as processed "fake meat" reduces appeal for flexitarians | -0.7% | North America, Europe, and Australia | Short term (≤ 2 years) |
| Supply chain issues in soybean sourcing disrupt production and quality | -0.9% | Global, with acute impact in North America and South America | Medium term (2-4 years) |
| Texture differences from real meat deter traditional meat eaters | -0.6% | Global, with peak resistance in North America and Europe | Medium term (2-4 years) |
| Specialized equipment creates production and scalability challenges | -0.5% | Global, particularly affecting small and medium-sized processors | Long term (≥ 4 years) |
| Source: Mordor Intelligence | |||
Perception as Processed "Fake Meat" Reduces Appeal for Flexitarians
Flexitarians, who cut back on meat but don't completely forgo it, are increasingly favoring whole-food ingredients over their highly processed counterparts. This shift in preference poses challenges for textured soy protein formulations, which are often viewed as overly industrial. The label "fake meat" has taken on a negative tone, a sentiment heightened by media discussions linking ultra-processed foods to metabolic disorders. This perception is especially pronounced in North America and Europe, regions where clean-eating advocates champion ingredient transparency and minimalism. In response, manufacturers are streamlining ingredient lists and emphasizing protein density and allergen management on packaging. Despite these efforts, a stigma remains, with many consumers associating processing with a decline in nutritional value. Strategically, this means that product positioning should not only highlight functional benefits like cost-effectiveness and shelf life but also focus on sensory and nutritional qualities that appeal to discerning consumers. Brands that mismanage this balance may find themselves losing ground to less-processed options, such as whole beans, tempeh, or lightly processed legume flours.
Supply Chain Issues in Soybean Sourcing Disrupt Production and Quality
In 2024, drought conditions in the Midwest caused an 8% to 10% reduction in soybean yields, tightening supplies and driving up spot prices for food-grade soybeans, according to the United States Department of Agriculture. Logistical challenges, such as rail congestion and delays on Mississippi River barges, further disrupted deliveries to processing facilities, forcing some manufacturers to use lower-grade beans that reduced protein functionality. The OECD-FAO Agricultural Outlook emphasizes that climate variability is increasing the frequency of yield shocks, impacting contract pricing and inventory management. To address these challenges, processors are diversifying their sourcing by including Brazilian and Argentine origins alongside North American supplies and investing in identity-preserved supply chains to maintain quality standards. However, these strategies come with higher procurement costs and increased working capital requirements, which compress margins during periods of price volatility. This shift highlights that supply-chain resilience is now a critical competitive advantage, and companies without geographic diversification face greater operational risks.
*Our forecasts treat driver/restraint impacts as directional, not additive. The impact forecasts reflect baseline growth, mix effects, and variable interactions.
Textured Soy Protein Market Segment Analysis
By Type:
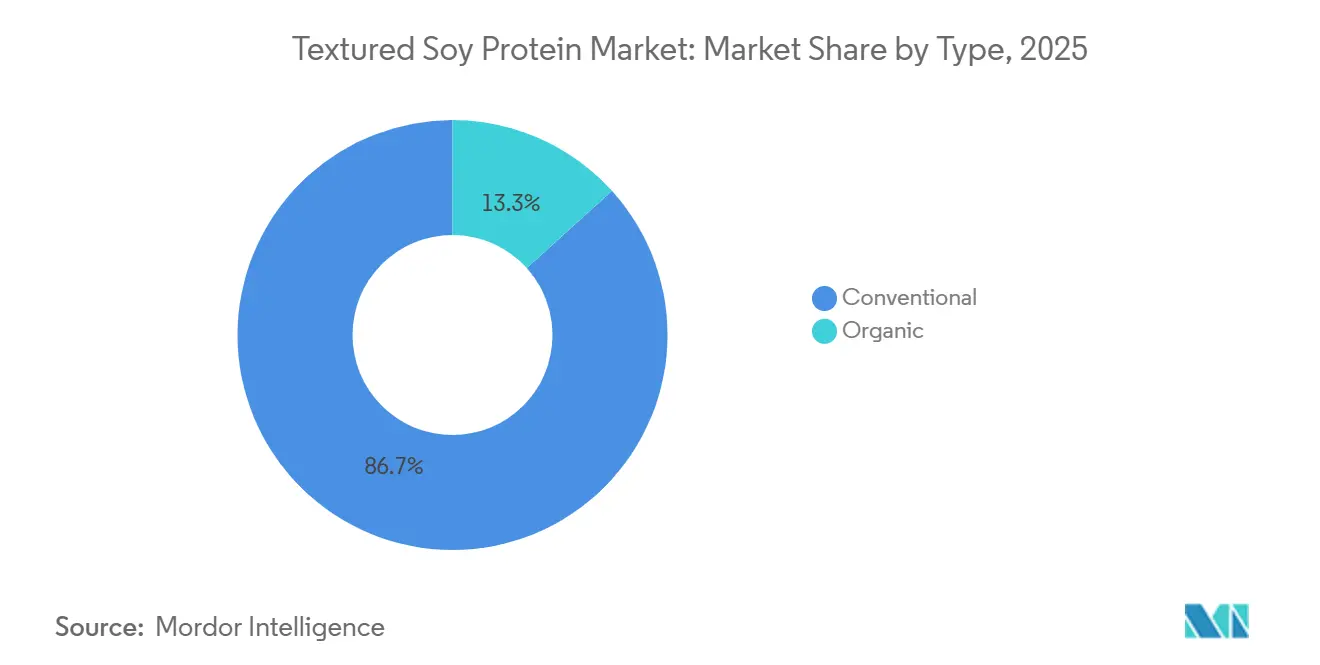
Conventional Dominance Anchored by Cost EfficiencyIn 2025, conventional textured soy protein dominated the market with an 86.71% share, driven by decades of infrastructure investments in North America's Corn Belt and Asia-Pacific's soybean processing hubs. Archer Daniels Midland Company's USD 300 million expansion in Decatur, Illinois, doubled soy protein concentrate capacity, showcasing economies of scale achieved through vertical integration. Conventional variants benefit from established supply chains, consistent agronomic inputs, and regulatory familiarity, enabling processors to deliver quality at 20% to 30% lower costs than organic equivalents. This cost advantage makes them ideal for price-sensitive applications like ground meat extenders and institutional foodservice. Bunge's USD 550 million soy protein concentrate facility in Indiana, operational since mid-2025 and processing 4.5 million bushels annually, highlights the capital investments reinforcing the segment's structural advantages.
Meanwhile, organic textured soy protein, though smaller in share, is projected to grow at a 7.81% CAGR through 2031, driven by USDA organic standards requiring pesticide-free cultivation, non-GMO seeds, and three-year land transitions. Despite 20% to 30% price premiums due to higher input costs and lower yields, health-conscious consumers and premium brands support its growth for clean-label positioning. Retailers like Whole Foods prioritize organic certifications, giving processors with identity-preserved supply chains and third-party audits a distribution edge. While organic textured soy protein remains a niche segment emphasizing value over volume, processors must manage the complexities of dual-track systems to prevent cross-contamination between conventional and organic streams.


By Application:
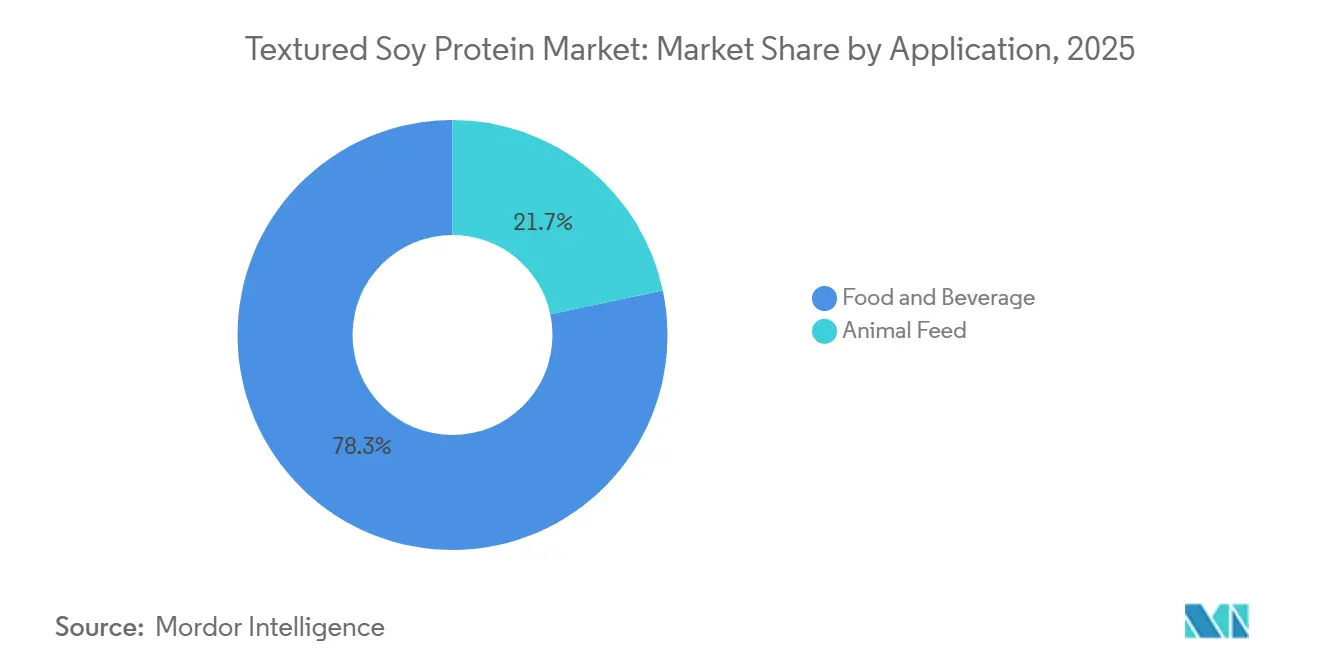
Food and Beverages Lead, Animal Feed AcceleratesIn 2025, the food and beverage sector dominated the market with a 78.31% share, driven by applications such as meat substitutes, dairy alternatives, infant nutrition, bakery products, cereals, and snacks. Meat substitutes, including plant-based burgers and sausages, leveraged textured soy protein for its cost-effective ability to replicate ground meat texture. Regulatory guidelines from the USDA allow up to 30% textured vegetable protein in ground beef, influencing blending and labeling practices. Dairy alternatives, like soy-based yogurts and cheese substitutes, used textured soy protein to improve viscosity and mouthfeel, addressing past sensory challenges. Infant nutrition, governed by strict FDA standards, catered to lactose-intolerant or galactosemic infants with hypoallergenic formulations, representing a high-value but low-volume segment. Textured soy protein also enhanced shelf life and crumb structure in high-protein breads and snacks, while cereals incorporated it as a protein fortifier for health-conscious consumers.
Meanwhile, the animal feed segment, though smaller, is projected to grow at an 8.01% CAGR through 2031, fueled by aquaculture expansion in Southeast Asia and poultry producers seeking cost-effective protein alternatives amid volatile fishmeal prices. In 2024, global aquaculture production reached 130.9 million tonnes, with soy protein meal increasingly replacing fishmeal in diets for tilapia, catfish, and shrimp[2]Source: Food and Agriculture Organization of the United Nations, "FAO Report: Global fisheries and aquaculture production reaches a new record high", fao.org. Poultry and swine producers also adopted textured soy protein to reduce reliance on imported fishmeal and soybean meal, especially in regions affected by currency depreciation. This shift in livestock nutrition, favoring plant proteins over marine-derived ingredients, has intensified competition for soybean feedstock, which also serves human food applications. During harvest shortfalls, processors prioritize supply allocation based on margins and contracts. Strategically, animal feed offers a high-volume, lower-margin opportunity that absorbs excess capacity during weak food demand, mitigating cyclical downturns in consumer-facing sectors.
Geography Analysis
North America Textured Soy Protein Market
In 2025, North America held a 36.33% market share, driven by vertically integrated processors, favorable soybean agronomics, and mature distribution networks. Key developments included Bunge's USD 550 million soy protein concentrate facility in Indiana, processing 4.5 million bushels annually, and Archer Daniels Midland Company's USD 300 million expansion in Decatur, Illinois, which doubled production capacity. The U.S., with the world's largest soybean harvest averaging 120 million metric tonnes annually, benefits from clear regulatory frameworks like FDA allergen labeling and USDA organic standards. Canada is emerging as an export-oriented hub, supported by Protein Industries Canada's CA 23.9 million investment in Ontario's soy processing infrastructure. However, drought in 2024 caused an 8% to 10% decline in soybean output, raising input costs and limiting margins.
Europe, APAC and South America Textured Soy Protein Market
Europe and Asia-Pacific are growing steadily, with China's urbanization boosting protein consumption and India's vegetarian population driving demand for affordable meat alternatives. China's 14th Five-Year Plan promotes alternative proteins to reduce pork imports, while India's National Mission on Sustainable Agriculture supports soybeans as climate-resilient crops. Japan's aging population is shifting demand toward plant-based proteins, with companies like DAIZ launching textured soy protein products. Europe's Farm to Fork Strategy, with EUR 10 billion for sustainable food systems, supports plant proteins, though fragmented supply chains and low soybean production limit self-sufficiency. South America, led by Brazil and Argentina, remains a major soybean exporter but lacks significant value-added processing capacity.
MEA Textured Soy Protein Market
The Middle East and Africa are projected to grow at a 7.50% CAGR through 2031, driven by halal-certified plant proteins in Saudi Arabia and the UAE. Saudi Arabia's Vision 2030 emphasizes domestic protein production, while the UAE attracts multinational investments targeting local and re-export markets. Halal certification adds a unique compliance factor, and South Africa's nascent plant-based sector is growing as urban consumers adopt flexitarian diets. Early movers with halal-certified production and distribution partnerships can capture market share, though infrastructure gaps and reliance on imported feedstock pose challenges.

Regulatory Landscape
Textured soy protein is treated primarily as a conventional food ingredient, so compliance is anchored in food safety controls and mandatory labeling. In the United States, FDA oversight under the FD&C Act and FSMA Preventive Controls for Human Food (21 CFR Part 117) sets manufacturing expectations, and the Food Allergen Labeling and Consumer Protection Act requires soy to be clearly declared as one of the major allergens. A near-term compliance variable is FDA activity around the GRAS pathway, with the July 2026 Unified Regulatory Agenda (RIN 0910-AJ02) outlining a proposed rule that introduces a mandatory premarket notification concept for certain uses currently treated as GRAS. This would increase documentation and review burden for novel process or use cases tied to soy-derived ingredients.
In Europe, textured soy protein placed on the market must comply with Regulation (EU) 1169/2011 for allergen disclosure and operate under HACCP-based hygiene rules (Regulation (EC) 852/2004). Where GMO soy is used, additional traceability and labeling obligations under Regulations (EC) 1829/2003 and 1830/2003 apply, reinforcing the operational need for identity-preserved supply chains for non-GMO claims. Japan applies Japanese Agricultural Standards (JAS), which set product definition requirements including minimum soy protein content thresholds and expectations around meat-like texture forms, shaping product specification, testing, and the import documentation needed for textured soy protein products.
Value Chain Analysis
The textured soy protein value chain starts with soybean cultivation and origination, followed by crushing and defatting to produce inputs such as defatted soy flour. Processing then moves into thermo-mechanical extrusion and downstream drying, sizing, and packaging to create textured formats for meat extenders, ready-to-eat meals, snack applications, and feed uses. Midstream processing is capital intensive, with twin-screw and high-moisture extrusion lines acting as major fixed-cost nodes; energy use during thermomechanical cooking and drying is a meaningful cost lever, while quality management centers on protein functionality targets, moisture control, and allergen-management programs. Scale players that combine origination, crushing, and ingredient processing can therefore tighten cost and quality variability across lots.
Distribution typically follows direct B2B supply into food manufacturers and via specialty ingredient distributors, with technical-service support focused on hydration, binding, and texture performance in customer formulations. Bottlenecks tend to cluster around identity-preserved non-GMO and organic feedstock (including co-mingling risk and limited dedicated acreage), logistics and lead times in import-dependent markets, and access to specialized extrusion capacity. Recent industry activity points to integration and capability building within the chain, including Bunge’s USD 550 million Morristown, Indiana investment (designed to process 4.5 million bushels annually for soy protein concentrate and textured soy protein concentrate) and ICL Food Specialties’ work with DAIZ Engineering on germination-based textured soy protein (ROVITARIS SprouTx), reflecting a shift toward differentiated specialty grades supported by process know-how and application-led innovation.
Competitive Landscape
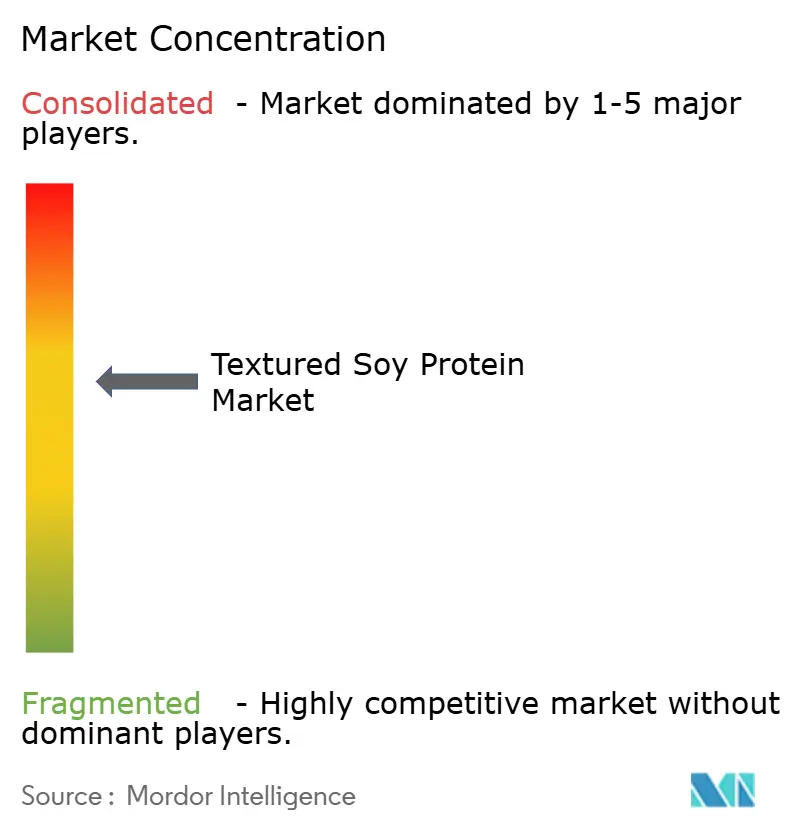
The textured soy protein market is moderately consolidated, with a limited number of global ingredient manufacturers holding a significant share alongside several regional processors and specialty suppliers. Large players benefit from integrated soy sourcing, advanced extrusion capabilities, and long-standing relationships with food manufacturers, particularly in meat analogues and processed food applications. Players like Archer Daniels Midland Company, Cargill, Incorporated, Bunge Global SA, International Flavors & Fragrances Inc., and Victoria Group dominate the market. Their scale and technical expertise allow them to deliver consistent quality, customized textures, and reliable supply, strengthening their competitive position across global markets.
Regional and mid-sized players contribute to competitive diversity by focusing on specific applications, local customer needs, or differentiated offerings such as non-GMO and organic textured soy proteins. These companies often serve regional food manufacturers and foodservice customers, leveraging shorter supply chains and application support to compete effectively against multinational suppliers. Their flexibility in formulation and batch sizes enables them to address niche requirements, especially in plant-based and hybrid meat products.
Competition in the textured soy protein market is increasingly driven by functionality, sustainability credentials, and application performance rather than price alone. Leading companies are investing in high-moisture extrusion, improved texturization technologies, and cleaner label solutions to meet evolving plant-based protein demand. While strategic partnerships and selective acquisitions are strengthening the positions of larger players, the continued presence of regional specialists sustains the market’s moderately consolidated structure.
Textured Soy Protein Industry Leaders
-
Cargill, Incorporated
-
Bunge Global SA
-
International Flavors & Fragrances Inc.
-
Victoria Group
-
Archer Daniels Midland Company
- *Disclaimer: Major Players sorted in no particular order
Textured Soy Protein Market Companies Covered in this Report
- Archer-Daniels-Midland Company
- Cargill, Incorporated
- Wilmar International Limited
- Bunge Global SA
- CHS Inc.
- Crown Soya Protein Group
- Sonic Biochem
- Victoria Group
- Bremil Group
- International Flavors & Fragrances Inc.
- Shandong Yuxin Biotechnology
- Sojaprotein Novi Sad
- Gushen Biological Technology
- Fuji Oil Co., Ltd.
- Shandong Sanwei Soy Protein
- Beneo (Germany)
- Top Agri Group
- Wonderful Industrial Group
- The Scoular Company
- Kansas Protein Foods
- Foodchem International Corp.
- Axiom Foods Inc.

Market Opportunities and Future Outlook
Capacity additions and integration in soy protein processing are creating room for more consistent textured-format supply and for regional sourcing models that reduce lead times for manufacturers. Bunge’s May 2026 opening of its Morristown, Indiana fully integrated soy protein concentrate and textured soy protein concentrate facility (USD 550 million; 4.5 million bushels annual processing capacity) provides a tangible base for expanding domestic and export availability into plant-based foods, processed meat, pet food, and feed channels. It also strengthens the case for long-term supply agreements where customers want tighter traceability and fewer logistics disruptions. In Europe, new processing capacity additions such as Bankom’s Serbia expansion, completed in July 2026 and adding a textured soy protein facility (20,000 tonnes annual capacity), also indicate demand for closer-to-market production that can serve regional customers and reduce dependence on long trans-Atlantic supply routes.
Differentiation in product and portfolio is a practical opportunity alongside volume expansion, especially for manufacturers targeting cleaner labels, improved sensory performance, and compliance-ready claims. ICL Food Specialties and DAIZ Engineering’s ROVITARIS SprouTx, a germination-based textured soy protein, highlights an innovation pathway built around process-enabled functionality rather than additive-heavy masking, which can support premium meat-analogue and hybrid-meat formulations. Regulatory change adds another focus area for suppliers that can provide stronger substantiation packages, including expectations for premarket documentation in some ingredient use cases tied to FDA’s 2026 GRAS rulemaking activity, and the way EU GMO traceability rules continue to reward identity-preserved non-GMO supply chains for retailers seeking strict labeling.
Recent Industry Developments in Textured Soy Protein Market
- May 2026: Bunge held a ribbon-cutting and opened its USD 550 million fully integrated soy protein concentrate and textured soy protein concentrate facility in Morristown, Indiana. The plant is designed to process about 4.5 million bushels of soybeans annually, strengthening North American supply availability for plant-based foods, processed meat, pet food, and feed formulations.
- March 2026: Bunge completed the acquisition of International Flavors & Fragrances Inc. soy protein concentrate, lecithin, and crush businesses, including the Response, Alpha, Procon, and Solec brands. The combination consolidates key soy-ingredient assets under Bunge and can simplify sourcing for customers that buy across soy protein and lecithin portfolios.
- November 2024: ICL Food Specialties and DAIZ launched ROVITARIS SprouTx, a textured soy protein produced from germinated soybeans. The launch signaled a move toward differentiated, process-driven soy textures aimed at premium plant-based meat applications where taste and nutrition positioning influence ingredient selection.


Textured Soy Protein Market Report Scope and Research Methodology
Market Definition and Coverage
For this methodology, the market covers revenue generated from textured soy protein used as an ingredient, mainly produced through extrusion from defatted soy inputs and sold into food and feed value chains across all major regions.
Scope exclusions: We exclude finished retail meat-alternative products and foodservice menu sales, and we count only the textured soy protein ingredient value at the point it is sold by the supplier.
Segments Covered in This Report
-
Type
- Conventional
- Organic
-
Application
-
Food and Beverages
- Meat Substitutes
- Dairy Alternatives
- Infant Nutrition
- Bakery Products
- Cereal and Snacks
- Other Food Applications
- Animal Feed
-
Food and Beverages
-
Geography
-
North America
- United States
- Canada
- Mexico
- Rest of North America
-
Europe
- Germany
- United Kingdom
- Italy
- France
- Rest of Europe
-
Asia-Pacific
- China
- India
- Japan
- Australia
- Rest of Asia-Pacific
-
South America
- Brazil
- Argentina
- Colombia
- Rest of South America
-
Middle East and Africa
- South Africa
- Saudi Arabia
- United Arab Emirates
- Rest of Middle East and Africa
-
North America
Data Sources, Market Sizing, and Validation
Desk Research
Desk work starts with building a fact base on soybean availability, processing, and downstream usage so our assumptions stay realistic. We rely on public sources such as FAOSTAT for soybean supply trends, USDA oilseeds and meal balance sheets, and UN Comtrade trade flows to understand where textured soy proteins and related soy materials are moving.
We also review sources such as Codex Alimentarius and major food labeling rules to understand how textured soy protein is described in ingredient statements, which helps avoid mixing it with finished plant-based foods. Where it improves company and product mapping, we use annual reports, investor presentations, and credible press coverage, and then we cross-check product claims with patent databases for extrusion and texturization activity. For trade and pricing direction, we refer to import or export shipment-level databases when coverage is available for the right HS codes and descriptions. The sources listed here are illustrative, and many other public documents were reviewed to collect, verify, and clarify data points.
Primary Interviews and Surveys
Primary work is used to pressure-test volumes, pricing behavior, and what buyers actually count as textured soy protein in contracts. We spoke with a mix of ingredient suppliers, distributors, and end users, including food formulators and feed buyers, across APAC, EMEA, and the Americas. These inputs were used to fill gaps in application splits and to validate the final model assumptions.
Distribution of primary research fieldwork respondents
| Company type | Respondent position | Region |
|---|---|---|
| Top tier: 29% | CXOs: 20% | APAC: 38% |
| Mid tier: 49% | Functional/Unit leaders: 38% | EMEA: 37% |
| Smaller Players: 22% | Managers: 42% | Americas: 25% |
Market-Sizing & Forecasting
Our sizing starts from a top-down build where soy processing output signals, trade direction, and end-use penetration are used to reconstruct the demand pool for textured soy protein by region. We then derive values through realistic price bands. Once those totals are in place, we corroborate them with selective bottom-up checks, including supplier revenue sanity checks, channel discussions on typical contract pricing, and a sampled volume x average selling price approach for key applications.
Key model inputs include soybean meal and defatted soy material availability, extrusion capacity utilization cues shared by processors, the share of plant-based product reformulations using textured formats, feed inclusion trends for protein enrichment, and average selling price movement tied to soy input costs and specification premiums (for example, organic positioning). Where data is thin for smaller countries, we bridge gaps using regional per-capita consumption proxies and trade-linked availability, then adjust based on interview feedback so outliers do not inflate totals.
For forecasting, we use scenario analysis because the market is sensitive to raw material price swings and the pace of new product launches. We project base demand using expected plant-based adoption and food manufacturing growth, then apply conservative and faster scenarios based on how quickly buyers switch formulations. These scenarios are subsequently checked against what interviewees expect on contracts and capacity expansion timing.
Data Validation & Update Cycle
Validation is done through repeated cross-checks across independent signals, followed by an analyst review so assumptions remain internally consistent. We compare outcomes against trade patterns, soy processing indicators, and application-level demand cues, and then we investigate any step-changes in pricing or regional shares before final sign-off.
The model is re-checked when interviews point to a material change, such as a sudden shift in organic premiums, a new capacity line, or an abrupt trade disruption. Reports are refreshed annually, and interim updates are made when major events change demand or supply conditions. Before delivery, a final review pass is completed so clients receive a current view rather than an older snapshot.
Mordor Intelligence's Global Textured Soy Protein Market Sizing Compared With Other Published Estimates
Published market sizes for textured soy protein can look far apart because the boundary is not always set in the same way, and pricing assumptions are handled differently across studies. The biggest differences usually come from whether the number represents the ingredient supplier market only, or whether it also includes the value of finished plant-based foods where textured soy protein is just one component.
Method choices also matter, including how organic and conventional pricing are blended, whether animal feed usage is counted, and which year of currency conversion is applied for global totals. By tracking extrusion-driven textured soy ingredient sales and refreshing the price band inputs through interviews, Mordor Intelligence keeps the total anchored to ingredient-level demand instead of mixing in retail product markups.
Benchmark comparison
| Source | Market Size | Gaps in Research Methodology |
|---|---|---|
| Mordor Intelligence | USD 1.37 B (2026) | |
| Industry Publisher A | USD 3.84 B (2025) | Uses a broader definition that can blend textured soy protein with adjacent textured vegetable protein values and may apply a different pricing layer closer to finished product realization, which lifts the reported total. |
| Market Tracker B | USD 2.39 B (2026) | Leans on a faster-growth base case and a wider application net, with limited visibility on how feed use and cross-border trade adjustments are normalized, which can shift regional roll-ups. |
The spread in the table is mainly explained by scope boundaries and how value is counted along the chain, rather than a disagreement that demand exists. When the estimate is tied to clear ingredient sales, checked with trade and processing signals, and adjusted through realistic price bands, the result stays easier to replicate and to use for planning.


Key Questions Answered in the Report
What is the projected value of the textured soy protein market by 2031?
It is expected to reach USD 1.87 billion by 2031, reflecting a 6.37% CAGR over 2026-2031.
Which application currently dominates demand for textured soy protein?
Food and beverages account for 78.31% of 2025 revenue due to widespread use in meat substitutes, dairy alternatives, and bakery products.
Why is organic textured soy protein growing faster than conventional variants?
USDA Organic certification meets consumer demand for pesticide-free and non-GMO ingredients, letting brands charge 20-30% price premiums and driving a 7.81% CAGR through 2031.
Which region is forecast to register the fastest growth?
The Middle East and Africa are set to expand at a 7.50% CAGR as halal-certified plant proteins gain policy and consumer support.
Page last updated on:


 Your data is secure and never sold or shared.


