Textile Machinery Market Size and Share
Market Overview
| Study Period | 2020 - 2031 |
|---|---|
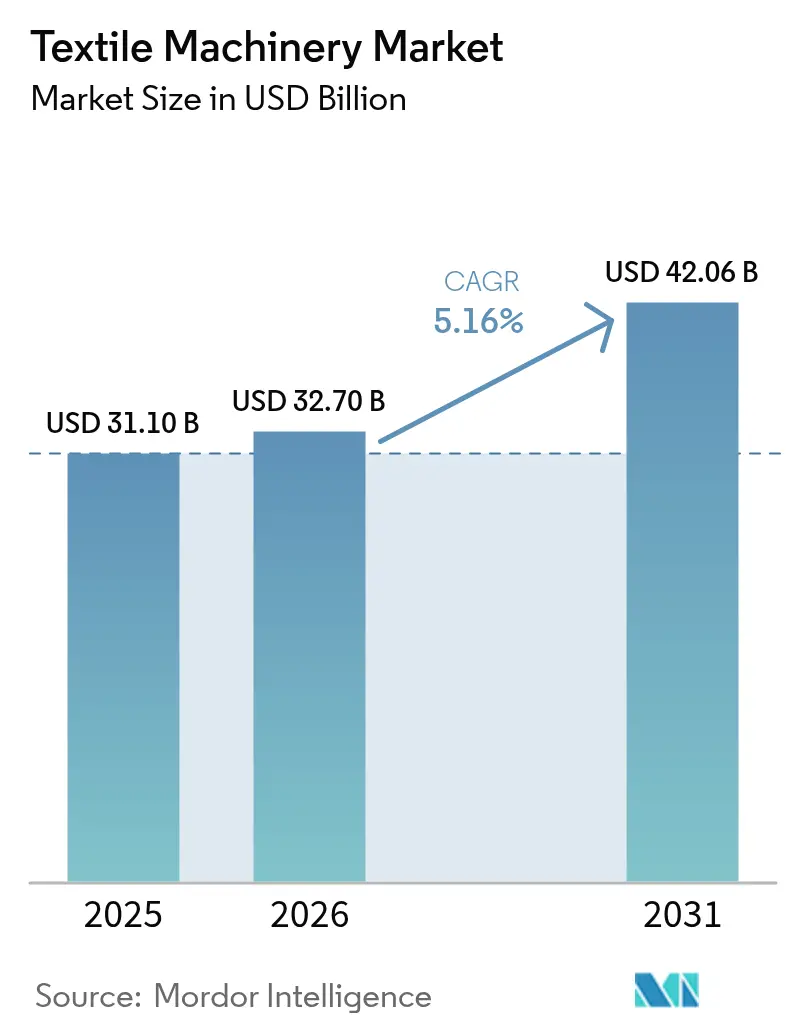
| Market Size (2026) | USD 32.70 Billion |
| Market Size (2031) | USD 42.06 Billion |
| Growth Rate (2026 - 2031) | 5.16% CAGR |
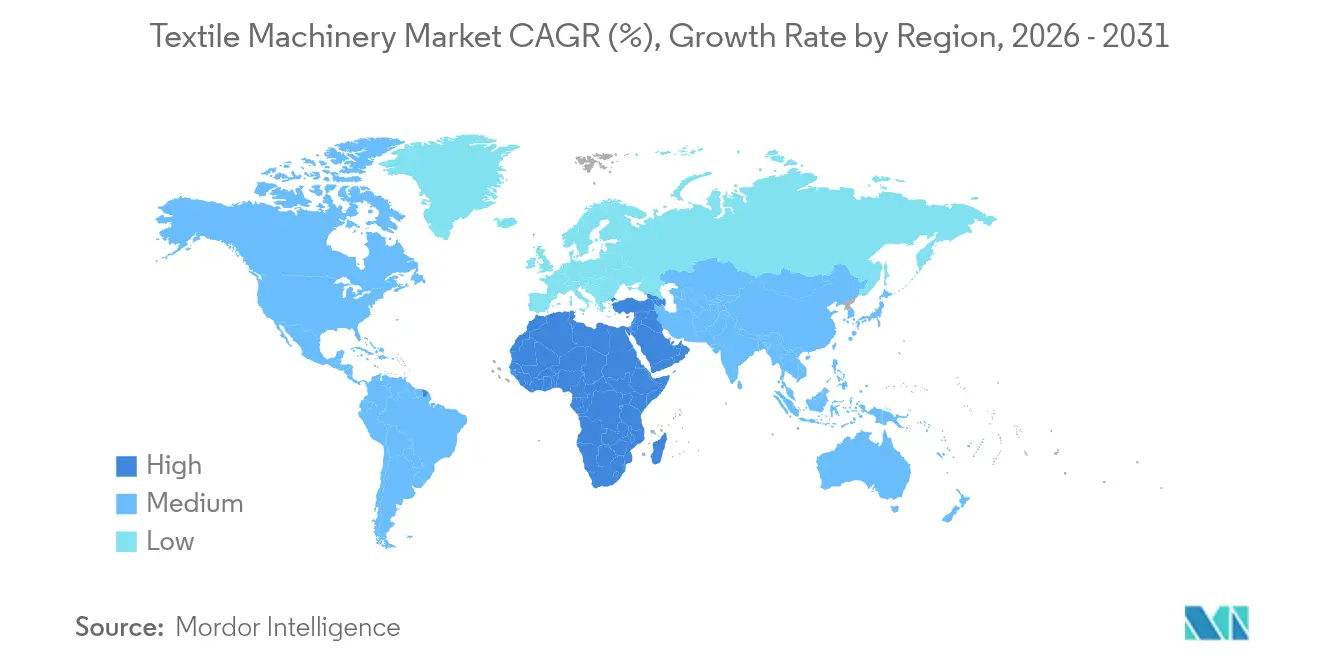
| Fastest Growing Market | Middle East and Africa |
| Largest Market | Asia-Pacific |
| Market Concentration | Low |
Major Players
*Disclaimer: Major Players sorted in no particular order Image © Mordor Intelligence. Reuse requires attribution under CC BY 4.0. |
|
Textile Machinery Market Analysis by Mordor Intelligence
The textile machinery market size was valued at USD 31.10 billion in 2025 and estimated to grow from USD 32.70 billion in 2026 to reach USD 42.06 billion by 2031, at a CAGR of 5.16% during the forecast period (2026-2031). Mills are accelerating smart-factory retrofits that install AI sensors able to cut unplanned downtime by up to 35% and lengthen spindle life by 18 months, raising equipment utilization and pushing new-build specifications toward full digital connectivity. Demand is shifting from basic spinning frames toward texturing, finishing, and other specialty lines that support recycled polyester and high-performance synthetic fabrics for athleisure and electric-vehicle battery components. Asia-Pacific purchasers continue to anchor more than half of global shipments, yet the Middle East and Africa now post the fastest order growth as large financing programs back regional yarn-to-fabric ecosystems. Competitive dynamics are intensifying because Chinese manufacturers are localizing assembly to trim landed costs while European peers consolidate to defend margins.
Key Report Takeaways
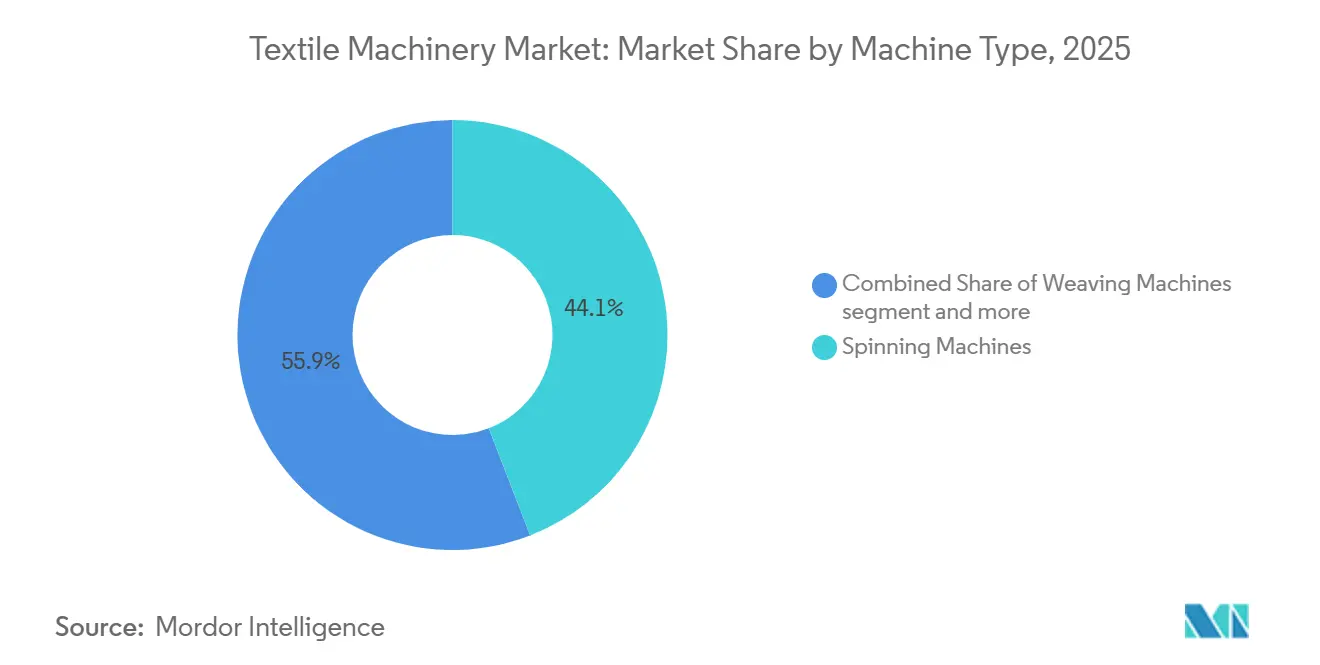
- By machine type, spinning led with 44.10% of the textile machinery market share in 2025, while specialty equipment is projected to expand at a 6.66% CAGR through 2031.
- By automation level, semi-automatic systems commanded 43.05% of the 2025 value within the textile machinery market size, while fully automatic lines are projected to expand at a 6.78% CAGR through 2031.
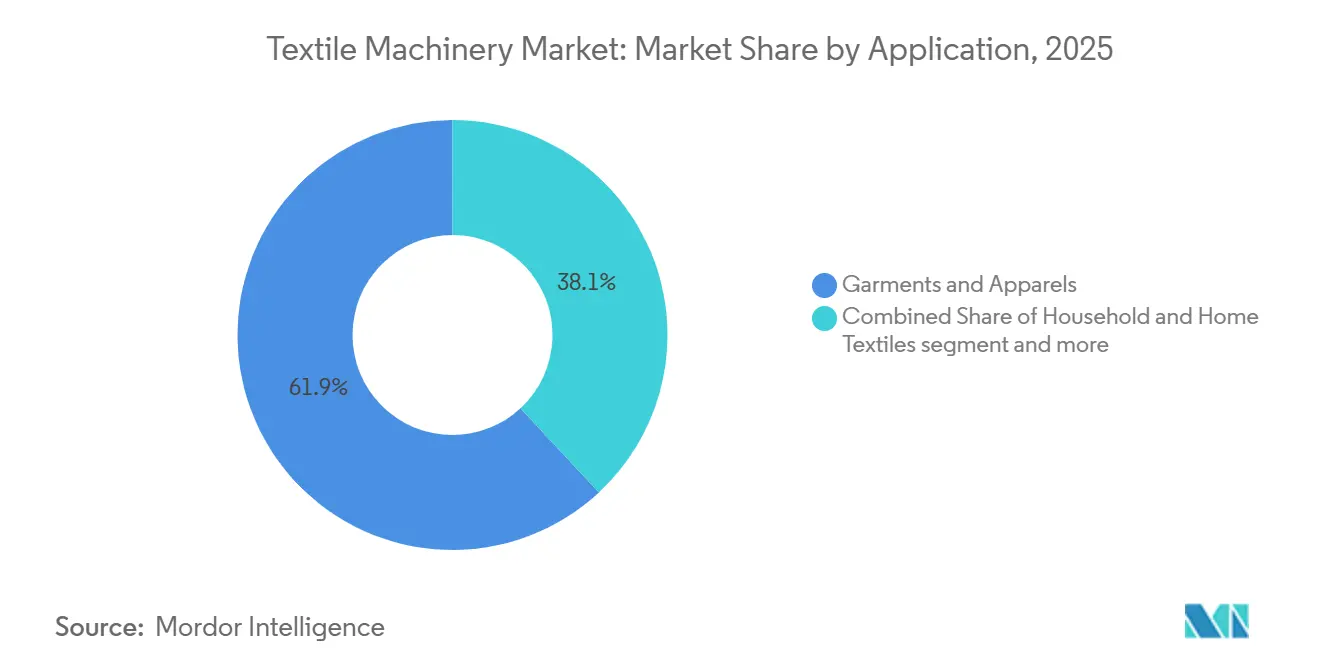
- By application, garments and apparel led with 61.92% of the textile machinery market share in 2025, while technical textiles are projected to expand at a 6.55% CAGR through 2031.
- By raw material, synthetic-fiber processing led with 60.10% of the textile machinery market share in 2025, while the segment is projected to expand at a 5.98% CAGR through 2031.
- By geography, Asia-Pacific led with 55.10% of the textile machinery market share in 2025, while the Middle East and Africa are projected to expand at a 6.31% CAGR through 2031.
Note: Market size and forecast figures in this report are generated using Mordor Intelligence’s proprietary estimation framework, updated with the latest available data and insights as of 2026.
Global Textile Machinery Market Trends and Insights
Drivers Impact Analysis*
| Drivers | (~) % Impact on CAGR Forecast | Geographic Relevance | Impact Timeline |
|---|---|---|---|
| Smart-factory retrofits with AI predictive maintenance | +1.2% | Global, with early adoption in China, India, Germany | Medium term (2-4 years) |
| South-Asian CAPEX subsidies accelerating adoption | +1.1% | India, Bangladesh, Vietnam, Indonesia | Short term (≤ 2 years) |
| Synthetic-fiber texturing boom (sports & athleisure) | +0.9% | Asia-Pacific, North America, Europe | Short term (≤ 2 years) |
| Technical-textile capacity for EVs & filtration | +0.8% | China, Germany, United States, South Korea | Medium term (2-4 years) |
| Near-shoring demand for quick-change automated lines | +0.6% | Mexico, Central America, Eastern Europe, Turkey | Medium term (2-4 years) |
| Closed-loop fiber-to-fiber recycling equipment | +0.4% | Europe, North America, Japan | Long term (≥ 4 years) |
| Source: Mordor Intelligence | |||
Smart-Factory Retrofits with AI Predictive Maintenance
Textile mills are embedding vibration, temperature, and amperage sensors into spinning frames, looms, and knitting machines, then linking the data to cloud algorithms that alert maintenance staff days before a fault occurs. Institute of Electrical and Electronics Engineers (IEEE) case studies show these systems reduce unscheduled stoppages by 35% and push bearing and spindle components to last an extra 12-18 months.[1]IEEE. "Predictive Maintenance for Textile Machinery Using AI and IoT." IEEE Xplore, 2023 Adoption is fastest in China and India, where labor costs and electricity tariffs climb 8-12% per year, making uptime critical to cost control. European Original Equipment Manufacturers (OEMs) now bundle monitoring software with new equipment, but subscription fees of USD 5,000–10,000 per machine limit penetration in price-sensitive mills. The retrofit wave is splitting the installed base between digitally connected assets that command premium lease rates and legacy lines that depreciate faster because buyers demand uptime guarantees.
South-Asian CAPEX Subsidies Accelerating Adoption
India’s Production-Linked Incentive program has earmarked USD 1.3 billion for technical textiles and another USD 540 million for seven integrated parks, reimbursing a portion of machinery costs when output or export targets are met. Bangladesh extended a 15% cash incentive on textile exports through mid-2026, and Vietnam offers three-percent interest loans for imported machinery. These subsidies pull orders forward because mills rush to commission equipment before support windows close, which in turn creates periodic production bottlenecks at OEM plants. Local-content rules steer Indian buyers toward Rieter and Lakshmi Machine Works, while Bangladeshi mills often turn to discounted second-hand European lines to stretch limited credit.[2]Press Information Bureau, Government of India. "Production Linked Incentive Scheme for Textiles." PIB, March 2024
Synthetic-Fiber Texturing Boom (Sports & Athleisure)
Global athleisure sales continue to outpace broader apparel, prompting mills to install polyester and nylon texturing lines that deliver moisture-wicking, stretch, and antimicrobial properties. Rieter’s J 70 air-jet spinning system, installed at Guangxi Baisheng in 2024, runs 200 automated units at 600 meters per minute and highlights the push for finer deniers used in seamless sportswear. The International Textile Manufacturers Federation reported an 11% jump in synthetic-fiber shipments to Asia in 2024, with texturing machinery the fastest-growing subcategory. Equipment makers also benefit from recycled PET feedstock that meets brand sustainability targets, although fiber-to-fiber recycling still sits below 1% of total secondary material use. International Association for Research and Testing in the Field of Textile and Leather Ecology (OEKO-TEX) compliance has become a default requirement, adding audit costs but differentiating certified suppliers.[3]Circle Economy. "Textiles." Presentation via World Trade Organization, March 11, 2025
Technical-textile Capacity for EVs & Filtration
Automotive producers now specify nonwoven separators, acoustic insulation, and filtration media that comply with stricter flame-retardant and thermal-shock norms, driving orders for spunbond, melt-blown, and needle-punch lines. Groz-Beckert noted that felting-needle demand linked to battery-separator lines doubled during 2024. ANDRITZ commissioned three spunlace installations at Alar Silk Road in 2025, each running above 600 meters per minute, underscoring the capital intensity of technical-textile projects that can exceed USD 25 million per line. Margins in these applications run 12-18 percentage points higher than commodity fabrics, a spread that continues to lure Chinese and Indian conglomerates. EU rules mandating 95% recyclability of vehicles by 2030 further reinforce long-term growth in this niche.[4]TexData International. "TexData International - all significant news along the textile value chain." TexData International, 2026
Restraints Impact Analysis*
| Restraints | (~) % Impact on CAGR Forecast | Geographic Relevance | Impact Timeline |
|---|---|---|---|
| High CAPEX & payback uncertainty | -0.8% | South Asia, Sub-Saharan Africa, Latin America | Short term (≤ 2 years) |
| Second-hand equipment glut in price-sensitive markets | -0.6% | Bangladesh, Pakistan, Sub-Saharan Africa, Central America | Short term (≤ 2 years) |
| Tariff/export-control risk on precision components | -0.5% | United States, European Union, China | Medium term (2-4 years) |
| Shortage of digitally skilled operators | -0.4% | South Asia, Southeast Asia, Sub-Saharan Africa | Medium term (2-4 years) |
| Source: Mordor Intelligence | |||
High CAPEX and Payback Uncertainty
Fully automated spinning or knitting lines can cost USD 2–5 million, and mills often wait five or more years to recover the outlay once training, software, and spare parts are included. Second-hand machinery imported from Europe or Japan sells at 30–40% discounts, providing a cheaper alternative that competes head-on with new sales. Rieter’s 2025 order intake fell to USD 630 million as clients deferred spending during currency swings and higher energy tariffs that stretched payback models. Electricity costs that doubled in Turkey and Egypt between 2023 and 2025 further lengthen the return period on energy-efficient equipment. OEMs are piloting lease-to-own contracts tied to real-time uptime, yet lenders still lack a clear risk model for performance-based deals.
Second-hand Equipment Glut in Price-sensitive Markets
As European textile mills upgrade to Industry 4.0 automation, they supply a robust secondary market with depreciated, highly durable legacy machinery. Manufacturers in price-sensitive emerging markets eagerly absorb these assets to minimize upfront Capital Expenditure, prioritizing discounted European tier-one equipment over new, lower-cost alternatives. However, these immediate capital savings are eventually offset by inflated Operational Expenditure due to decreased energy efficiency and increased downtime. Consequently, this secondary market cannibalizes new Original Equipment Manufacturer (OEM) equipment sales while forcing manufacturers to maintain margin-diluting legacy supply chains.
*Our forecasts treat driver/restraint impacts as directional, not additive. The impact forecasts reflect baseline growth, mix effects, and variable interactions.
Segment Analysis
By Machine Type: Spinning Dominance Amid Diversification
Spinning equipment captured 44.10% of 2025 revenue in the textile machinery market, reflecting the core role of ring and rotor frames across global yarn production. The other machine types bracket, which houses texturing, finishing, and specialty systems, will outpace all peers at a 6.66% CAGR to 2031. This growth links directly to performance sportswear, recycled polyester demand, and EV battery separator lines that need precise texturing control.
Rieter’s J 70 air-jet installation in Guangxi shows why mills gravitate toward higher speed and labor-saving attributes, while weaving and knitting OEMs emphasize quick pattern-change capabilities that align with near-shoring requirements in Mexico and Turkey. Specialty finishing suppliers gain share by integrating zero-liquid-discharge modules that meet water scarcity regulations in India and China.


By Automation Level: Semi-Automatic Leads, Fully Automatic Surges
Semi-automatic systems held 43.05% of 2025 revenue, proving attractive in regions where wages stay below USD 3 per hour. Fully automatic lines, however, will post a 6.78% CAGR through 2031, powered by mills chasing higher output per worker under persistent labor shortages. IEEE data confirm that predictive-maintenance algorithms built into these smart lines can extend component life by 18 months and cut downtime by 35%.
African and Latin American buyers still choose semi-automatic models due to simpler skills requirements, yet export-oriented Chinese and Indian plants are retrofitting sensors to meet ISO 9001 traceability rules. Subscription pricing for condition-monitoring suites remains a hurdle but is slowly easing as OEMs package software within multi-year service contracts.
By Application: Garments Anchor Demand, Technical Textiles Outpace
Garments and apparel accounted for 61.92% of 2025 revenue, sustaining the largest slice of the textile machinery market share. Technical textiles, although smaller, will climb at a 6.55% CAGR through 2031 as automakers adopt nonwoven separators and filtration media that comply with Underwriters Laboratories (UL) 94 and International Organization for Standardization (ISO) 16750. These lines often fetch margins up to 18 percentage points above commodity fabrics and require cleanroom operation that lifts capital per ton but also raises entry barriers.
Household textiles face compressed spreads as import competition intensifies, whereas technical textile suppliers win regulatory tailwinds that favor value-added products with verified recyclability content. Investments continue to flow into spunbond and melt-blown assets across China and Germany, responding to the battery-separator boom linked to electric vehicles.
By Raw Material: Synthetics Lead, Natural Fibers Stabilize
Synthetic-fiber machinery processed 60.10% of textile throughput in 2025 and will sustain the highest absolute contribution on a 5.98% CAGR. Polyester dominates because of its low cost and abundant recycled Polyethylene Terephthalate (PET) feedstock, which now covers 95% of secondary input in textiles. Cotton equipment remains relevant in India and the United States, but loses share when water scarcity and raw-cotton price volatility rise.
Wool and silk applications stay niche and premium, served by specialized combing and reeling machines in Australia, Italy, China, and India. Bio-based synthetics, such as TENCEL Lyocell, gained fresh legitimacy in February 2026 when KARL MAYER and Lenzing demonstrated warp-knitting of modal micro-fibers at an industrial scale. Still, synthetic polymers will remain the cost baseline for most mills.
Geography Analysis
Asia-Pacific contributed 55.10% of 2025 revenue, anchored by China’s leadership in both supply and demand, as well as India’s USD 1.3 billion incentive pool that co-funds technical-textile machinery. Vietnam has supplemented growth by offering three-percent interest loans for imported equipment, enabling local mills to capture orders lost by Chinese producers facing tariff headwinds. Japan and South Korea remain small in volume yet high in average selling price because buyers there specify full Industry 4.0 functionality.
The Middle East and Africa will register a 6.31% CAGR to 2031, the fastest globally, lifted by the Africa Textile Renaissance Plan that aims to mobilize USD 5 billion for integrated cotton transformation across 11 industrial parks. Turkey’s inflationary dip curtailed 2025 orders, still its strategic proximity to Europe keeps OEMs expanding service footprints in Istanbul and Bursa. Gulf Cooperation Council states invest in downstream technical textiles that leverage petrochemical feedstock while targeting automotive and construction end-uses.
North America and Europe see primarily replacement and near-shoring demand, particularly in Mexico, where United States-Mexico-Canada Agreement (USMCA) rules require high regional content. German, Italian, and Swiss vendors remain technological leaders but face slowing demand at home given higher electricity prices and wage bills. South America, led by Brazil, shows tentative recovery as importers upgrade to semi-automatic spinning and knitting equipment aimed at local fast-fashion chains.

Competitive Landscape
The textile machinery market is fragmented, with numerous global and regional manufacturers competing across different machine segments. Rieter closed its takeover of OC Oerlikon’s Barmag division in February 2026, creating the only portfolio that covers natural staple, synthetic filament, and texturing within one brand. Huixing Machine bought Mayer & Cie.’s distressed circular-knitting assets the same month, foreshadowing increased Chinese participation in legacy European intellectual property.
European and Japanese incumbents differentiate through digital twins, predictive-maintenance analytics, and performance-based financing, whereas Chinese peers focus on modular kits that retrofit older lines at 30–40% lower cost. Valmet’s tie-up with Spinnova signals how machinery suppliers from adjacent sectors are entering the textile machinery industry by repurposing pulp-and-paper know-how for cellulose fiber production. ANDRITZ likewise moved into bio-protein yarn processing through its partnership with Tandem Repeat, extending its nonwoven leadership into emerging sustainable materials.
White-space opportunities cluster around closed-loop recycling and quick-change automation modules that support near-shored fast-fashion sourcing in Central America and Eastern Europe. Smaller European houses target these niches, though high development costs keep barriers significant. As brands impose stricter traceability and uptime covenants, vendors unable to offer integrated software and data services risk margin compression or market exit.
Textile Machinery Industry Leaders
-
Rieter Holding AG
-
Trützschler Group SE
-
Saurer Intelligent Technology AG
-
OC Oerlikon
-
Lakshmi Machine Works Ltd
- *Disclaimer: Major Players sorted in no particular order


Recent Industry Developments
- February 2026: Rieter completed the acquisition of OC Oerlikon’s Barmag division, expanding into man-made filament spinning.
- February 2026: Huixing Machine acquired Mayer & Cie.’s circular-knitting assets and plans to restart German production.
- February 2026: KARL MAYER and Lenzing showcased industrial warp-knitting of TENCEL Lyocell at Première Vision.
- October 2025: ANDRITZ partnered with Tandem Repeat on scaling Procell bio-protein fiber lines.


Global Textile Machinery Market Report Scope
| Spinning Machines |
| Weaving Machines |
| Knitting Machines |
| Texturing Machines |
| Other Machine Types |
| Manual |
| Semi-Automatic |
| Fully Automatic(Smart / Industry 4.0 Integrated Systems) |
| Garments & Apparel |
| Household & Home Textiles |
| Technical Textiles (Medical, Protective, Sports, etc.) |
| Cotton |
| Synthetic Fibers (Polyester, Nylon, Acrylic) |
| Wool |
| Silk |
| Other Fibers (Bast, Bio-based, etc.) |
| North America | United States |
| Canada | |
| Mexico | |
| South America | Brazil |
| Argentina | |
| Peru | |
| Rest of South America | |
| Europe | United Kingdom |
| Germany | |
| France | |
| Italy | |
| Spain | |
| BENELUX (Belgium, Netherlands, and Luxembourg) | |
| NORDICS (Denmark, Finland, Iceland, Norway, and Sweden) | |
| Rest of Europe | |
| Asia-Pacific | China |
| India | |
| Japan | |
| Australia | |
| South Korea | |
| ASEAN (Indonesia, Thailand, Philippines, Malaysia, Vietnam) | |
| Rest of Asia-Pacific | |
| Middle East and Africa | Saudi Arabia |
| United Arab Emirates | |
| Qatar | |
| Kuwait | |
| Turkey | |
| Egypt | |
| South Africa | |
| Nigeria | |
| Rest of Middle East and Africa |
| By Machine Type | Spinning Machines | |
| Weaving Machines | ||
| Knitting Machines | ||
| Texturing Machines | ||
| Other Machine Types | ||
| By Automation Level | Manual | |
| Semi-Automatic | ||
| Fully Automatic(Smart / Industry 4.0 Integrated Systems) | ||
| By Application | Garments & Apparel | |
| Household & Home Textiles | ||
| Technical Textiles (Medical, Protective, Sports, etc.) | ||
| By Raw Material | Cotton | |
| Synthetic Fibers (Polyester, Nylon, Acrylic) | ||
| Wool | ||
| Silk | ||
| Other Fibers (Bast, Bio-based, etc.) | ||
| By Geography | North America | United States |
| Canada | ||
| Mexico | ||
| South America | Brazil | |
| Argentina | ||
| Peru | ||
| Rest of South America | ||
| Europe | United Kingdom | |
| Germany | ||
| France | ||
| Italy | ||
| Spain | ||
| BENELUX (Belgium, Netherlands, and Luxembourg) | ||
| NORDICS (Denmark, Finland, Iceland, Norway, and Sweden) | ||
| Rest of Europe | ||
| Asia-Pacific | China | |
| India | ||
| Japan | ||
| Australia | ||
| South Korea | ||
| ASEAN (Indonesia, Thailand, Philippines, Malaysia, Vietnam) | ||
| Rest of Asia-Pacific | ||
| Middle East and Africa | Saudi Arabia | |
| United Arab Emirates | ||
| Qatar | ||
| Kuwait | ||
| Turkey | ||
| Egypt | ||
| South Africa | ||
| Nigeria | ||
| Rest of Middle East and Africa | ||


Key Questions Answered in the Report
What is the current size of the textile machinery market and how fast is it growing?
The textile machinery market size reached USD 32.70 billion in 2026 and is forecast to hit USD 42.06 billion by 2031, reflecting a 5.16% CAGR.
Which region leads spending on new textile machinery?
Asia-Pacific generated 55.10% of global revenue in 2025 thanks to large-scale upgrades in China and incentive-backed investments in India and Vietnam.
What machine segment is expanding the quickest?
The others machine types category, which includes specialty lines such as finishing equipment, is projected to grow at a CAGR of 6.66%, driven by rising demand from brands for recycled polyester and EV-grade nonwovens.
How are predictive-maintenance systems influencing buyer decisions?
Mills adopting sensor packages that cut downtime by around 35% favor fully automatic lines, prompting higher average selling prices and quicker reorder cycles.
Which players recently reshaped the competitive landscape?
Rieter’s purchase of Barmag and Huixing Machine’s acquisition of Mayer & Cie. assets in 2026 consolidated technology portfolios and deepened Chinese presence in premium knitting solutions.
What risks could slow investment in textile machinery?
High upfront CAPEX, volatile electricity tariffs, and shifting tariff rules on precision components can extend payback periods and deter capital spending.
Page last updated on:


