
Tea Polyphenols Market Size and Share
Market Overview
| Study Period | 2021 - 2031 |
|---|---|
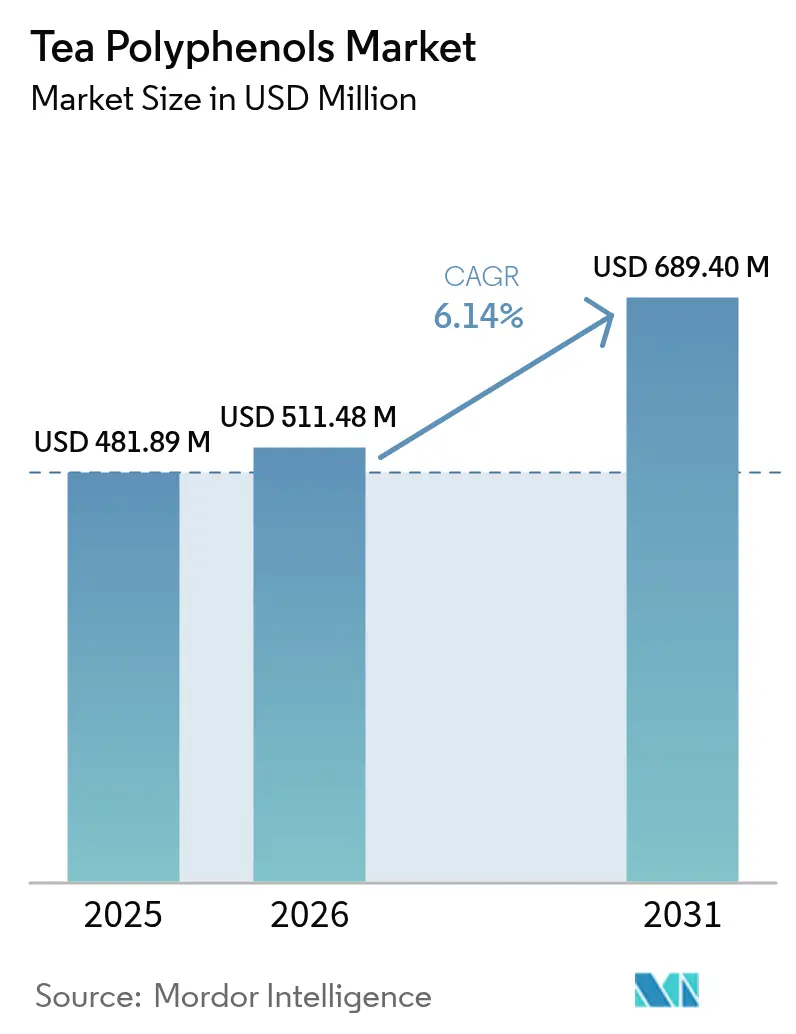
| Market Size (2026) | USD 511.48 Million |
| Market Size (2031) | USD 689.4 Million |
| Growth Rate (2026 - 2031) | 6.14 % |
| Fastest Growing Market | Asia Pacific |
| Largest Market | North America |
| Market Concentration | Medium |
Major Players
*Disclaimer: Major Players sorted in no particular order Image © Mordor Intelligence. Reuse requires attribution under CC BY 4.0. |
|
Tea Polyphenols Market Analysis by Mordor Intelligence
Tea polyphenols market size in 2026 is estimated at USD 511.48 million, growing from 2025 value of USD 481.89 million with 2031 projections showing USD 689.4 million, growing at 6.14% CAGR over 2026-2031. The increasing demand is driven by the ingredient's growing application in functional foods, beverages, supplements, and cosmetics, owing to its antioxidant properties and associated health benefits, such as promoting heart health and reducing inflammation. Responding to consumer demand for natural antioxidants, Nestlé has infused green tea extracts into its wellness beverages. At the same time, regulatory frameworks have become stricter: Health Canada has imposed a daily limit of 300 mg for epigallocatechin gallate (EGCG) intake [1]Source: Health Canada, "Summary of Health Canada’s Safety Assessment of Green Tea Extract for Use as a Supplemental Ingredient,"canada.ca. While the European Food Safety Authority continues to enforce an 800 mg threshold following hepatotoxicity evaluations. On the innovation front, techniques such as subcritical water extraction and natural deep eutectic solvents are not only boosting yields but also promoting sustainability. Additionally, in the face of climate-induced cost pressures, the industry is increasingly turning to climate-resilient cultivars and controlled-environment farming, ensuring a steady supply.
Key Report Takeaways
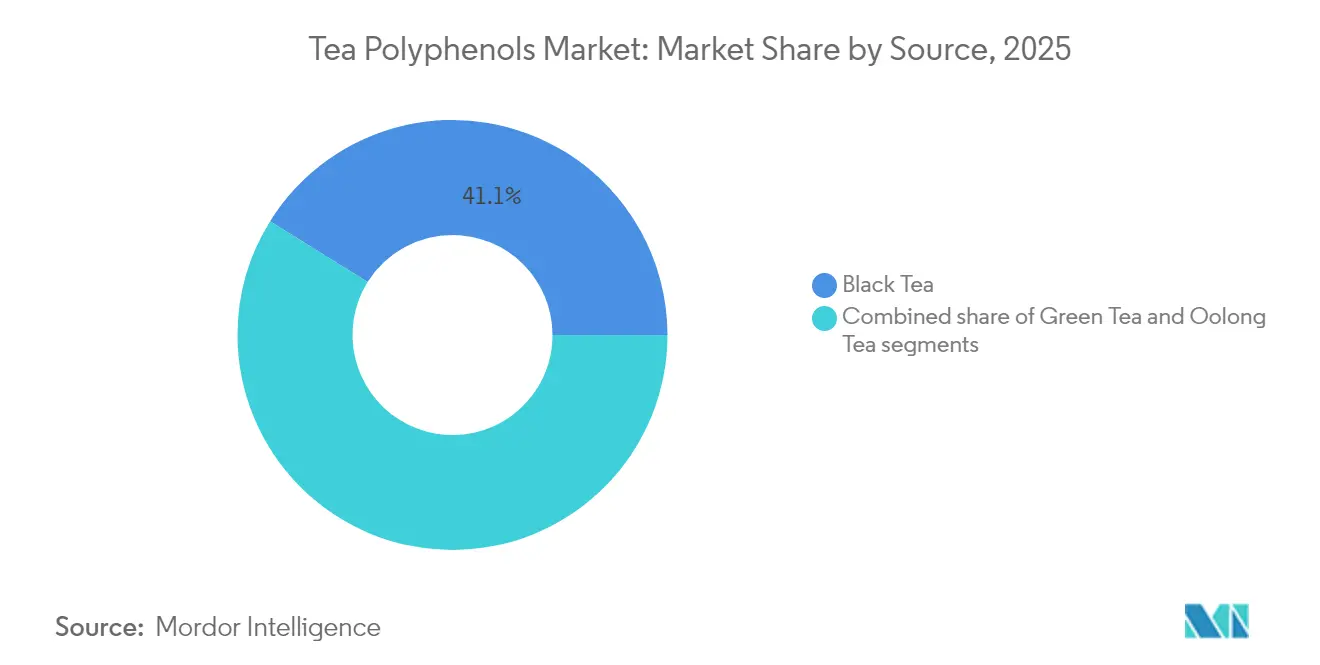
- By source, black tea led with 41.12% revenue share in 2025, whereas green tea is projected to expand at a 7.21% CAGR through 2031.
- By form, powder captured 65.39% of the tea polyphenols market share in 2025; liquid formulations are forecast to grow at a 7.53% CAGR to 2031.
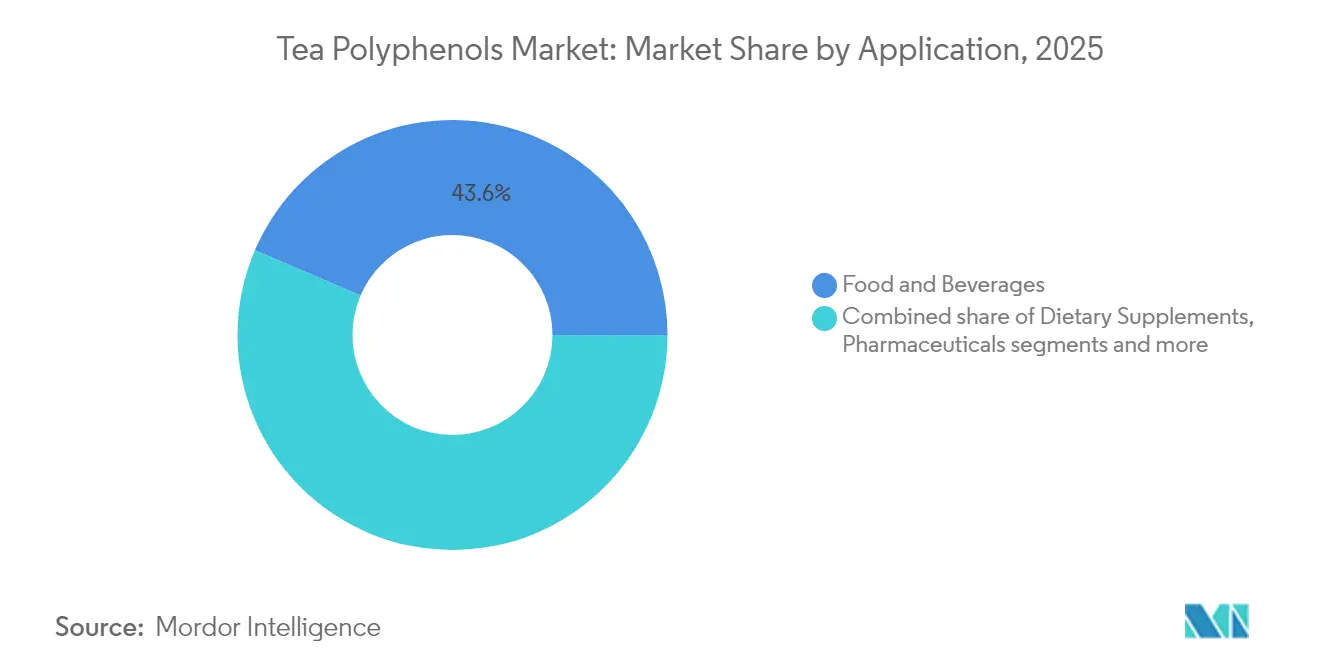
- By application, food and beverages accounted for 43.55% share of the tea polyphenols market size in 2025, while dietary supplements advance at a 6.88% CAGR through 2031.
- By geography, North America held 29.05% revenue share in 2025; Asia-Pacific records the highest projected CAGR at 7.02% to 2031.
Note: Market size and forecast figures in this report are generated using Mordor Intelligence’s proprietary estimation framework, updated with the latest available data and insights as of 2026.
Market Trends and Insights
Drivers Impact Analysis of Tea Polyphenols Market*
| Driver | (~) % Impact on CAGR Forecast | Geographic Relevance | Impact Timeline |
|---|---|---|---|
| Increasing consumer awareness of antioxidants-rich products | +1.2% | Global, with stronger uptake in North America and Europe | Medium term (2-4 years) |
| Clean-label ingredients trend driving use of tea-derived additives | +0.9% | North America and Europe core, expanding to Asia-Pacific | Long term (≥ 4 years) |
| Use of tea polyphenols as natural preservatives in packaged foods | +0.8% | Global, led by developed markets | Medium term (2-4 years) |
| Consumer shift towards immunity-boosting and wellness beverages | +1.1% | Global, accelerated in post-pandemic markets | Short term (≤ 2 years) |
| Rising popularity of green tea as natural source of catechins | +0.8% | Asia-Pacific core, expanding to North America and Europe | Medium term (2-4 years) |
| Wide application of tea polyphenols across functional food and supplement | +0.9% | Global, led by developed markets | Long term (≥ 4 years) |
| Source: Mordor Intelligence | |||
Increasing consumer awareness of antioxidant-rich products
Tea polyphenols have evolved from being mere dietary supplements to being acknowledged as therapeutic agents, particularly in anti-aging and cellular senescence modulation. Research spearheaded by Italy's National Institute of Gastroenterology, and published in May 2025 by the Multidisciplinary Digital Publishing Institute (MDPI), underscores that polyphenols not only modulate gene expression and boost mitochondrial function but also decelerate cellular aging through mechanisms that extend beyond conventional antioxidant pathways [2]Source: MDPI, "The Antiaging Potential of Dietary Plant-Based Polyphenols: A Review on Their Role in Cellular Senescence Modulation,"mdpi.com. This scientific validation has propelled the adoption of premium positioning strategies in health-focused markets, with consumers increasingly valuing quality over cost. As the industry shifts towards functional nutrition, manufacturers are discovering opportunities to command higher margins through scientifically validated formulations. Regulatory bodies are also taking notice, with the FDA's recent framework for food-derived bioactive components, as highlighted by Food Compliance International in 2024, offering clearer avenues for substantiating health claims.
Clean-label ingredients trend driving use of tea-derived additives
As consumers increasingly shun synthetic preservatives, manufacturers are turning to natural alternatives that comply with food-safety regulations. Tea-based extracts not only exhibit broad-spectrum antimicrobial properties but also surpass many artificial additives, all while preserving sensory quality. These extracts are particularly valued for their ability to inhibit the growth of a wide range of microorganisms, including bacteria, yeasts, and molds, making them a versatile solution for food preservation. Furthermore, natural plant extracts, especially those rich in polyphenols, outshine traditional preservatives in antimicrobial efficacy. Polyphenols, known for their antioxidant properties, also contribute to extending the shelf life of food products while maintaining their nutritional and sensory attributes. Notably, tea-derived compounds effectively combat pathogenic bacteria, aligning with stringent food safety standards. In premium food segments, the allure of a clean label commands a premium price, with consumers readily paying more for the assurance of natural ingredients. This trend not only underscores the value of extraction technology and regulatory compliance but also carves out a sustainable competitive edge for suppliers in the market.
Use of tea polyphenols as natural preservatives in packaged foods
Tea polyphenols, known for their antimicrobial prowess, are increasingly replacing synthetic preservatives. This transition not only meets regulatory demands but also resonates with consumers' preference for natural, clean-label ingredients. These polyphenols adeptly curb microbial growth, prolonging product shelf life without sacrificing safety or quality. For example, a study from 2025 in the Journal of Agriculture and Food Research highlighted the use of black tea polyphenols in preserving aquatic foods [3]Source: Jianping Wu, “Natural Polyphenols as a Promising Aquatic Food Preservative,” Journal of Agriculture and Food Research, sciencedirect.com. By employing subcritical water extraction, manufacturers safeguard the molecular integrity of these polyphenols, bolstering their efficacy in dairy items, baked goods, and ready-to-drink beverages. Beyond mere preservation, tea polyphenols boast health benefits, notably their antioxidant properties, making them attractive to health-conscious buyers. This multifaceted appeal empowers manufacturers to adopt premium market positioning, amplifying product differentiation and value.
Consumer shift towards immunity-boosting and wellness beverages
Post-pandemic, there's been a notable shift towards preventive care, with blends rich in EGCG taking center stage in modulating immune pathways. Supermarkets and online platforms are witnessing a surge in dietary supplements, particularly standardized capsules and gummies, highlighting a growing consumer appetite for health-centric products. Furthermore, functional beverage producers are now incorporating standardized polyphenol concentrations, not only to strengthen immunity claims but also to cater to the heightened demand for high-purity extracts. Green tea, abundant in EGCG, has emerged as a go-to immunity-boosting beverage. Dietitians emphasize its significant role in immune regulation, owing to its potent catechins. These industry shifts favor suppliers armed with robust clinical evidence and regulatory know-how, spotlighting the competitive edge of validating health claims in today's wellness-driven landscape.
Restraints Impact Analysis of Tea Polyphenols Market*
| Restraint | (~) % Impact on CAGR Forecast | Geographic Relevance | Impact Timeline |
|---|---|---|---|
| Processing challenges impact tea polyphenol stability | -0.7% | Global, particularly affecting liquid formulations | Medium term (2-4 years) |
| Bitter taste and astringency limiting formulation in food and beverage | -0.5% | Global, stronger impact in consumer products | Long term (≥ 4 years) |
| Rising popularity of synthetic antioxidants in cost-sensitive segments | -0.6% | Global, concentrated in price-sensitive markets | Short term (≤ 2 years) |
| Fragmented supply chain in developing regions | -0.4% | Asia-Pacific and Africa, spill-over to global pricing | Medium term (2-4 years) |
| Source: Mordor Intelligence | |||
Processing challenges impact tea polyphenol stability
Research published in July 2024 by the International Association of Dietetics, Nutrition, and Safety (IADNS) highlights that aqueous extraction at 80 °C is a highly effective method for preserving the potency of catechins when compared to higher-temperature extraction techniques. This process is critical for maintaining the stability and efficacy of key active compounds, ensuring that products meet label-claim potency throughout their shelf life. However, the widespread adoption of this method faces significant hurdles due to its high implementation costs and technical complexities. These barriers are particularly challenging for smaller manufacturers, who often lack the resources to invest in such advanced processes. As a result, these manufacturers face competitive disadvantages, which not only hinder their market participation but also contribute to the overall constraints on market growth.
Bitter taste and astringency limiting formulation in food and beverage
High polyphenol concentrations are known for their significant health benefits; however, they also contribute to bitterness and astringency, which many consumers find undesirable. According to a study conducted by the Zhejiang Academy of Agricultural Sciences in Hangzhou and published in April 2025 by the Multidisciplinary Digital Publishing Institute, integrated shaking and piling techniques can effectively reduce the harsh catechins present in summer-harvest green tea. Despite its effectiveness, this approach adds complexity to the production process and increases costs. Flavor-masking technologies offer an alternative solution, but they often pose challenges for maintaining clean-label claims, particularly in mass-market beverages where transparency is a key consumer demand. This limitation is especially impactful in the food and beverage sector, which accounts for the majority of the market. In this segment, consumer purchasing decisions are heavily influenced by taste, often outweighing the perceived functional benefits of the product.
*Our forecasts treat driver/restraint impacts as directional, not additive. The impact forecasts reflect baseline growth, mix effects, and variable interactions.
Tea Polyphenols Market Segment Analysis
By Source:
Green Tea enables high-potency innovationIn 2025, black tea accounted for the largest share of the tea polyphenols market, holding a 41.12% share of the total volume. This dominance is a testament to its deep-rooted consumer familiarity and the robustness of global supply chains. However, the landscape is shifting, with a growing interest in alternative teas that boast unique functional profiles. Oolong tea, though still a niche player, is carving out a premium spot in gourmet snacks, known for its intricate flavor and distinctive flavonol makeup.
On the other hand, green tea is solidifying its position as the market's most consistent growth engine, with projections pointing to a 7.21% CAGR. This surge is largely attributed to its elevated catechin levels, with unfermented leaves showcasing a remarkable 70% polyphenolic concentration. Moreover, innovations such as controlled piling are not only tempering bitterness but also broadening its appeal in confections and nutraceuticals. Green tea's ascent is further bolstered by localized cultivation in the U.S. and southern Europe, strategies that sidestep climate challenges and streamline supply chains. Given these dynamics, green tea is poised to make significant strides, narrowing the gap with black tea in the tea polyphenols arena.



By Form:
Liquid formulations overcome technical barriersIn 2025, powdered tea polyphenols command a dominant 65.39% share of the market. This supremacy stems from the unmatched shelf stability of powders, ensuring both product integrity and convenience for manufacturers and consumers. Their adaptability shines as powdered tea polyphenols seamlessly integrate into various formats, from tablets and capsules to dry drink mixes. This fine particle size not only enhances water dispersion but also boosts bioavailability, maximizing the benefits of active compounds for consumers. Given their stability, versatility, and heightened bioactivity, powders have cemented their status as the leading segment in the tea polyphenols market, especially among health-conscious consumers and efficiency-driven manufacturers.
On the other hand, liquid formats are rapidly gaining traction, with projections indicating a robust CAGR of 7.53% through 2031. This momentum is fueled by cutting-edge extraction and stabilization technologies, like subcritical water extraction and microencapsulation, paving the way for stable, high-clarity liquid polyphenol extracts. As consumer preferences shift towards ready-to-drink immunity tonics and functional shots, valued for their convenience and rapid absorption, especially by athletes, manufacturers are also adapting. The adoption of natural deep eutectic solvents allows them to sidestep alcohol-based carriers, leading to cleaner labels and wider consumer appeal. With these advancements, liquid tea polyphenols are poised to capture a larger market share, especially among those prioritizing immediate benefits and transparent, health-centric ingredient lists.
By Application:
Dietary supplements capitalize on health trendsIn 2025, the food and beverages segment leads the tea polyphenols market, accounting for 43.55% of total demand. This segment's dominance stems from growing consumer interest in healthier, functional products. Flavored teas, dairy alternatives, and antioxidant-rich bakery items are key drivers, appealing to health-conscious consumers seeking both taste and nutrition. The versatility of tea polyphenols enables their incorporation into a wide variety of food and beverage products, enhancing market penetration. Additionally, the increasing popularity of plant-based diets and clean-label products has further driven demand for tea polyphenols. Manufacturers are leveraging these natural ingredients to differentiate their offerings and meet evolving consumer preferences.
On contrast, dietary supplements are expected to be the fastest-growing segment, with a strong CAGR of 6.88%. This growth is primarily fueled by rising consumer awareness of the health benefits of tea polyphenols. Standardized extracts, known for supporting immunity, metabolic health, and skin wellness, are particularly sought after. Millennials and Gen Z, especially those purchasing online, are adopting supplements in various forms, tablets, capsules, gummies, and shots, due to their convenience and targeted health benefits. Beyond supplements, pharmaceutical research is exploring tea polyphenols, such as EGCG, for specialized applications like adjuvant cancer therapies and diabetic wound care. The cosmetics industry is also utilizing polyphenols' antioxidant properties in advanced anti-aging formulations.
Geography Analysis
North America Tea Polyphenols Market
In 2025, North America captured 29.05% of the revenue share, driven by dynamic innovations in functional foods and a well-established supplement market. As health consciousness rises, North American consumers increasingly favor products with minimal artificial additives. Tea polyphenols, celebrated for their functional benefits ranging from anti-diabetic and anti-inflammatory to anti-aging and antimicrobial, are gaining traction across various sectors, including healthcare, cosmetics, and dietary supplements. A nationwide shift towards healthier lifestyles and a growing appetite for nutraceuticals further fuels this surge. Highlighting this trend, a 2023 CMS report noted that national health expenditures in the U.S. reached USD 14.5 thousand per capita.
APAC Tea Polyphenols Market
Asia-Pacific is on a rapid ascent, boasting a 7.02% CAGR projected through 2031. This growth is largely attributed to China's burgeoning tea sector, its diverse extraction facilities, and the rise of a trendy "new-style" tea café culture. Notably, patents for steam-explosion and superfine-grinding techniques, predominantly sourced from Chinese universities, offer both process leadership and a cost edge. Moreover, swift urbanization and increasing disposable incomes in nations like Indonesia, Vietnam, and India are broadening the regional consumption base, further energizing the tea polyphenols market.
Europe Tea Polyphenols Market
Europe, a market with deep roots, is undergoing notable transformations. The EU's 2023/915 regulation, alongside the Novel Foods catalogue, streamlines compliance, facilitating easier cross-border product introductions. In the UK, the Committee on Toxicity has established a consistent standard, approving an 800 mg daily limit for EGCG, a key component of green tea catechins. Such regulatory transparency empowers supplement producers, enhancing their appeal across a wide range of food and beverage sectors. These developments are expected to drive innovation and foster competition among manufacturers, further strengthening the region's position in the global market.


Regulatory Landscape
Regulation of tea polyphenols and catechin-rich green tea extracts is tightening around dose and disclosure requirements, especially for EGCG. In the European Union, Commission Regulation (EU) 2022/2340 amending Annex III to Regulation (EC) No 1925/2006 restricts addition of green tea extracts to foods at high EGCG levels (800 mg or more per daily portion) and requires specific consumer warnings, while highly purified green tea extracts used in food supplements also intersect with Novel Food considerations under Regulation (EU) 2015/2283. These EU controls align with the broader safety-driven approach referenced in the report context around hepatotoxicity evaluations and high-dose thresholds.
In China, tea polyphenol is explicitly listed as a permitted food additive in GB 2760-2024 (CNS 04.005) for antioxidant function, providing a defined pathway for use in packaged foods as a preservative-type ingredient. In the United States, regulatory positioning varies by ingredient form and intended use: palmitoylated green tea catechins have an FDA GRAS notice (GRN 772) for specified uses as an antioxidant in foods, and tea extract (Thea sinensis L.) appears in FDA food-ingredient inventories as a flavoring agent, pushing suppliers to differentiate dossiers by chemistry (standard extracts versus modified catechins) and application (flavoring versus antioxidant functionality).
Value Chain Analysis
The tea polyphenols value chain starts with cultivation and harvesting of Camellia sinensis leaves, followed by primary processing (with polyphenol content varying by season, cultivar, and region), then extraction and purification into standardized concentrates, powders, or liquids for food, beverage, supplement, and cosmetic use. Upstream supply is concentrated in major tea-producing countries, with China and India central to leaf availability, while midstream value is created by extractors and technology providers deploying solvent extraction, supercritical CO2, membrane filtration, and purification steps to reach different grades, including high-purity EGCG. Standardization and quality control are increasingly defined by formal specifications, including ISO 5642 classification and China standards such as GB/T 31740.2-2015 (grade classifications) and GB 1886.360-2022 for tea polyphenol palmitate.
Downstream, ingredient marketers, blenders, and contract manufacturers translate extracts into application-ready systems (premixes, encapsulated formats, and stabilized liquids) that meet taste, solubility, and shelf-life needs for functional foods and beverages, dietary supplements, and personal care. Key bottlenecks include variability in active content at the leaf level, cost and yield challenges for >95% EGCG purification, and the documentation burden for traceability and certification (notably for organic and audit-ready supply chains). As end users demand cleaner labels and consistent potency, extractors with validated processing controls (temperature management, encapsulation capability, and traceable sourcing) gain an advantage in securing recurring supply programs over spot buying.
Competitive Landscape
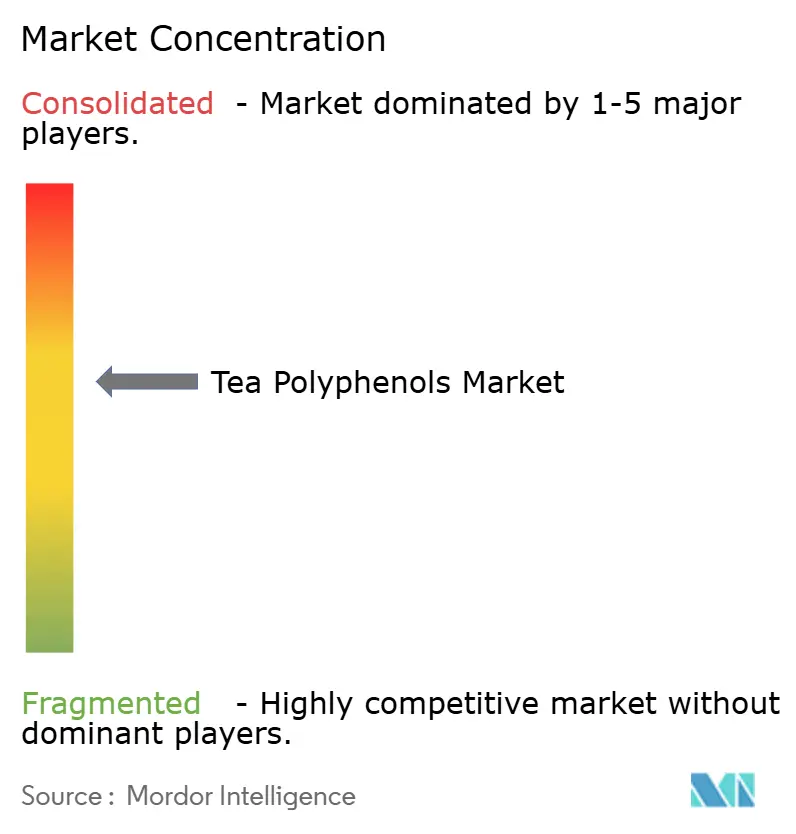
The tea polyphenols market is moderately consolidated, with the major players like Givaudan SA, A. Holliday and Company Inc., and International Flavors & Fragrances Inc. commanding a prominent share of global revenue. Process innovation stands out as the primary differentiator. According to a study by Jinan Fruit Research Institute, China, published in the Multidisciplinary Digital Publishing Institute, firms achieving a 99.9% cell-wall rupture and a particle size under 15 μm secure premium contracts in supplements and dermatological products.
Additionally, investments are increasingly directed towards solvent-free extraction methods to align with retailer sustainability benchmarks. New entrants, particularly direct-to-consumer brands, are gaining traction by emphasizing transparent sourcing and third-party clinical validations, appealing to the digital-savvy shopper. Risk-management strategies play a pivotal role in shaping the competitive landscape.
Companies boasting diversified origin portfolios are better equipped to navigate tariff shocks and climatic challenges compared to those reliant on a single country. While vertical integration from estate to extract provides added protection, it demands substantial capital and agronomic expertise. These market dynamics are fostering both mergers and long-term offtake agreements, hinting at a trend towards heightened market consolidation in the coming five years.
Tea Polyphenols Industry Leaders
-
Givaudan SA
-
A. Holliday and Company Inc.
-
SV Agrofood
-
International Flavors & Fragrances Inc.,
-
Botanic Healthcare
- *Disclaimer: Major Players sorted in no particular order
Tea Polyphenols Market Companies Covered in this Report
- Givaudan SA
- A. Holliday and Company Inc.
- SV Agrofood
- International Flavors & Fragrances Inc.,
- Botanic Healthcare
- Taiyo International
- Sami-Sabinsa Group
- Fengchen Group Co.,Ltd
- Lyan Natural Ingredients
- Synthite Industries
- Xi'an Fengzu Biological Technology Co.,Ltd
- HANGZHOU FOCUS CORPORATION
- Indena SpA
- Zibo Anquan Chemical Co., Ltd.
- YARROW CHEM PRODUCTS
- Xi an Pincredit
- Cayman Chemical
- Shaanxi Hongda Phytochemistry Co.,Ltd.
- Baoji Oasier Nutri-tech Co., Ltd.
- TOKIWA PHYTOCHEMICAL CO.,LTD.

Market Opportunities and Future Outlook
Product design is moving beyond generic antioxidant positioning toward higher-value, application-specific formats that solve stability, taste, and bioavailability constraints. A visible whitespace is in functionalized delivery systems that protect catechins in challenging matrices, such as protein-loaded tea polyphenol nanoparticles and other polyphenol-matrix complexes described in recent academic work, which directly address the processing stability issues highlighted in the report (particularly for liquids). This supports expanded use in ready-to-drink wellness beverages and functional foods where clarity, shelf stability, and maintained label-claim potency are decisive for scale.
Regulatory-permitted derivatives and clearly scoped use cases also create commercialization space in mainstream foods. In the United States, GRAS acceptance for palmitoylated green tea catechins for specific antioxidant uses offers an on-ramp for formulators targeting baked goods and fat-containing systems where standard extracts can be harder to disperse or protect. In parallel, the report’s cited adoption by large beverage players, such as Nestle using green tea extracts in wellness beverages, reinforces near-term opportunity for suppliers that combine compliant dosing, sensory management (bitterness reduction and masking approaches that preserve clean-label positioning), and documentation that satisfies EU warning requirements and country-specific additive standards such as China’s GB 2760-2024.
Recent Industry Developments in Tea Polyphenols Market
- July 2026: New academic and trade reporting highlighted green tea catechins, including EGCG, being investigated for metabolic benefits tied to taste-receptor mechanisms rather than only systemic absorption. This has supported more product concepts in functional beverages and supplements that emphasize targeted metabolic positioning while staying within dose and warning constraints that govern high-EGCG formulations.
- September 2025: Givaudan announced completion of its Tea Time co-creation program with European social media influencers, generating six tea concepts intended for scalable commercialization in beverage pipelines. The initiative paired consumer insight generation with flavor and functional tea positioning, strengthening downstream pull for tea-extract ingredient systems used in wellness-oriented drinks.
- December 2024: HEYTEA introduced its New-style Tea Health Labeling System, incorporating third-party testing by SGS that included assessment of tea polyphenol content as part of nutritional evaluation. The move elevated transparency and standardization in branded tea beverages, reinforcing demand for consistent, testable polyphenol inputs from suppliers.


Tea Polyphenols Market Report Scope and Research Methodology
Market Definition and Coverage
For this study, the tea polyphenols market covers the value of polyphenol rich ingredients extracted from tea and sold for use in food and beverages, dietary supplements, cosmetics, and related formulations across major regions.
Scope exclusions: This sizing does not count retail brewed tea beverages, tea leaves sold as a beverage ingredient, or finished supplement brands at consumer retail prices.
Segments Covered in This Report
-
By Source
- Green Tea
- Black Tea
- Oolong Tea
-
By Form
- Powder
- Liquid
-
By Application
- Food and Beverages
- Dietary Supplements
- Pharmaceuticals
- Others
-
By Geography
-
North America
- United States
- Canada
- Mexico
- Rest of North America
-
Europe
- Germany
- United Kingdom
- Italy
- France
- Spain
- Poland
- Rest of Europe
-
Asia-Pacific
- China
- India
- Japan
- Australia
- Rest of Asia-Pacific
-
South America
- Brazil
- Argentina
- Rest of South America
-
Middle East and Africa
- South Africa
- Saudi Arabia
- United Arab Emirates
- Rest of Middle East and Africa
-
North America
Data Sources, Market Sizing, and Validation
Desk Research
Desk work started with public production and trade signals that help explain where tea derived inputs are likely to be processed and consumed. We referred to sources such as FAOSTAT for tea output, UN Comtrade for import and export patterns, and national customs portals where available to sanity check regional movement of extracts and related preparations.
To keep the assumptions grounded, we also reviewed open regulatory and scientific references that describe usage boundaries and quality expectations. Examples include EFSA opinions and Health Canada guidance around catechin and EGCG intake, peer reviewed food science journals on catechin profiles, and trade association pages that describe tea processing and extract formats. Company annual reports, investor decks, and reputable press were used to map application focus, while paid subscriptions for company financials, patent databases, and shipment level trade intelligence were used selectively to validate supplier activity. These examples are not exhaustive, and many other public sources were also consulted to collect, verify, and clarify data points.
Primary Interviews and Surveys
Primary inputs were gathered through expert interviews and structured questionnaires with ingredient suppliers, contract manufacturers, brand side formulators, and distributors that handle extracts and nutraceutical ingredients. Since this is a global market, we balanced conversations across APAC, EMEA, and the Americas so application splits, typical purity ranges, and pricing movements could be checked against what desk research suggested.
Distribution of primary research fieldwork respondents
| Company type | Respondent position | Region |
|---|---|---|
| Top tier: 30% | CXOs: 18% | APAC: 46% |
| Mid tier: 51% | Functional/Unit leaders: 24% | EMEA: 30% |
| Smaller Players: 19% | Managers: 58% | Americas: 24% |
Market-Sizing & Forecasting
Sizing is anchored on a top-down build where tea cultivation and processing footprints, trade flows of tea preparations, and application penetration are used to reconstruct the addressable demand pool for tea derived polyphenol ingredients. The model is then corroborated with selective bottom-up checks using supplier and channel interviews, along with sampled price per kilogram by form and purity applied to estimated volumes in key applications.
A few practical inputs that shape the totals include regional demand for functional beverages and supplements, typical inclusion rates in formulations, split of powder versus liquid formats, average purity and catechin profile expectations, and observed pricing changes linked to raw tea availability and compliance requirements. Where direct volume signals are weak, gaps are handled by applying proxy ratios from similar regions, and then rechecked with respondents who see ordering patterns across multiple customers.
For forecasting, scenario analysis is used so the base case can reflect agreed demand drivers and constraints discussed in fieldwork, followed by sensitivity ranges for regulation led usage limits, pricing drift, and application adoption speed. That way, the five year outlook stays traceable to the same variables that build the current year estimate.
Data Validation & Update Cycle
Validation is done through triangulation across independent signals so one source type does not dominate the outcome. We compare model outputs against cross checks such as regional trade direction, reported capacity and expansion announcements, and whether implied per capita usage looks reasonable for food, supplement, and cosmetics demand.
Outliers are reviewed in multiple steps, where assumptions are reworked and then tested again before sign off. When a variance is large or a new event changes supply or pricing, respondents are recontacted to confirm what shifted and when. The report is refreshed annually, and interim updates are made when material developments occur, followed by a final pre delivery review pass so clients receive the latest view.
Mordor Intelligence's Global Tea Polyphenols Market Size Versus Other Published Estimates
Published market values for tea polyphenols can look far apart because analysts do not always count the same products, the same selling point in the value chain, or the same base year timing. Differences also show up when one estimate assumes faster adoption in supplements or functional beverages, while another uses a more conservative uptake curve.
The table shows a clear spread that mainly comes from what is treated as in scope and how pricing is applied, especially across powder versus liquid formats and across differing purity grades. In Mordor Intelligence's model, the total is built around ingredient level revenues used in food and beverages, dietary supplements, cosmetics, and other applications, rather than mixing in broader tea extract categories or finished consumer product pricing.
Benchmark comparison
| Source | Market Size | Gaps in Research Methodology |
|---|---|---|
| Mordor Intelligence | USD 511.48 M (2026) | |
| Trade Analytics Group A | USD 483.04 M (2025) | Uses a 2024 base with a nearer term current year, and the scope description leans toward functional food and supplement uses, which can undercount cosmetics and other industrial formulation demand depending on how applications are grouped. |
| Industry Publisher B | USD 290.12 M (2024) | Appears to apply a narrower revenue capture and earlier base year, which can exclude parts of the ingredient value chain or treat certain extract formats as adjacent categories, thereby lowering the stated total. |
Looking across the three figures, the main takeaway is that scope boundaries and the pricing point chosen in the chain drive most of the gap, more than small differences in growth math. By tying the estimate to application level demand signals, realistic inclusion rates, and interview checked price ranges, the result stays balanced and easier to reproduce when assumptions are updated.


Key Questions Answered in the Report
What is the current size of the tea polyphenols market?
The market stands at USD 511.48 million in 2026 and is projected to reach USD 689.4 million by 2031.
Which source segment is growing fastest?
Green tea extracts are expanding at 7.21% CAGR, driven by their high catechin content and regulatory acceptance.
Why are liquid formulations gaining popularity?
Advances in subcritical water extraction and encapsulation have improved stability, enabling ready-to-drink wellness beverages and driving a 7.53% CAGR in liquids.
What is the main technical restraint facing manufacturers?
Polyphenol degradation during processing, especially in liquids, risks potency loss, though steam explosion and controlled-temperature extraction mitigate this issue.
Page last updated on:


 Your data is secure and never sold or shared.


