Market Overview
| Study Period | 2021 - 2031 |
|---|---|
| Market Size (2026) | USD 168.40 Billion |
| Market Size (2031) | USD 220.60 Billion |
| Growth Rate (2026 - 2031) | 5.50% CAGR |
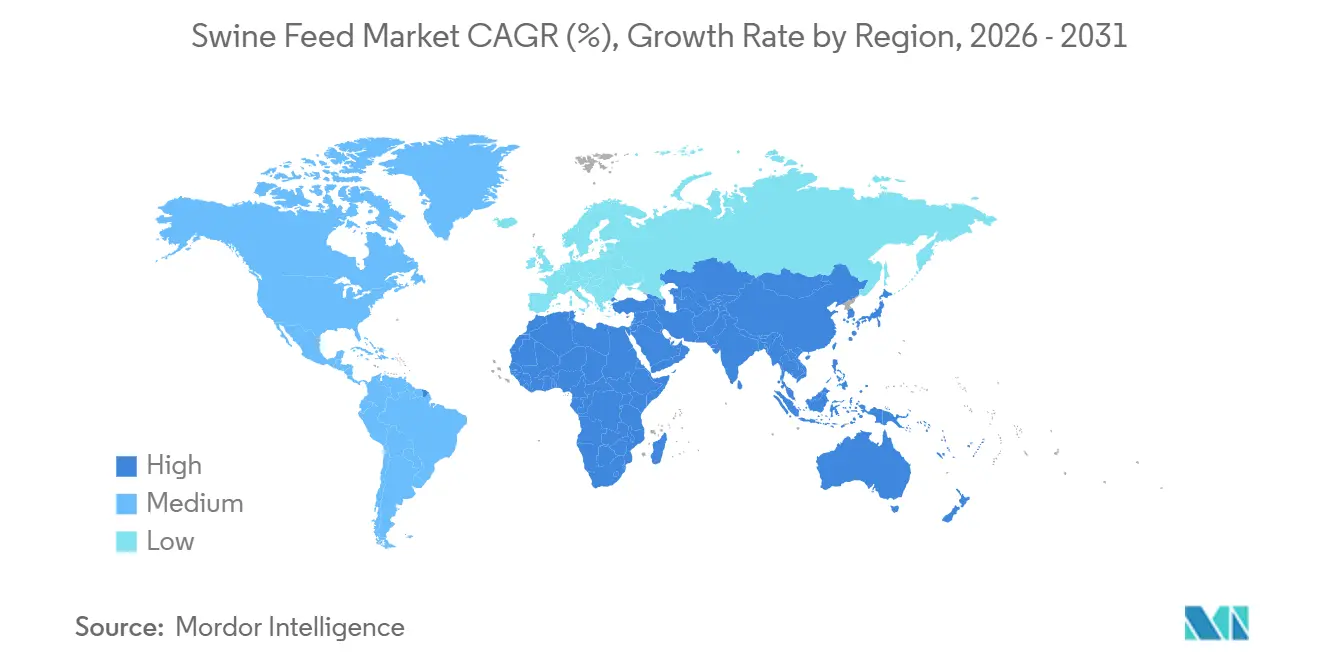
| Fastest Growing Market | Africa |
| Largest Market | Asia Pacific |
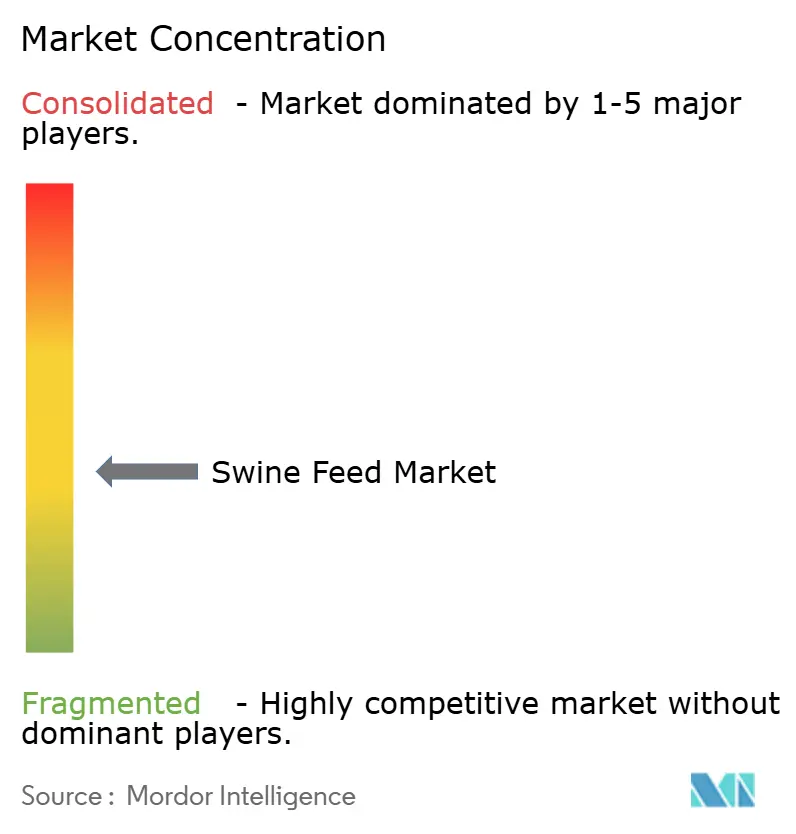
| Market Concentration | Low |
Major Players *Disclaimer: Major Players sorted in no particular order Image © Mordor Intelligence. Reuse requires attribution under CC BY 4.0. | |
Swine Feed Market Analysis by Mordor Intelligence
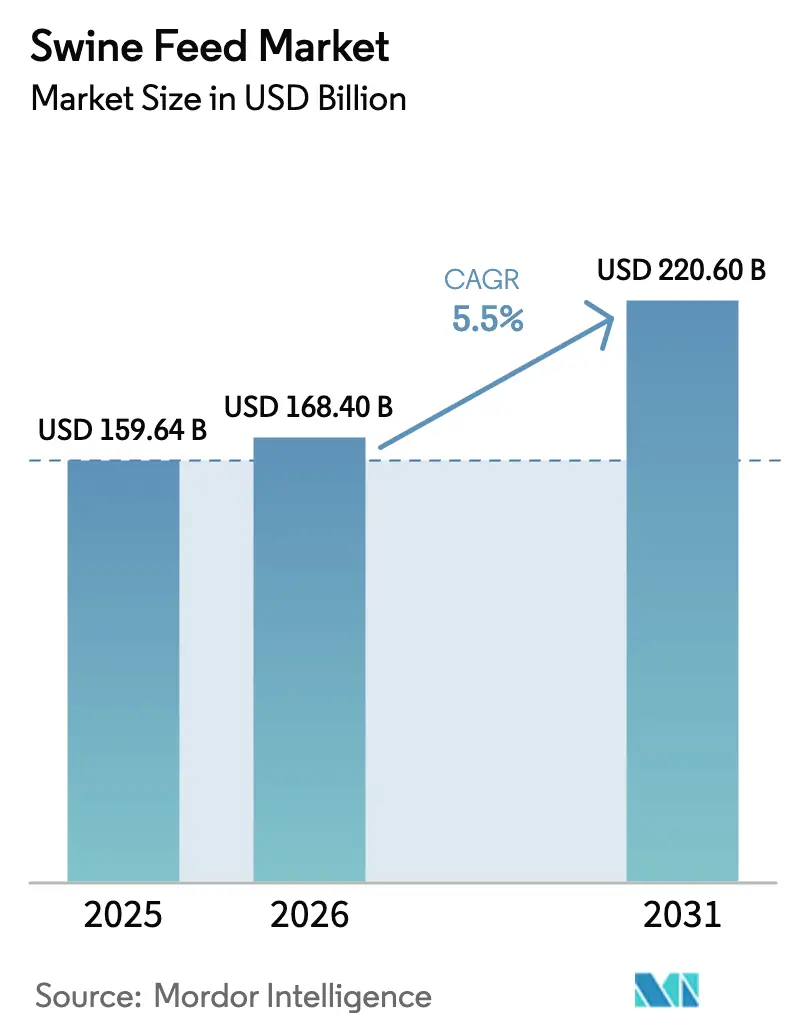
The swine feed market size is projected to expand from USD 159.64 billion in 2025 and USD 168.40 billion in 2026 to USD 220.60 billion by 2031, registering a CAGR of 5.50% between 2026 to 2031. Rising feed-conversion efficiency targets now guide profitability more than sheer tonnage expansion, while bans on antibiotic growth promoters encourage the use of enzyme-probiotic blends that maintain weight-gain levels without regulatory friction. African Swine Fever (ASF) containment rules embed biosecurity costs into ingredient sourcing and mill hygiene, adding working capital pressure while opening premium niches for mills that certify pathogen-free formulas. Precision feeding, mycotoxin control mandates, and carbon labeling by packers drive technology investment forward, pulling demand for feed with specialty additives and real-time feed formulation software. The swine feed market benefits from China’s post-ASF herd rebuild, Brazil’s soy-meal cost advantage, and Southeast Asia’s farm industrialization, but it also faces margin risk from corn-soy volatility and tight vitamin A and E supply.
Key Report Takeaways
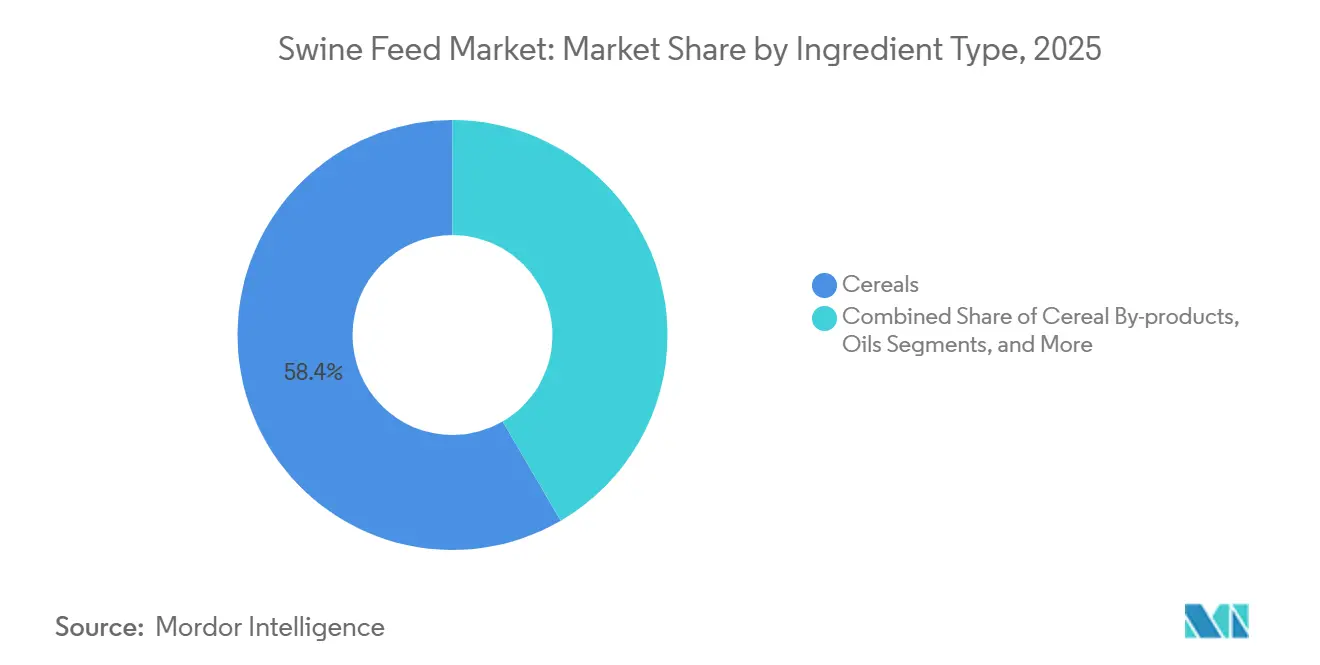
- By ingredient type, cereals captured 58.4% of the swine feed market share in 2025, while supplements are forecast to expand at a 6.5% CAGR through 2031.
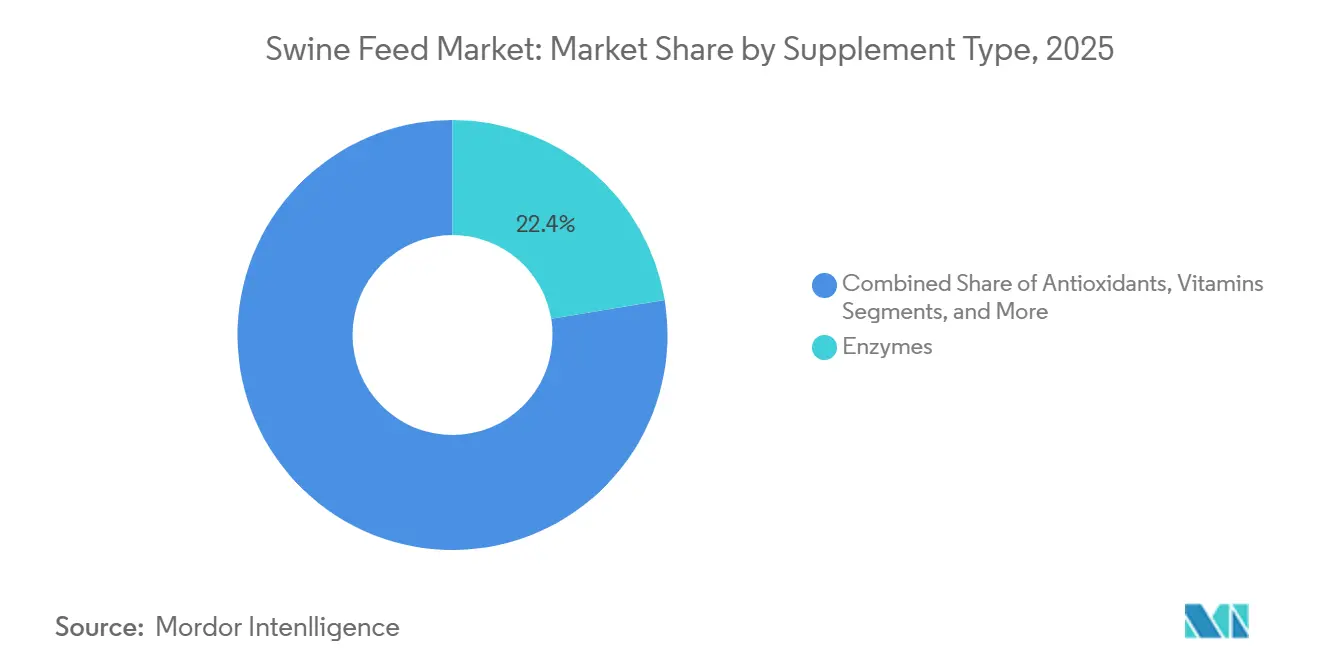
- By supplement type, enzymes led the swine feed market, accounting for a 22.4% value share in 2025 and are anticipated to record the fastest growth, at an 8.9% CAGR, through 2031.
- By life stage, finisher feeds accounted for 38.0% of the swine feed market size in 2025, and starter feeds advance at a 7.2% CAGR through 2031.
- By geography, the Asia-Pacific region held a 46.3% share in 2025, while Africa is forecast to grow at the fastest rate, with a 6.9% CAGR through 2026-2031.
Note: Market size and forecast figures in this report are generated using Mordor Intelligence’s proprietary estimation framework, updated with the latest available data and insights as of January 2026.
Global Swine Feed Market Trends and Insights
Drivers Impact Analysis*
| Driver | (~) % Impact on CAGR Forecast | Geographic Relevance | Impact Timeline |
|---|---|---|---|
| Feed Enzyme Cost-Efficiency Gains | +0.8% | Asia-Pacific core, North America, South America | Medium term (2–4 years) |
| Mycotoxin Risk-Management Mandates | +0.6% | Global, strongest in Asia-Pacific and South America | Short term (≤2 years) |
| Precision-Feeding Sensor Adoption | +0.5% | North America and Europe Lead | Long term (≥4 years) |
| Antibiotic-Reduction Policies | +0.9% | Europe and North America, expanding Asia-Pacific | Short term (≤2 years) |
| ASF-Related Biosecurity Investments | +0.7% | Asia-Pacific dominant | Medium term (2–4 years) |
| Carbon-Footprint Labelling by Packers | +0.4% | Europe and North America, emerging Asia-Pacific | Long term (≥4 years) |
| Source: Mordor Intelligence | |||
Feed Enzyme Cost-Efficiency Gains
Multi-enzyme cocktails deliver a 4–6% feed-conversion improvement, equivalent to a USD 8–12 extra margin per finished pig when corn exceeds USD 6 per bushel. Chinese provinces mandated digestible-phosphorus thresholds in 2025, effectively requiring phytase in every registered formula and accelerating adoption beyond 35% penetration levels in the Asia-Pacific region. Liquid-stable formats that withstand 85 °C pelleting now dominate launches, eliminating a former technical barrier. European feed mills report that enzyme ROI surpasses that of synthetic amino acids in grower diets, shifting their focus toward customized blends that match specific grain matrices. Enzyme suppliers leverage patent-protected thermostable variants, improving competitive insulation and nudging margins toward 25% gross levels compared with 8–10% for commodity supplements. The technology cascade arrives in South America as integrators seek cost buffers against crop-price swings, sustaining steady demand over the medium term. Regulatory acceptance remains favorable because enzymes lower total phosphorus excretion, supporting environmental compliance targets.
Mycotoxin Risk-Management Mandates
Aflatoxin and deoxynivalenol losses reached USD 6–18 billion globally in 2025, prompting regulators to tighten thresholds[1]Source: European Commission, “Regulation (EU) 2025/123 on maximum aflatoxin levels in animal feed,” ec.europa.eu. The European Union has reduced aflatoxin B1 limits in complete feed to 15 µg/kg, while China imposes random mycotoxin checks at provincial borders, creating operational disruptions for importers that once relied solely on port clearance. Toxin-binder volumes, encompassing yeast cell wall extracts and aluminosilicate clays, expanded 12% year on year, outpacing overall additive growth. The ISO 17025 laboratory capacity remains a constraint; a seven- to ten-day turnaround during harvest peaks forces mills to choose between accepting price premiums on certified grain and incurring rejection risk. Mills achieving verified low-mycotoxin status command 3–5% price premiums in export-oriented nursery feeds. Equipment vendors market on-site rapid test kits, but their higher false-negative rates keep full-lab confirmation in demand. Government subsidies for rapid-test technology in Vietnam and the Philippines could shorten detection times and broaden adoption among smallholders across the Asia-Pacific region.
Precision-Feeding Sensor Adoption
IoT-enabled silos, RFID-tagged bins, and cloud algorithms cut feed waste by 2–4% and labor by 15–20%, but the upfront costs of USD 50,000 to 150,000 per site deter sub-1,000-head farms that dominate Asia-Pacific. Payback shortened to 18 months during the Q2 2024 corn rally, triggering pilot uptake among U.S. integrators. Leasing models and data-as-a-service contracts now lower capital hurdles, yet patchy rural connectivity in inland China and Vietnam limits scale. Aggregated consumption data enables mills to shift from static nutrient specifications to dynamic least-cost formulas, resulting in an additional 1–2% feed-conversion gain and a 50-basis-point increase in mill margins. Sensor suppliers partner with genetic houses to harmonize feed curves with genotype-specific growth patterns, adding value in premium pork programs. Over the long term, LIDAR-based optical sensors could potentially replace weigh scales entirely, improving accuracy and reducing maintenance costs.
Antibiotic-Reduction Policies
Fully enforced bans in the European Union and phased U.S. state regulations removed 8,000–10,000 metric tons of in-feed antimicrobials annually by 2025. Substitutes such as organic acids, probiotics, and bacteriophages are projected to witness growth during the forecast period. However, they increase the overall feed cost per pig by USD 3–5. Export-oriented producers in Brazil and Denmark accept the premium to access antibiotic-free labels, which fetch 20% higher retail prices in Japan and South Korea. Regulatory ambiguity persists in China, where ionophores remain legal, creating a price wedge against imports. The European Food Safety Authority’s 2025 “essential use” guidance blurred the distinction between prophylactic and therapeutic definitions, complicating cross-border feed trade. Despite cost premiums, integrators see a marketing dividend, restaurant chains now require antibiotic-free pork for flagship menus, locking in demand for compliant feed. Probiotic suppliers in Thailand and Canada are ramping up capacity to hedge geopolitical risks and address tight Chinese vitamin supply chains.
Restraints Impact Analysis*
| Restraint | (~) % Impact on CAGR Forecast | Geographic Relevance | Impact Timeline |
|---|---|---|---|
| Volatile Corn and Soybean Prices | -1.2% | Global, acute in import-dependent Asia-Pacific, Middle East and Africa | Short term (≤ 2 years) |
| Tight Vitamin A and E Supply Chains | -0.6% | Global, highest exposure in Asia-Pacific | Medium term (2-4 years) |
| Regulatory Delays on Novel Additives | -0.4% | Europe primary, secondary North America | Long term (≥ 4 years) |
| Consumer Pushback on Gene-Edited Grain | -0.3% | Europe and selected Asia-Pacific markets | Long term (≥ 4 years) |
| Source: Mordor Intelligence | |||
Volatile Corn and Soybean Prices
Corn and soybean meal account for 65–75% of total formulation cost, leaving miller margins hostage to crop shocks. The 2024 South American drought cut Brazilian soy exports by 18 million metric tons, pushing prices to USD 16.80 per bushel, the highest since 2012, and compressing gross margins from 8–10% to 4–6%. Only integrators with origination arms hedged through crush margins, regional mills lacking futures access absorbed spot-price spikes or lost customers. Climate volatility raises U.S. corn yield variance from 6% in 2000–2010 to 9% in 2015–2025, eroding forward curve reliability. Smaller Asian mills often buy on a hand-to-mouth basis, suffering immediate hit rates when prices surge. Alternative proteins, such as insect meal, offer a partial hedge, yet remain 30–50% more expensive than soybean meal. Governments in Mexico and Indonesia reactivated talks on feed-grain subsidies in 2025, highlighting the political dimensions of commodity price swings. Until scalable substitutes emerge, raw-material risk remains the single largest drag on the CAGR of the swine feed market.
Tight Vitamin A and E Supply Chains
Vitamin A and E output is concentrated in three Chinese complexes that supply over 70% of global volume. A 2024 environmental shutdown in Zhejiang reduced capacity by 30% for five months, driving vitamin A prices from USD 18/kg to USD 72/kg. Premix producers rationed the supply from mills, lowered inclusion to the bare minimum nutritional limits, risking mild performance loss. European mills began dual-sourcing with DSM’s Scottish facilities, despite incurring 15–20% cost premiums, to hedge against the risk from China. Most feed mills increased safety-stock days from 30 to 90, tying up working capital. The complexity of chemical intermediates and stringent approvals deters new entrants, so supply concentration is anticipated to remain until at least 2028. Investment announcements by BASF and Zhejiang NHU to add 8,000 metric tons of capacity by 2027 may ease pressure, yet any delay could replay 2024’s spike[2]Source: BASF, “Vitamin A Production Update,” basf.com .
*Our forecasts treat driver/restraint impacts as directional, not additive. The impact forecasts reflect baseline growth, mix effects, and variable interactions.
Segment Analysis
By Ingredient Type: Cereals Leads Volume While Supplements Drive Value
Cereals maintained 58.4% ingredient share in 2025, reflecting their dual role in supplying energy and pellet structure. Wheat and barley account for 35–40% of European inclusion, where local agronomics prevail, while corn dominates at over 70% in the Americas and Asia. The supplements sub-segment, although accounting for a low share of the value, is growing at a 6.5% CAGR as nutritionists seek marginal feed-conversion improvements that outweigh the additional cost.
Oilseed meals hold a major share but face gradual substitution by insect meal and single-cell proteins as cost parity nears. Cereal by-products serve as cost buffers when grain prices peak. However, variable nutrient profiles and higher mycotoxin susceptibility limit their share of the premium formula. Oils and fats, though small by tonnage, earn attention for both energy density and dust suppression, while molasses grows significantly on the back of liquid-feeding systems. High-margin niche items, such as encapsulated butyrate, medium-chain triglycerides, and oregano extract, cluster in the “Others” basket and deliver gross margins of 30–50%, compared with commodity additions’ 5–8%.


By Supplement Type: Enzymes Lead Functional Additive Surge
Enzymes accounted for 22.4% of the supplement value in 2025 and are projected to grow at an 8.9% CAGR through 2031, outpacing vitamins and amino acids. Phytase reached near-universal adoption by 2024. However, the uptake of carbohydrases and proteases remains limited in the Asia-Pacific region due to cost concerns and distribution inertia. Thermostable variants launched in 2025 survive 90 °C pelleting, removing a major performance barrier. Vitamins claim a high share and mirror overall feed tonnage growth. Synthetic amino acids expand slowly but steadily, as environmental emissions caps push mills to reduce total crude protein.
The share of antibiotics dropped to very low levels after bans, with alternatives such as organic acids and essential oils rising. Acidifiers offer low-cost pH control in nursery diets. Probiotics and botanicals gain favor under “natural” positioning, even though field efficacy remains context-dependent. Mills increasingly demand tailor-made premixes that bundle multiple functionals for specific grain matrices, shifting competition from single ingredients to solution packages.
By Life Stage: Starter Feeds Command Premium Pricing
In 2025, finisher feeds accounted for 38.0% of the swine feed market, emphasizing cost efficiency through the inclusion of by-products to reduce ingredient expenses. The selective use of premium additives in this segment is projected to result in a limited growth rate. Suppliers in this category typically focus on promoting carcass quality and feed-cost savings to meet the stringent return-on-investment (ROI) requirements of large-scale operations. In contrast, starter feeds represent a high-value segment, growing at a 7.2% CAGR through 2031. This segment captured a significant value share, with prices ranging from USD 600 to USD 800 per metric ton.
Growth in the starter feed category is driven by the inclusion of specialty ingredients, such as spray-dried plasma and high-grade whey, which are crucial for gut development and achieving an average daily gain of over 450 grams within the first 35 days. The grower feed segment further supports the market by balancing amino acid precision and mineral chelates to optimize lean growth. Additionally, strategic investments in the piglet sector are reinforced by the European Union's regulatory approval of specialized additives, effective from 2025. These advancements in early-stage nutrition reduce the total market cycle by 7–10 days, enhancing facility throughput and profitability.
Geography Analysis
In 2025, the Asia-Pacific region accounted for 46.3% of the global swine feed market value, primarily driven by China's hog inventory of approximately 400–450 million heads, which represents around half of the global swine population[3]. The market in this region is projected to grow at a significant CAGR through 2031, driven by increasing industrialization in countries such as Vietnam and the Philippines. In these nations, smallholder farms are transitioning to commercial operations with 500–1,000 heads, creating demand for consistent, formulated feeds instead of farm-mixed rations. China's recovery from African Swine Fever (ASF) emphasizes biosecurity and traceability, benefiting large-scale integrators such as New Hope Group and Guangdong Haid Group, while reducing reliance on village-level mills. However, regional fragmentation remains a challenge. For instance, Indonesia and Thailand continue to have on-farm mixing rates of 30–40%, which limits the penetration of commercial feed. This presents opportunities for suppliers who can effectively demonstrate return on investment (ROI) to cost-conscious producers.
South America emerges as one of the fastest-growing regions, propelled by Brazil's expanding pork export capacity and Argentina's regulatory modernization in animal nutrition. Brazil's pork exports are projected to increase by 6.6% in 2025 to 1.22 million tons, necessitating domestic feed production growth of approximately 2.8% to support breeding operations and meet both domestic and international demand. The region's competitive advantage stems from low labor and feed costs, with companies like GSI targeting nearly USD 200 million in revenue within five years through the expansion of automation solutions for post-harvest systems.
Africa accounts for a good share of the market but is growing at a 6.9% CAGR, the fastest globally, driven by urbanization, increasing pork demand, and gradual improvements in infrastructure. South Africa and Nigeria contribute 60% of the region's feed demand. While urbanization and rising protein consumption support growth, challenges such as unreliable electricity, inadequate cold chain systems, and fragmented distribution networks restrict commercial feed penetration to 25–30% of total swine production. However, as logistics improve, significant opportunities for expansion remain.

Competitive Landscape
The top five players, including Cargill Incorporated, New Hope Group Co. Ltd., Charoen Pokphand Foods PCL, Archer Daniels Midland Company, and Nutreco N.V., accounted for a significant value share in 2025, indicating market fragmentation due to high transportation costs that favor local millers. Market leaders differentiate themselves through vertical integration and digital services, utilizing technologies such as automated near-infrared scanning and least-cost formulation software, which improve margins by 2–3%.
Patent filings for thermostable enzymes and encapsulated botanicals increased by 40% between 2022 and 2025, with Cargill Incorporated and DSM-Firmenich leading these advancements. Certification to ISO 22000 and GMP+ has become a standard requirement for supply agreements with multinational packers. Emerging players in insect protein (Ynsect, Protix) and single-cell protein (Calysta, Unibio) face cost challenges but maintain niche roles in starter feeds. Consolidation pressures are growing as packers demand Scope 3 carbon data only large mills can afford comprehensive full-chain audits, driving mergers in Europe and China.
Major companies are engaging in acquisitions, with Cargill Incorporated successfully bidding to acquire 100% of the shares of the Brazilian company Mig-Plus. This move aims to enhance their production capacity and expand market share in the emerging South American market. This deal is likely to be closed in the year 2026 which will impact the South American market significantly.
Swine Feed Industry Leaders
Cargill Incorporated
New Hope Group Co. Ltd.
Nutreco N.V. (SHV Holdings)
Charoen Pokphand Foods PCL (CP Group)
Archer Daniels Midland Company
- *Disclaimer: Major Players sorted in no particular order

Recent Industry Developments
- June 2025: The U.S. International Trade Commission initiated anti-dumping and countervailing duty investigations into Chinese L-lysine imports in response to a petition from the Lysine Fair Trade Coalition.
- February 2025: DSM-Firmenich announced plans to exit its animal nutrition and health business by the end of 2025, creating opportunities for rivals in vitamins, enzymes, and specialty additives.
- January 2025: Novus International partnered with Resilient Biotics to develop new feed solutions targeting swine immune health and respiratory challenges, with commercial products anticipated within three years.


Research Methodology Framework and Report Scope
Market Definitions and Key Coverage
According to Mordor Intelligence, we frame the global swine feed market as the aggregate value of finished compound rations, sold in mash, crumble, or pellet form, that are formulated specifically for pigs from birth to market weight and rely mainly on grains, oilseed meals, and functional additives. This definition tracks only commercial feed tonnage; on-farm cereal grains fed whole and equipment sales are kept outside the valuation.
Scope Exclusions: pet pig diets, probiotic boluses sold through pharmacies, and capital items such as precision feeders are not counted.
Segmentation Overview
- By Ingredient Type
- Cereals
- Cereal By-products
- Oilseed Meals
- Oil
- Molasses
- Supplements
- Others
- By Supplement Type
- Vitamins
- Amino Acids
- Antibiotics
- Enzymes
- Anti-oxidants
- Acidifiers
- Probiotics and Prebiotics
- Others
- By Life Stage
- Starter
- Grower
- Finisher
- By Geography
- North America
- United States
- Canada
- Mexico
- Rest of North America
- South America
- Brazil
- Argentina
- Rest of South America
- Europe
- Germany
- Spain
- Russia
- Rest of Europe
- Asia-Pacific
- China
- Vietnam
- Philippines
- Rest of Asia-Pacific
- Middle East
- Saudi Arabia
- Iran
- Rest of Middle East
- Africa
- South Africa
- Nigeria
- Rest of Africa
- North America
Detailed Research Methodology and Data Validation
Primary Research
Multiple semi-structured discussions with nutritionists, feed-mill managers, integrators, and regional veterinarians across Asia-Pacific, the Americas, and Europe helped us validate inclusion rates, average selling prices, and likely adoption curves for specialty additives, filling gaps that desktop work alone cannot close.
Desk Research
Our analysts begin with high-volume data sets from reputable public sources such as FAO livestock statistics, USDA PSD pork balances, Eurostat feed production surveys, China MARA, and customs trade flows. Complementary context around ingredient costs and disease incidence is gathered through academic journals, OIE alerts, and association portals like the International Feed Industry Federation. Company 10-Ks, investor decks, and D&B Hoovers snapshots enrich margin and capacity insights, while Questel patent trends shed light on additive innovation. This list is illustrative; many other open and paid references shaped the desk analysis.
Market-Sizing & Forecasting
A top-down model starts with official pig inventory, slaughter, and pork output for each country. It then reconstructs annual feed demand through feed conversion ratios and age-stage ration matrices. Results are cross-checked with sampled bottom-up inputs, mill capacity roll-ups, and channel checks on prevailing ASPs to fine-tune totals. Key variables include global pork production, regional FCR trends, corn and soybean meal price indices, ASF outbreak impact factors, additive penetration rates, and policy shifts on antibiotic use. Multivariate regression with an ARIMA overlay projects these drivers to 2030, while scenario analysis tests ingredient price shocks before finalizing growth paths.
Data Validation & Update Cycle
Outputs pass three layers of peer review, variance screens versus independent indicators, and a senior sign-off. Models refresh every year, and mid-cycle updates are triggered when material events, such as major disease flare-ups or ingredient price swings, arise.
Why Mordor's Swine Feed Baseline Commands Reliability
Published figures differ because firms choose dissimilar market scopes, pricing references, and refresh cadences. Ingredient inclusion, treatment of premix sales, and currency bases commonly widen the gap.
Key gap drivers in our comparison show that some providers net out specialty additives or bundle premix and complete feed together, while others inflate revenue by applying aggressive forward ASP escalators or older exchange rates.
Benchmark comparison
| Market Size | Anonymized source | Primary gap driver |
|---|---|---|
| USD 125.3 B (2025) | Mordor Intelligence | - |
| USD 114.8 B (2025) | Regional Consultancy A | Excludes functional additives and values feed at producer-level transfer prices |
| USD 135.6 B (2025) | Global Consultancy B | Combines premix revenue with finished feed and assumes uniform 4 % annual price inflation |
Alternative 2025 estimates therefore range roughly from USD 115 billion to USD 136 billion, yet our balanced middle figure is anchored to transparent livestock statistics and validated cost curves, giving decision-makers a dependable reference point.
In short, Mordor's disciplined variable selection, mixed-method modeling, and annual refresh cycle provide a traceable, repeatable baseline that helps clients act with confidence.


Key Questions Answered in the Report
How large will the swine feed market be by 2031?
It is projected to reach USD 220.60 billion, growing at a 5.50% CAGR from 2026.
Which region is expanding fastest in the swine feed market?
Africa leads with a 6.9% CAGR through 2031 as urbanization boosts pork consumption and commercial feed penetration rises.
Why are enzymes gaining share in swine rations?
Multi-enzyme blends improve feed-conversion ratios by 4–6%, delivering USD 8–12 extra margin per pig when grain prices run high.
How is African swine fever (ASF) influencing global feed demand?
ASF outbreaks can depress regional feed consumption for up to 18 months, cutting hog feed output by millions of tons in affected areas.
What is driving starter-feed premium pricing?
Specialized ingredients such as spray-dried plasma and encapsulated acids support piglet gut development, cutting market cycle by up to 10 days.
Page last updated on:


