Solid Oxide Fuel Cells (SOFC) Market Size and Share
Market Overview
| Study Period | 2021 - 2031 |
|---|---|
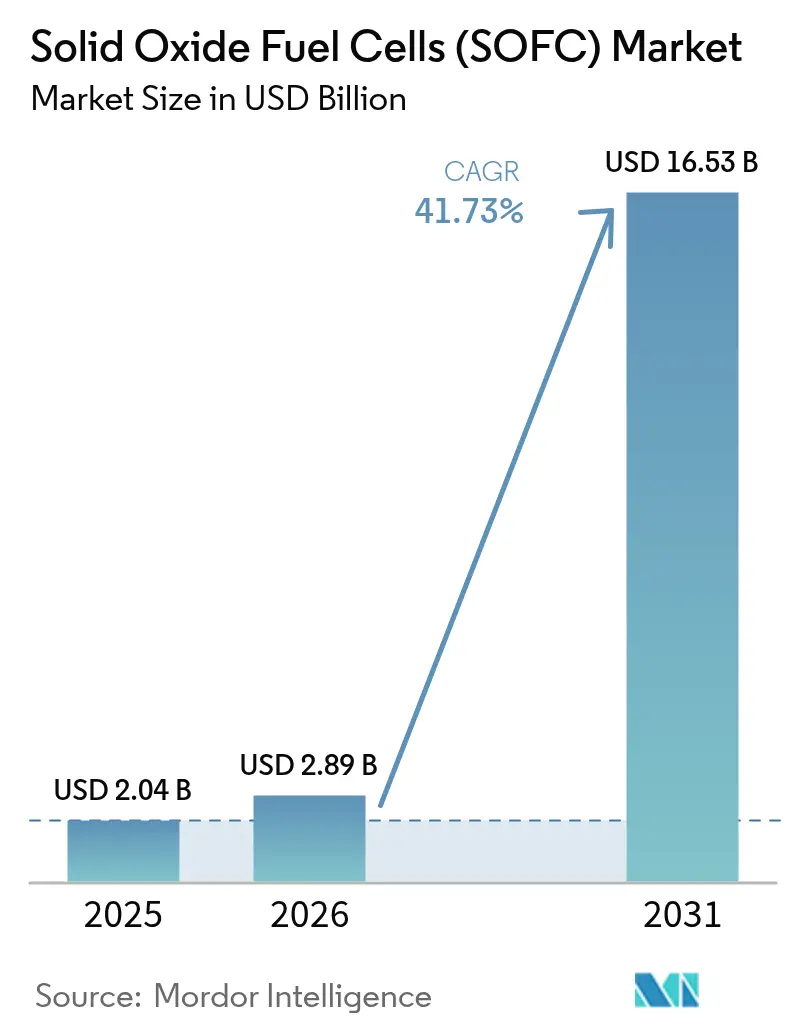
| Market Size (2026) | USD 2.89 Billion |
| Market Size (2031) | USD 16.53 Billion |
| Growth Rate (2026 - 2031) | 41.73% CAGR |
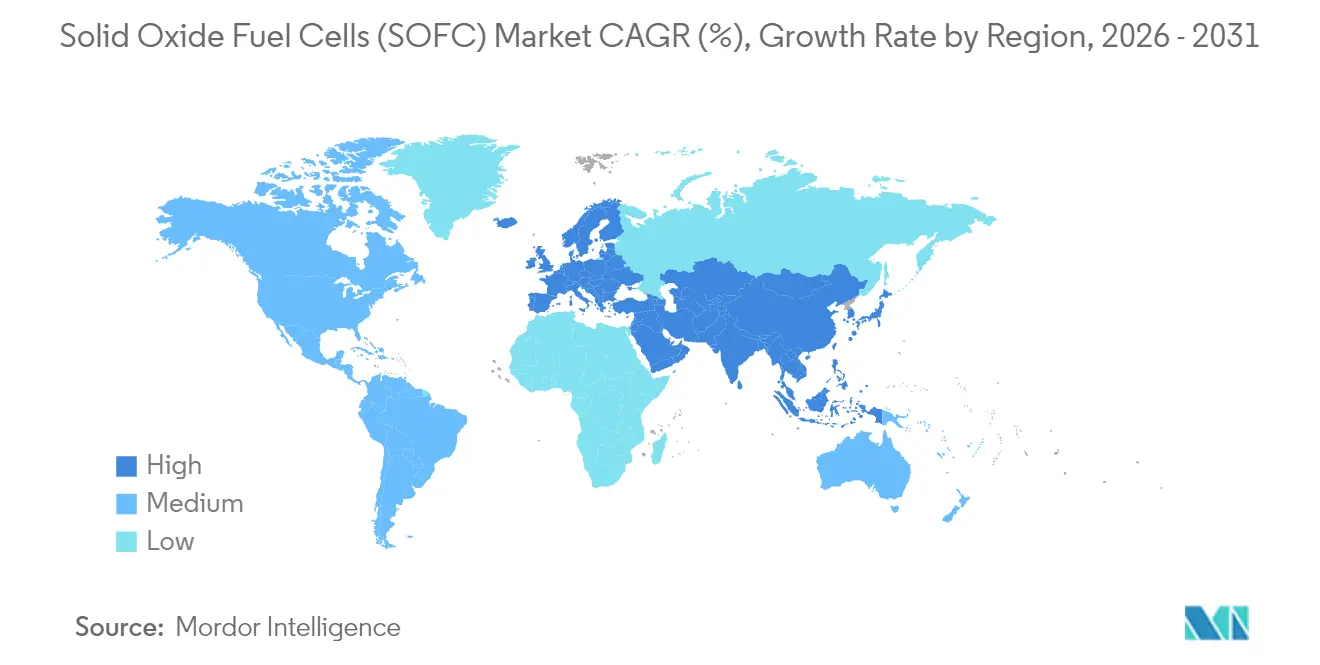
| Fastest Growing Market | Asia Pacific |
| Largest Market | North America |
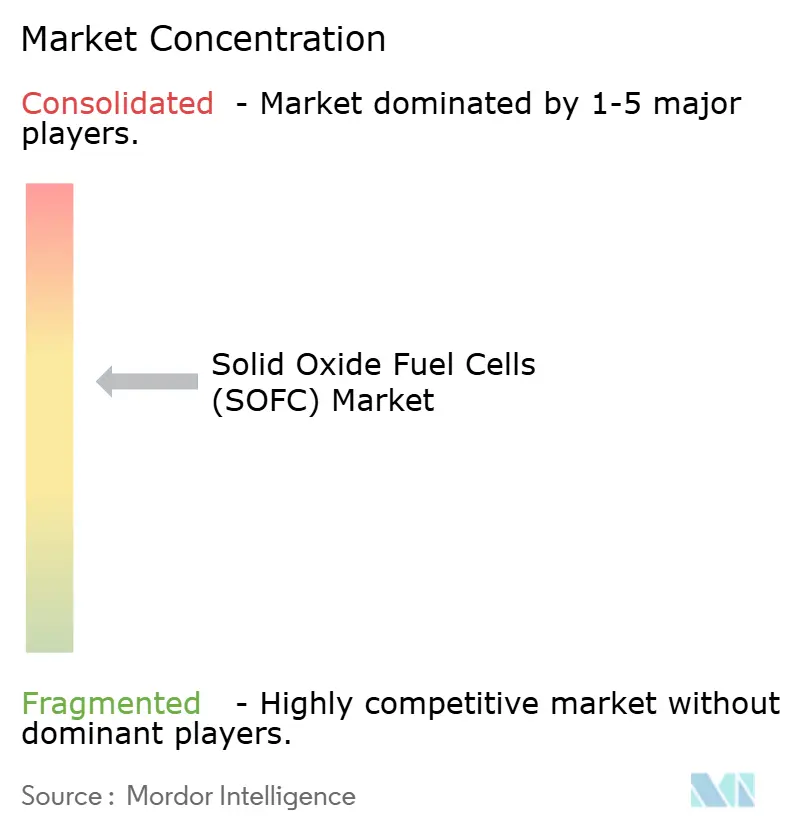
| Market Concentration | Medium |
Major Players *Disclaimer: Major Players sorted in no particular order Image © Mordor Intelligence. Reuse requires attribution under CC BY 4.0. | |
Solid Oxide Fuel Cells (SOFC) Market Analysis by Mordor Intelligence
The Solid Oxide Fuel Cells (SOFC) Market size was valued at USD 2.04 billion in 2025 and estimated to grow from USD 2.89 billion in 2026 to reach USD 16.53 billion by 2031, at a CAGR of 41.73% during the forecast period (2026-2031).
Rising tax incentives in the United States, Japan’s long-running Ene-Farm rebates, and enterprise demand for resilient onsite generation are reinforcing a technology roadmap that targets lower ceramic-stack costs and longer lifetimes. North American data-center operators continue to replace diesel backup with high-efficiency SOFC microgrids, while Asian policymakers fund residential and utility pilots to accelerate domestic hydrogen uptake. Modularity, fuel flexibility, and compatibility with carbon-capture heat integration are emerging as decisive differentiators even as suppliers race to automate stack assembly and qualify scandium-free electrolytes.[1]U.S. Department of Energy, “Hydrogen and Fuel Cell Technologies Office,” energy.gov
Key Report Takeaways
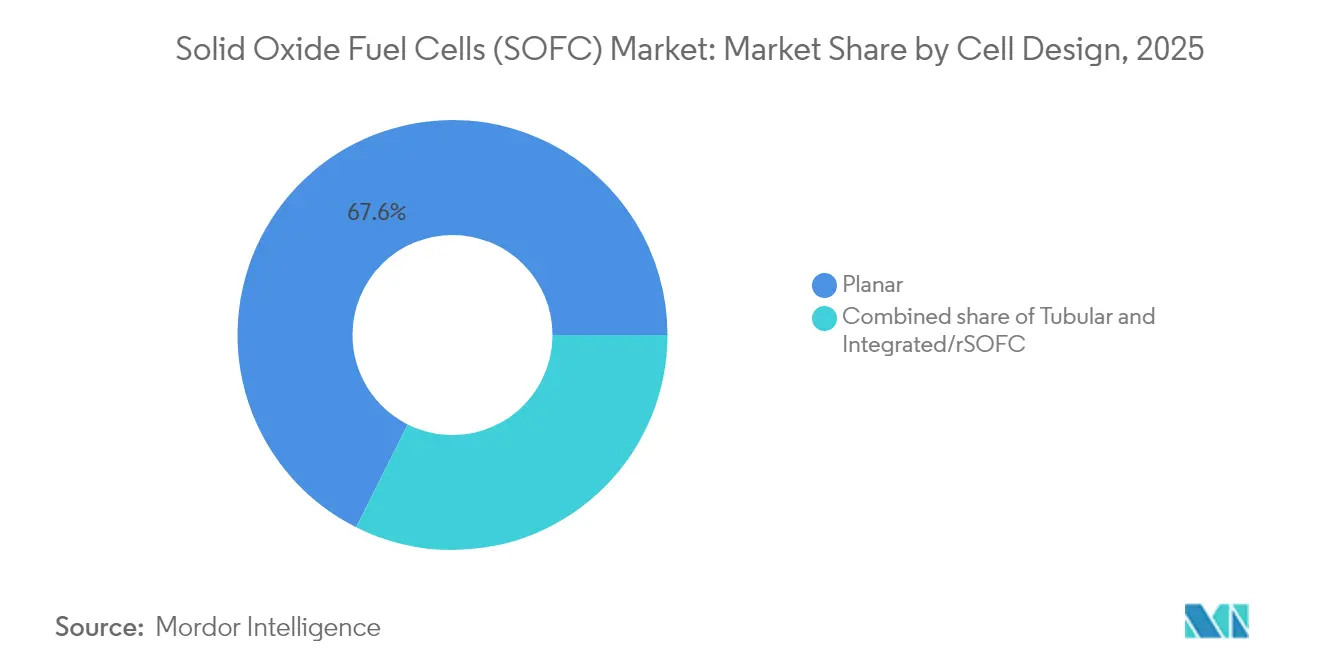
- By cell design, planar architectures held 67.60% of the Solid Oxide Fuel Cells market share in 2025, whereas integrated and reversible stacks are forecast to rise at a 48.30% CAGR through 2031.
- By application, stationary power commanded 74.15% revenue in 2025; portable and micro-power is advancing at a 47.60% CAGR to 2031.
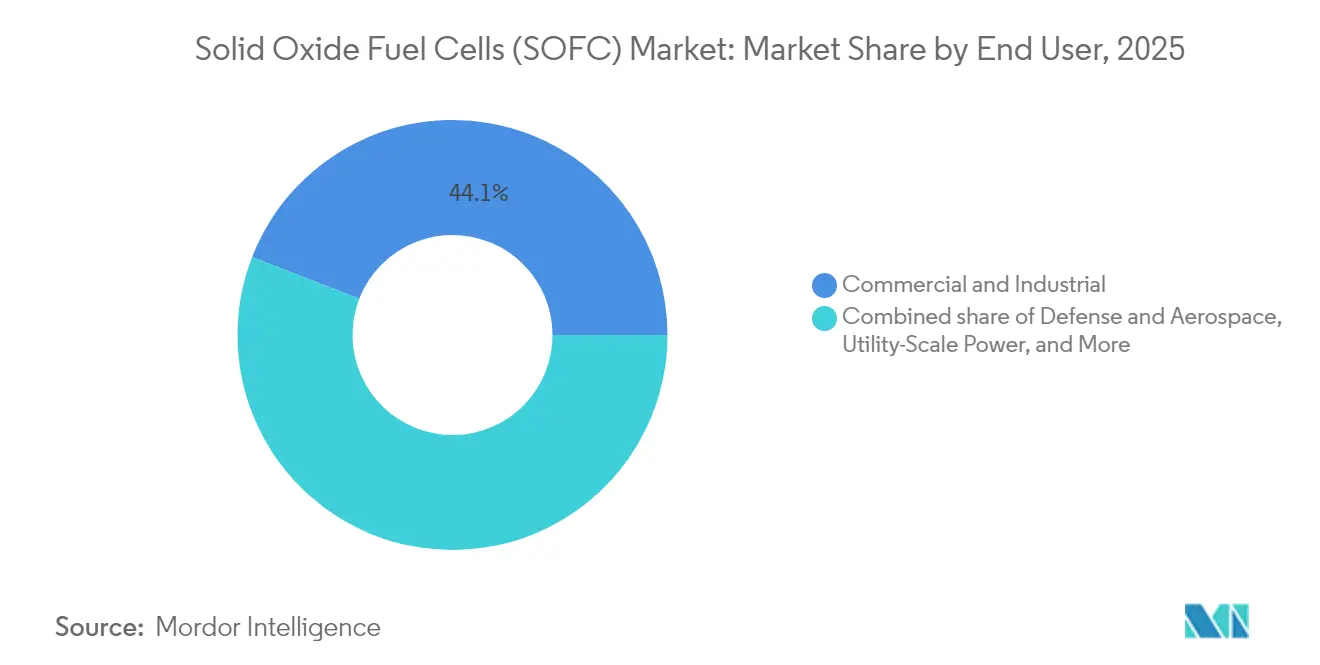
- By end user, commercial and industrial facilities generated 44.10% of 2025 demand, but defense and aerospace procurement is expanding at a 46.20% CAGR through 2031.
- By geography, North America captured 74.65% revenue in 2025, while Asia-Pacific is on track for a 48.90% CAGR, the fastest regional pace to 2031.
Note: Market size and forecast figures in this report are generated using Mordor Intelligence’s proprietary estimation framework, updated with the latest available data and insights as of 2026.
Global Solid Oxide Fuel Cells (SOFC) Market Trends and Insights
Drivers Impact Analysis*
| Driver | (~) % Impact on CAGR Forecast | Geographic Relevance | Impact Timeline |
|---|---|---|---|
| Government subsidies & net-zero mandates | +8.2% | North America, Europe, Japan | Medium term (2-4 years) |
| Data-center & micro-grid resilience needs | +7.5% | North America, APAC core | Short term (≤ 2 years) |
| Expanding green-hydrogen infrastructure | +6.8% | Global, early gains in EU, California, Japan | Long term (≥ 4 years) |
| Carbon-capture-ready industrial furnaces | +5.1% | Europe, North America | Long term (≥ 4 years) |
| Maritime auxiliary power shift | +4.3% | Global shipping routes, APAC yards | Medium term (2-4 years) |
| Emergence of reversible SOFCs | +5.6% | Europe, California, Australia | Long term (≥ 4 years) |
| Source: Mordor Intelligence | |||


Government Subsidies & Net-Zero Mandates Accelerate Stationary SOFC Deployment
Federal investment credits of up to 30% and hydrogen production credits of USD 3 per kilogram are compressing payback periods, prompting commercial campuses to adopt SOFC combined heat and power. Germany’s EUR 9 billion hydrogen roadmap and Japan’s subsidy extension through 2025 underwrite large purchase orders and stimulate mass-production lines that pull ceramic stack costs toward the USD 1,000 per kilowatt goal.[2]U.S. Internal Revenue Service, “Energy Investment and Hydrogen Production Credits,” irs.gov
Data-Center & Micro-Grid Demand for Resilient, High-Efficiency Power
Hyperscale operators require 99.999% uptime and see SOFC microgrids as a route to decarbonize standby generation and reduce diesel dependence. Georgia Tech’s 200-kilowatt installation demonstrates grid-parallel operation with 60% electrical efficiency, while Bloom Energy reports that data-center sales already account for 38% of revenue, with average order sizes trending toward 1 megawatt.[3]Georgia Institute of Technology, “SOFC Microgrid Installation,” gatech.edu
Expanding Green-Hydrogen Infrastructure Leverages SOFC Fuel Flexibility
Seven U.S. regional hydrogen hubs and Europe’s 42.5% renewable-hydrogen mandate increase pipeline-blending pilots that align with SOFC’s ability to run on 5-100% hydrogen. DOE’s Hydrogen Shot seeks USD 1 per kilogram production costs by 2030, a threshold that would let hydrogen-fueled stacks compete with gas turbines during peak pricing windows.
Carbon-Capture-Ready Industrial Furnaces Adopting SOFC Exhaust Heat Recovery
High-grade SOFC exhaust at 600-800 °C can regenerate solvents in amine capture systems, bringing the levelized cost of CO₂ removal below USD 50 per ton. Pilot projects in steel and petrochemicals record combined efficiencies above 85%, yet capital cost remains 40% higher than traditional turbines, signaling scale-up potential once carbon pricing deepens.
Restraints Impact Analysis*
| Restraint | (~) % Impact on CAGR Forecast | Geographic Relevance | Impact Timeline |
|---|---|---|---|
| High ceramic stack cost & cap-ex hurdles | −5.3% | Global | Short term (≤ 2 years) |
| Durability degradation at 600-800 °C | −3.8% | Global, high-cycling sites | Medium term (2-4 years) |
| Price-volatile scandia-stabilized zirconia | −2.9% | Global, China & Russia supply | Medium term (2-4 years) |
| Permitting uncertainty for H₂-NG blends | −2.1% | North America, Europe | Short term (≤ 2 years) |
| Source: Mordor Intelligence | |||
High Ceramic Stack Cost & Cap-Ex Hurdles
Ceramic fabrication still accounts for nearly 60% of system cost, keeping installed prices at USD 4,000-6,000 per kilowatt. DOE roadmaps target a 75% cost reduction by 2030 through automation and alternative electrolytes, but today’s vendors remain volume-constrained with gross margins under 30%.
Durability/Degradation at 600-800 °C Operating Range
Stack life must double to meet 40,000-hour targets. Chromium migration, nickel coarsening, and electrode delamination cause 0.2-1.0% performance loss per 1,000 hours, forcing vendors to invest in barrier coatings, gadolinium-doped ceria layers, and predictive-maintenance analytics.[4]Journal of Power Sources, “SOFC Cathode Degradation Studies,” sciencedirect.com
*Our forecasts treat driver/restraint impacts as directional, not additive. The impact forecasts reflect baseline growth, mix effects, and variable interactions.
Segment Analysis
By Cell Design: Planar Dominance Faces Reversible-SOFC Disruption
Planar stacks delivered 67.60% of the Solid Oxide Fuel Cells market share in 2025, owing to their high power density and compatibility with screen-printing lines. Tubular cells remain valued for thermal-shock tolerance but hold roughly 20% revenue. Integrated reversible designs are projected to grow 48.30% CAGR on seasonal-storage demand. FuelCell Energy’s 3-kilowatt prototype achieved 85% electrolysis efficiency, confirming technical readiness for multi-megawatt pilots, while Sunfire secured EUR 215 million to scale 10-megawatt modules by 2027.
Manufacturers work to eliminate brittle glass seals in planar stacks, extend life past 60,000 hours, and raise automated throughput. Tubular platforms avoid seal failure yet trade power density and raise machining complexity. Ceres Power’s steel-supported cell adds compressive seals that reduce thermal-cycle stress and cut material cost by 30%. As vendors converge on USD 1,000 per kilowatt, reversible stacks may reset design leadership, moving the Solid Oxide Fuel Cells market toward hybrid power-to-gas architectures.


By Application: Stationary Power Anchors Growth While Portable Segments Accelerate
Stationary systems generated 74.15% of 2025 revenue, underpinned by campus microgrids, industrial cogeneration, and Ene-Farm residential rollouts that leverage combined heat and power. Portable and micro-power shipments are forecast to climb 47.60% CAGR through 2031 as defense agencies adopt 1-10 kilowatt silent generators and telecom towers replace diesel gensets in remote regions. Transportation APUs, now about 15% of demand, begin to penetrate marine and aviation niches, but capital intensity still limits fleet-wide adoption.
Stationary buyers earn demand-charge savings, renewable-certificate income, and frequency-regulation fees that compress payback to under six years in high-tariff markets. Portable devices lack these grid revenues, so cost parity relies on logistic savings and weight reduction, especially for military and sensor payloads. Demonstrated reductions in field fuel consumption keep the Solid Oxide Fuel Cells market attractive across disparate duty cycles.
By End User: Commercial Sites Lead, Defense Orders Surge
Commercial and industrial facilities supplied 44.10% of 2025 shipments, leveraging 55-60% electrical efficiency and high-grade waste heat. Defense and aerospace procurement is rising 46.20% CAGR as silent operation and multi-fuel capability address forward-base logistics. Residential installations, dominated by Japan, represent 25% of unit volume but only 12% of revenue because of smaller system sizes. Utility-scale projects above 10 megawatts remain rare, comprising less than 5% of capacity.
Bloom Energy’s 10-year power-purchase contracts transfer performance risk and stabilize cash flows, while military buyers accept premium prices for fuel flexibility that eliminates hazardous fuel convoys. Residential uptake outside Japan stays subdued at USD 15,000-25,000 per system, yet subsidy extensions and heat-pump pairings could lift consumer adoption rates. The diverse customer mix intensifies competition as suppliers tailor financing and service packages across the Solid Oxide Fuel Cells market.
Geography Analysis
North America commanded 74.65% revenue in 2025, anchored by more than 1 gigawatt of Bloom Energy installations and by a USD 750 million federal grant program for electrolyzer and fuel-cell manufacturing. California’s Self-Generation Incentive Program adds up to USD 1.50 per watt, cutting commercial payback below six years. Canada supplies compliance credits under its Clean Fuel Regulations, while Mexico operates a 10-megawatt pilot for remote mines; permitting delays remain a bottleneck.
Asia-Pacific is the fastest-growing region with a projected 48.90% CAGR to 2031. Japan’s Ene-Farm surpassed 500,000 residential units by 2024 and targets 5.3 million by 2030, sustaining mass-production learning curves. South Korea’s Renewable Portfolio Standard classifies SOFC power plants as renewable, enabling lucrative certificate trading that underwrites new 40-megawatt projects. China aligns SOFC pilots with its 14th Five-Year Plan for distributed generation, yet low pipeline gas coverage slows widespread rollout.
Europe accounts for about 12% revenue, driven by Germany, the United Kingdom, and Nordic countries linking SOFCs to hydrogen storage and offshore wind. Germany’s EUR 9 billion hydrogen strategy creates anchor demand for reversible stacks that bid into power and gas markets. The United Kingdom guarantees revenue floors through contracts-for-difference, while Denmark and Norway test offshore-wind-coupled hydrogen generation. Latin America, the Middle East, and Africa collectively hold under 3% share, but Brazil, Saudi Arabia, and South Africa are lining up pilot capacity that could open new export and grid-resilience opportunities within the Solid Oxide Fuel Cells market.

Regulatory Landscape
Policy support for SOFC deployment is increasingly tied to clean-hydrogen, distributed generation, and net-zero manufacturing frameworks. In the United States, the incentives cited in the report (energy investment credits up to 30% and clean hydrogen production credits up to USD 3/kg) operate alongside DOE efforts that include reversible SOFC pathways for hydrogen production and power, with DOE planning for 2026 aligned to milestones covering larger-scale R-SOFC testing for hydrogen production. Together, these elements influence project economics for commercial onsite power, hydrogen-ready microgrids, and early rSOFC demonstrations.
In Europe, Regulation (EU) 2024/1735 (Net-Zero Industry Act) establishes a policy umbrella focused on strengthening domestic net-zero technology manufacturing, which is directly relevant to decisions on SOFC stack and system localization. On the R&D and demonstration side, the Clean Hydrogen Joint Undertaking Annual Work Programme 2026 points to continued public funding for hydrogen production technology scale-up, supporting progress in higher-TRL electrolyzer and related high-temperature pathways. In the United Kingdom, hydrogen allocation rounds, HAR3 in 2025 and HAR4 in 2026, also set a visible cadence for how hydrogen supply and offtake contracts are structured for fuel-flexible SOFC and rSOFC use cases.
Value Chain Analysis
The SOFC value chain runs from upstream materials and components to system integration. Upstream inputs include ceramic electrolyte powders and substrates, electrode materials, metallic or ceramic interconnects, and glass-ceramic sealants, followed by cell manufacturing and stack assembly (including sealing, coatings, and manifold integration), and finally balance-of-plant and power electronics integration into packaged systems for stationary, portable, and emerging maritime applications. In practice, ceramic fabrication and stack processing steps dominate manufacturing economics, while qualification requirements, including the safety and hydrogen-quality compliance referenced in the report context, add testing infrastructure and documentation needs that favor scaled producers and experienced integrators.
On the downstream side, projects increasingly move through energy service providers and large integrators that can manage permitting, EPC, O&M, and performance-backed commercial structures for data centers and industrial sites. Partnership activity reflects this shift: Centrica and Ceres have aligned on multi-gigawatt onsite fuel cell and electrolysis deployments across the UK and Europe, while Centrica and Delta Electronics introduced an off-grid fuel cell power solution aimed at data centers and energy-intensive industries. For marine and offshore expansion, MODEC, Eld Energy, and Delta are also building a development track for SOFC marine/offshore power modules, adding an integration layer for ruggedization, marine certification, and onboard power architectures.
Competitive Landscape
The Solid Oxide Fuel Cells market remains moderately concentrated: Bloom Energy, Mitsubishi Power, Ceres Power, Sunfire, and FuelCell Energy control roughly 60% of world capacity. Bloom operates a 400-megawatt factory, Mitsubishi maintains in-house ceramic processing, and Ceres licenses its steel-cell IP to Bosch, Weichai, and Doosan. Patent filings center on chromium-barrier coatings and machine-learning diagnostics, with Bloom and Ceres each holding more than 800 active patents.[7]U.S. Patent and Trademark Office, “SOFC Patent Database,” uspto.gov
New entrants such as Elcogen and Convion focus on reversible electrolysis and marine auxiliary units. Elcogen reports degradation under 0.3% per 1,000 hours through gadolinium-doped ceria layers, offering 10-year warranties that undercut incumbent replacement cycles. Sunfire’s pressurized reversible stacks operate at 10-30 bar, improving round-trip efficiency by up to 12 percentage points and trimming balance-of-plant footprint.
Digital integration is now a key differentiator: Bloom’s software upgrade lets its servers earn USD 40-60 per kilowatt-year in California frequency-regulation markets, shaving 18 months off payback. Compliance with IEC 62282 safety codes and ISO 14687 hydrogen-quality rules demands a rigorous testing infrastructure that favors scale players. White-space prospects include auxiliary power for more than 100,000 ocean-going vessels, SOFC-CCS hybrids in heavy industry, and seasonal hydrogen storage, none yet commercialized at utility scale.
Solid Oxide Fuel Cells (SOFC) Industry Leaders
Bloom Energy Corp.
Mitsubishi Power
Ceres Power Holdings PLC
Sunfire GmbH
FuelCell Energy Inc.
- *Disclaimer: Major Players sorted in no particular order

Market Opportunities and Future Outlook
Near-term whitespace is concentrated in grid-constrained, energy-dense loads that prioritize rapid deployment and onsite resiliency, especially hyperscale and AI data centers. The report points to high-volume commercial frameworks supporting that demand: Bloom Energy expanded its strategic partnership with Oracle to deploy up to 2.8 GW of fuel cell systems for data center power infrastructure, and Bloom also announced a gigawatt-scale procurement agreement with American Electric Power (AEP) for AI data centers. Financing is reinforcing the deployment pathway, with Bloom and Brookfield expanding their AI infrastructure financing framework to USD 25 billion, supporting power-as-a-service structures where customers prefer contracted onsite power rather than asset ownership.
A second opportunity track is scaling through local manufacturing and consortium-led qualification. In South Korea, Doosan Fuel Cell began mass production of SOFC power systems using Ceres technology (50 MW annual capacity referenced in the evidence), and SK Eternix started commercial operations at a 40 MW SOFC power plant, which can help standardize O&M practices and improve bankability for new builds. Outside stationary power, maritime and offshore auxiliary and primary applications are being formalized through consortia and developer-integrator collaboration (including MODEC, Eld Energy, and Delta), creating openings for suppliers that can meet marine-duty cycles and modularization needs while supporting fuel-flexible operation across ammonia, LNG, and hydrogen transition pathways. On the technology side, DOE reversible SOFC R&D funding (up to USD 4 million announced in 2024) and EU hydrogen programs keep rSOFC/SOEC convergence active, supporting hybrid architectures that connect onsite power, high-temperature electrolysis, and industrial heat integration.
Recent Industry Developments
- June 2026: Bloom Energy and Brookfield expanded their AI infrastructure partnership to a USD 25 billion framework to build and finance rapid power for AI infrastructure. The scale of the financing platform supports larger multi-site deployments and helps keep repeatable project structures in place for data center customers. It also increases the role of third-party capital in turning SOFC systems into standardized power-as-a-service offerings.
- April 2026: Bloom Energy and Oracle expanded their strategic partnership via a master services agreement to deploy up to 2.8 GW of fuel cell systems, with an initial 1.2 GW already contracted. The agreement creates a high-volume, multi-geography demand signal that can affect stack production planning and supplier qualification across Bloom's ecosystem. It also reinforces SOFCs as a primary-power option for fast-growing data center campuses dealing with grid interconnection constraints.
- July 2025: Doosan Fuel Cell began mass production of fuel cell power systems using Ceres technology at its SOFC factory in Jeollabuk-do, South Korea. Moving from development to mass production expands available supply for utility and commercial projects and supports localization strategies in Asia-Pacific. The ramp also validates the licensing-led manufacturing model that Ceres uses with multiple industrial partners.


Research Methodology Framework and Report Scope
Market Definition and Coverage
This market is defined as revenues generated from solid oxide fuel cell systems and related solutions that deliver electrical power (often with heat recovery) across stationary, transportation auxiliary power, and portable uses, measured at the point of sale to end users.
Scope exclusions: We exclude upstream commodity fuels and broad hydrogen infrastructure, along with general grid equipment that is not part of an SOFC system sale.
Segmentation Overview
- By Cell Design
- Planar
- Tubular
- Integrated/rSOFC
- By Application
- Stationary Power
- Transportation Powertrain and APU
- Portable and Micro-Power
- By End User
- Residential
- Commercial and Industrial
- Utility-Scale Power
- Defense and Aerospace
- By Geography
- North America
- United States
- Canada
- Mexico
- Europe
- United Kingdom
- Germany
- France
- Spain
- NORDIC Countries
- Russia
- Rest of Europe
- Asia-Pacific
- China
- India
- Japan
- South Korea
- ASEAN Countries
- Rest of Asia-Pacific
- South America
- Brazil
- Argentina
- Colombia
- Rest of South America
- Middle East and Africa
- Saudi Arabia
- United Arab Emirates
- South Africa
- Egypt
- Rest of Middle East and Africa
- North America
Data Sources, Market Sizing, and Validation
Desk Research
Desk work started with building a clear view of SOFC technology and the deployment base, since demand depends heavily on energy policy, local grid economics, and the sequencing of project pipelines. We used public sources such as energy agency publications, government energy statistics, customs and trade releases, national labs and research institutes, and peer-reviewed journals that track SOFC performance and durability trends.
To make the model usable, we also collected directional inputs from company annual reports, investor presentations, association updates, and reputed business press that cover announced projects in data centers, microgrids, and industrial CHP. Select paid subscriptions were used only for company financials and intelligence, patent databases, and an import and export shipment level database to cross-check activity signals where public datasets were thin. These examples are not exhaustive, and we referenced many other public sources for data collection, validation, and research clarification.
Primary Interviews and Surveys
Primary work was used to stress-test what we saw in public sources, especially around current installations, typical system sizing, stack replacement timing, and how pricing changes as volumes scale. We spoke with a mix of manufacturers, component suppliers, integrators, EPC-linked stakeholders, and end users across major demand pockets, and then used the feedback to tighten assumptions and confirm adoption constraints by application and region.
Distribution of primary research fieldwork respondents
| Company type | Respondent position | Region |
|---|---|---|
| Top tier: 35% | CXOs: 14% | APAC: 41% |
| Mid tier: 46% | Functional/Unit leaders: 36% | EMEA: 37% |
| Smaller Players: 19% | Managers: 50% | Americas: 22% |
Market-Sizing & Forecasting
Sizing was built using a top-down approach where we used policy support, announced project pipelines, and distributed generation adoption indicators to reconstruct an addressable demand pool for SOFC systems by region, then translated that into value using application-level pricing logic. To keep the totals realistic, we corroborated the outputs with selective bottom-up checks, such as sampling shipment volumes where available, rolling up a set of supplier revenues, and using a typical ASP multiplied by expected unit volumes for key applications.
A few inputs mattered most in the model: the mix of stationary versus transportation APU demand, typical system capacity ranges used in commercial and industrial sites, the pace of deployments in data center and microgrid resilience projects, stack replacement cycles that affect aftermarket revenue, and the expected direction of system ASP as manufacturing scales. Forecasting relied on scenario analysis, since policy timing and project execution can shift year to year, and the scenarios were anchored to what interviewees described as realistic rollout speeds and bottlenecks. Where bottom-up signals were incomplete, the gaps were handled through conservative penetration assumptions that were rechecked by application and region before final aggregation.
Data Validation & Update Cycle
Validation was done by triangulating results across independent signals and then checking for large jumps that did not align with project timing or known policy changes. We reviewed outliers by region and application, rechecked currency conversion timing, and revisited any step where a single assumption could swing total value too much.
Before sign-off, the model and key inputs go through multi-step analyst review, and interview follow-ups are triggered when a major variance appears versus public project tracking or company guidance. The report is refreshed annually, and interim updates are made when material events occur, such as large capacity additions, policy changes, or meaningful shifts in pricing. Right before delivery, a final pass is done so clients receive the most current view available at that time.
Mordor Intelligence's Global Solid Oxide Fuel Cells Market Market Size Compared With Other Published Estimates
Published market sizes for solid oxide fuel cells often vary because firms do not always count the same revenue items, and they also choose different starting years and forecast windows. Differences in how pricing is treated and how quickly capacity and adoption are assumed to scale also tend to widen the spread.
The main gap comes from whether reversible or integrated SOFC designs and the attached balance-of-plant value are counted consistently across applications. In this view, Mordor Intelligence counts these items only when they are sold as part of an SOFC system solution aligned to stationary, transportation APU, or portable use cases. Separate choices on base year (2024 versus 2025), currency timing, and how much weight is given to announced projects versus confirmed deployments can further move the headline number.
Benchmark comparison
| Source | Market Size | Gaps in Research Methodology |
|---|---|---|
| Mordor Intelligence | USD 2.04 B (2025) | |
| Global Consultancy A | USD 1.00 B (2024) | Uses an earlier base year and a narrower revenue capture approach that leans heavily toward current stationary deployments, which can undercount newer integrated designs and later-stage project pipelines. |
| Industry Association B | USD 2.70 B (2024) | Builds a higher 2024 starting point that appears to include a broader component and system value stack, and its forecast window and adoption ramp assumptions differ from a deployment-tied roll-forward. |
Looking across the three figures, the spread is mainly explained by what gets counted in system value, which year is used as the anchor, and how aggressively projects are assumed to convert into operating installations. By keeping the inputs tied to application demand signals and rechecking price and replacement-cycle assumptions, the estimate stays traceable to steps that can be repeated and stress-tested.


Key Questions Answered in the Report
How large is the Solid Oxide Fuel Cells market in 2026?
The Solid Oxide Fuel Cells market size stands at USD 2.89 billion in 2026 and is expected to reach USD 16.53 billion by 2031.
What is the forecast CAGR for Solid Oxide technology?
Between 2026 and 2031 the market is projected to grow at a 41.73% CAGR, the highest among mainstream fuel-cell platforms.
Which region leads current deployments?
North America holds 74.65% of 2025 revenue thanks to strong policy support and sizable data-center installations.
Which application segment is expanding the fastest?
Portable and micro-power systems, notably defense generators and telecom backups, are projected to grow at 47.60% CAGR through 2031.
What factor most constrains wider adoption?
High ceramic stack costs remain the key hurdle, with current systems priced at USD 4,000-6,000 per kilowatt, far above the USD 1,000 target.
Who are the dominant suppliers today?
Bloom Energy, Mitsubishi Power, Ceres Power, Sunfire, and FuelCell Energy jointly control roughly 60% of manufacturing capacity.
Page last updated on:


