Refurbished Medical Devices Market Size and Share
Market Overview
| Study Period | 2020 - 2031 |
|---|---|
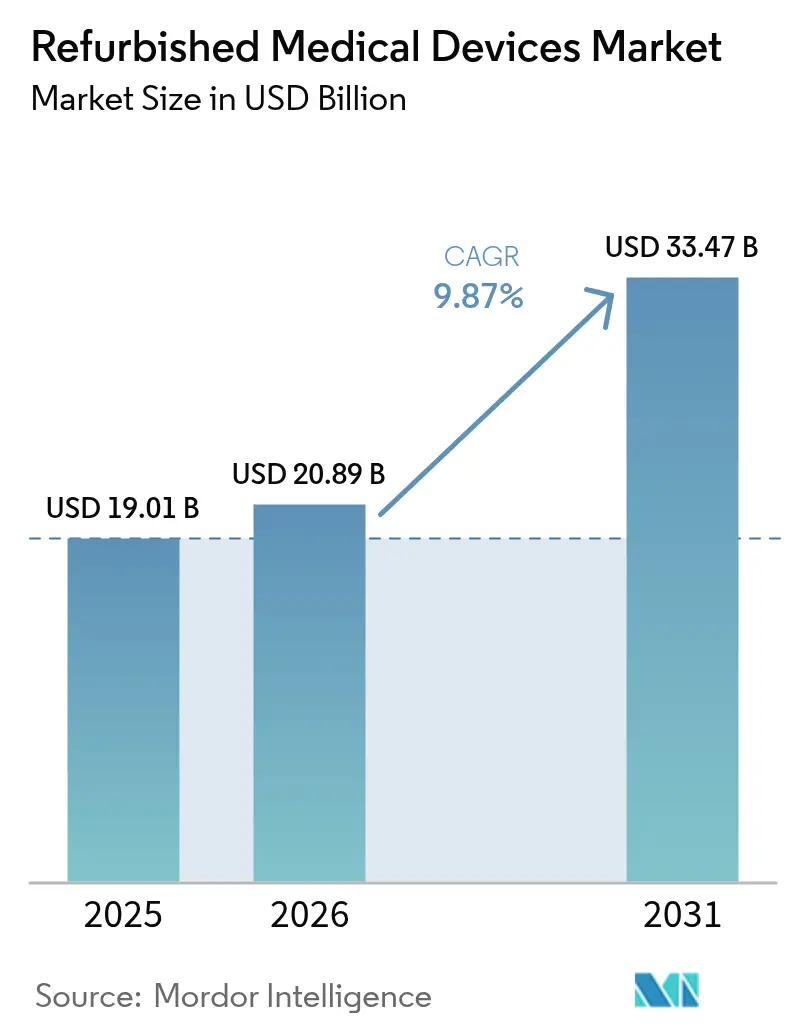
| Market Size (2026) | USD 20.89 Billion |
| Market Size (2031) | USD 33.47 Billion |
| Growth Rate (2026 - 2031) | 9.87% CAGR |
| Fastest Growing Market | Asia Pacific |
| Largest Market | North America |
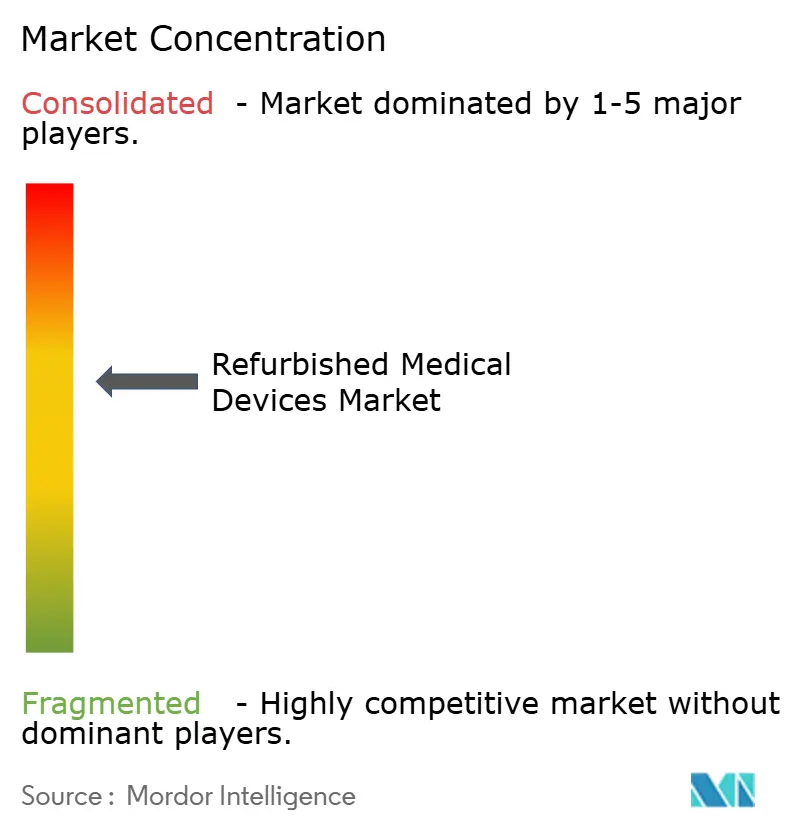
| Market Concentration | Medium |
Major Players *Disclaimer: Major Players sorted in no particular order Image © Mordor Intelligence. Reuse requires attribution under CC BY 4.0. | |
Refurbished Medical Devices Market Analysis by Mordor Intelligence
The refurbished medical devices market size in 2026 is estimated at USD 20.89 billion, growing from 2025 value of USD 19.01 billion with 2031 projections showing USD 33.47 billion, growing at 9.87% CAGR over 2026-2031. Hospitals, ambulatory surgical centers, and independent diagnostic providers increasingly prefer refurbished units because they combine reliable performance with 40–60% savings on capital outlays. The growth momentum also mirrors hospital budget constraints, a turn toward circular-economy purchasing rules, and faster certification cycles for AI-ready imaging systems. A widening pool of private diagnostic centers across Asia and Latin America compounds demand, while digital auction platforms boost liquidity in the secondary equipment chain. On the supply side, original-equipment-manufacturer (OEM) refurbishers retain brand trust and command premium price points, yet independent refurbishers are scaling rapidly by targeting underserved geographies and niche modalities.
Key Report Takeaways
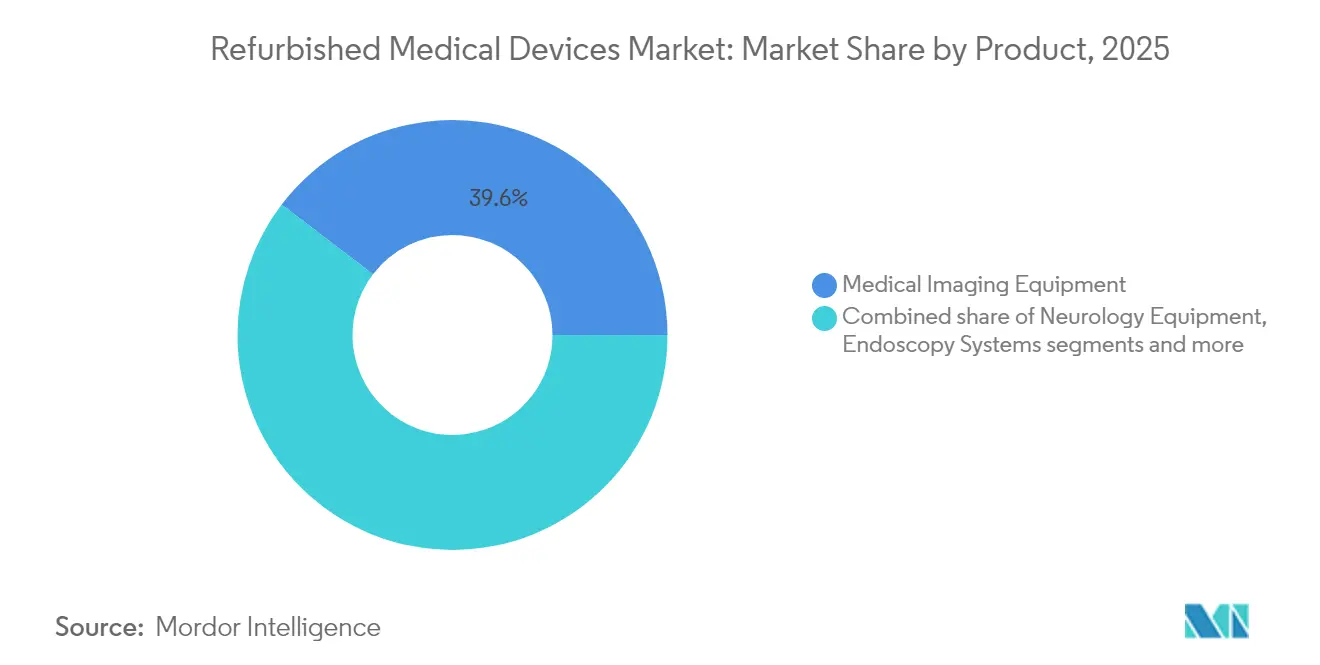
- By product category, medical imaging equipment led with 39.62% of refurbished medical devices market share in 2025; operating room and surgical equipment is forecast to expand at an 11.63% CAGR to 2031.
- By refurbishment provider, OEM-certified channels held 64.02% share of the refurbished medical devices market in 2025, while independent and in-house refurbishers are growing at a 10.55% CAGR through 2031.
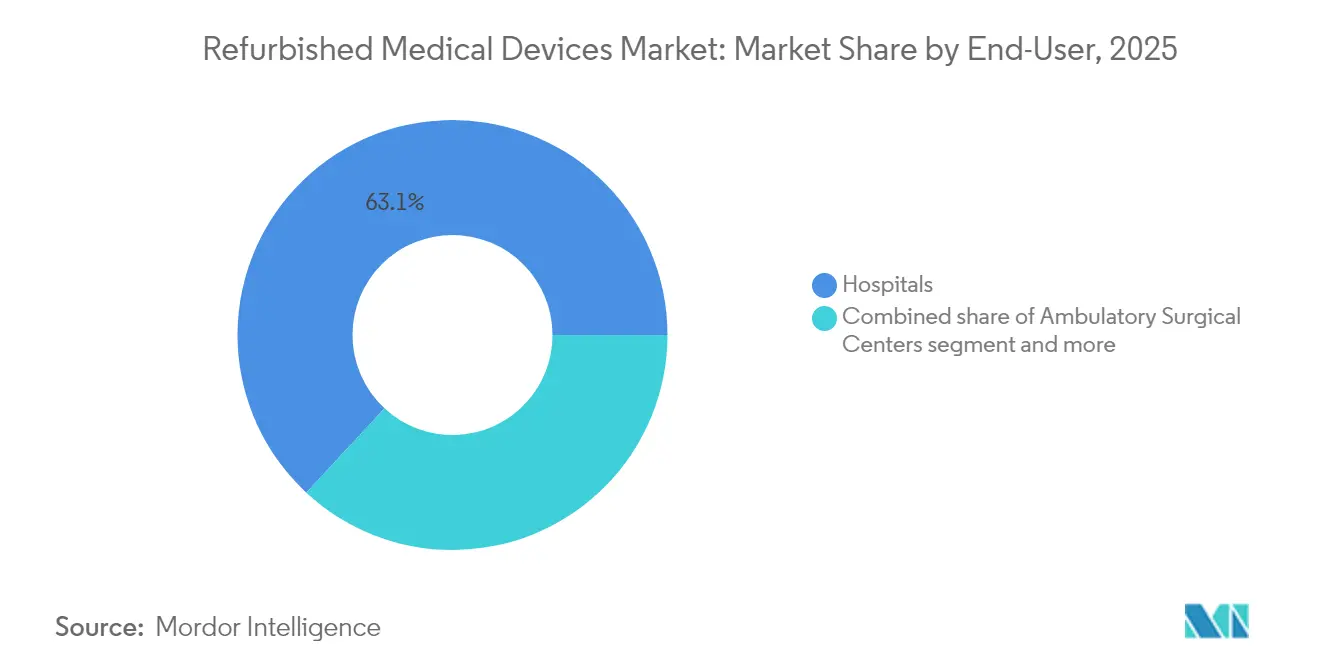
- By end-user, hospitals accounted for 63.10% share of the refurbished medical devices market size in 2025, and ambulatory surgical centers are advancing at an 11.34% CAGR through 2031.
- By geography, North America commanded 39.55% of the refurbished medical devices market size in 2025; Asia-Pacific is projected to post the fastest 11.12% CAGR between 2026 and 2031.
Note: Market size and forecast figures in this report are generated using Mordor Intelligence’s proprietary estimation framework, updated with the latest available data and insights as of 2026.
Global Refurbished Medical Devices Market Trends and Insights
Drivers Impact Analysis*
| Driver | (~) % Impact on CAGR Forecast | Geographic Relevance | Impact Timeline |
|---|---|---|---|
| Healthcare cost-containment imperatives | +2.8% | North America, Europe, global spillover | Short term (≤ 2 years) |
| Circular economy compliance push | +1.9% | Europe, North America, Asia-Pacific spillover | Medium term (2-4 years) |
| AI-ready imaging upgrade cycle | +1.7% | North America, Europe, developed Asia-Pacific | Medium term (2-4 years) |
| Proliferation of private diagnostic centers | +1.5% | Asia-Pacific, Middle East & Africa, South America | Short term (≤ 2 years) |
| Tax incentives for pre-owned equipment | +1.2% | North America, selected European and Asian countries | Short term (≤ 2 years) |
| Emergence of online auction platforms | +0.8% | Global, strongest in North America | Medium term (2-4 years) |
| Source: Mordor Intelligence | |||
Healthcare cost-containment imperatives
Hospitals spent USD 146.9 billion on medical supplies in 2023 while facing USD 130 billion in Medicare and Medicaid under-payments[1]American Hospital Association, “Costs of Caring,” American Hospital Association, aha.org, sharpening the need for equipment that stretches budgets without reducing care quality. Refurbished magnetic resonance scanners, which list 40–60% below the cost of a new unit, free capital for workforce and digital investments. In 2023, the average replacement age for imaging systems rose 7.1%, evidence that providers are lengthening asset cycles and viewing refurbished purchases as a strategic hedge against delayed reimbursements. The driver is most acute inside advanced reimbursement systems, especially in the United States, where marginal revenue pressure forces chief financial officers to treat total cost of ownership as the primary purchase criterion.
Circular-economy compliance push
Health systems across Europe embed lifecycle rules in capital budgets, rewarding equipment that re-enters value chains rather than entering landfill. OEMs respond by redesigning scanners and monitors with modular parts that can be swapped quickly during reconditioning. The refurbished medical devices market benefits from these rules because sustainable procurement cuts raw-material demand while still meeting performance norms. Pilot projects that recycle metals and polymers from diagnostic probes now demonstrate safe reuse pathways. Broad acceptance requires manufacturers, regulators, and hospital groups to agree on shared testing benchmarks, but early adopters already report measurable emissions reductions alongside budget savings.
AI-ready imaging upgrade cycle
Facilities that cannot afford new AI-native scanners are commissioning refurbished CT or MRI units that receive upgraded GPUs and analytics software during reconditioning. These “smart refurbished” devices offer lesion-detection algorithms and predictive maintenance dashboards at about half the price of factory-new AI systems. The new value tier broadens the use of computer-assisted diagnostics, especially in North American radiology practices where AI adoption is brisk. As a result, the refurbished medical devices market now segments by intelligence level as well as by modality, creating fresh margin opportunities for refurbishers capable of integrating software and cyber-security patches.
Proliferation of private diagnostic centers
India, Brazil, and Nigeria add hundreds of stand-alone imaging clinics each year, many operating under lean management structures that cap initial capital at USD 500,000. Operators gravitate toward refurbished branded scanners rather than new entry-level options from lesser-known firms because reliability underpins referral trust. In Indian metropolitan hubs, refurbished ultrasound and X-ray systems make up an estimated 35% of new clinic installations[2]India Brand Equity Foundation, “Medical Devices Industry in India – Market Share, Growth & Scope,” ibef.org, underpinning the double-digit growth of the refurbished medical devices market in the region.
Restraints Impact Analysis*
| Restraint | (~) % Impact on CAGR Forecast | Geographic Relevance | Impact Timeline |
|---|---|---|---|
| Post-market regulatory scrutiny | -1.2% | Europe, North America, global | Medium term (2-4 years) |
| Non-transferable OEM warranties | -0.9% | Global | Short term (≤ 2 years) |
| Calibration integrity concerns for linear accelerators | -0.7% | Global, intense in emerging markets | Medium term (2-4 years) |
| Standards fragmentation and price volatility | -0.6% | Global cross-border trade | Long term (≥ 4 years) |
| Source: Mordor Intelligence | |||
Post-market regulatory scrutiny
Divergent compliance rules complicate cross-border shipments of used devices. In the United States the Food and Drug Administration requires premarket clearance, whereas the European Union enforces conformity under the Medical Device Regulation (EU) 2017/745. These layered reviews lengthen lead times and increase document costs, particularly for complex products such as PET-CT scanners. Providers that operate multinational clinic networks therefore favor refurbishment partners with in-house regulatory teams.
Non-transferable OEM warranties
Several major manufacturers restrict warranty coverage once equipment changes ownership or undergoes third-party servicing. Hospitals often accept OEM-certified refurbishment at a higher price to secure service continuity for critical care devices. Independent refurbishers answer with third-party insurance packages, yet these add transaction cost and cannot fully close the assurance gap, tempering some near-term uptake.
*Our forecasts treat driver/restraint impacts as directional, not additive. The impact forecasts reflect baseline growth, mix effects, and variable interactions.
Segment Analysis
By Product: Imaging equipment anchors value and AI boosts turnover
Medical imaging equipment accounts for the largest 39.62% slice of the refurbished medical devices market in 2025 and continues to set price benchmarks for the category. The installed base of magnet resonance and computed tomography systems built between 2015 and 2020 is now entering second-life cycles, and refurbishers can restore those platforms by swapping coils, updating detectors, and upgrading software. X-ray and ultrasound units deliver lower ticket sizes yet sell in higher volume, especially into secondary hospitals in Southeast Asia and West Africa. The AI retrofit wave widens margins further because predictive analytics modules or computer-aided diagnosis plug-ins add tangible clinical value without new hardware. As a result, the refurbished medical devices market size for the imaging segment is forecast to climb in line with the overall 9.87% trajectory.
The operating room and surgical equipment niche is the fastest-growing product cohort and is expected to record 11.63% CAGR through 2031. Ambulatory surgical centers favor refurbished anesthesia machines, tables, and endoscopy towers because these units accelerate time to revenue at lower risk. OEM parts availability has also improved, allowing refurbishment workshops to validate sterility and electrical safety to the same standards as new equipment. Electrosurgical platforms and laparoscopic systems lend themselves to modular component swaps, shortening refurbishment cycle times. End-user demand now spans community hospitals in the United States as well as high-acuity centers in the Gulf states, confirming that value recognition is spreading beyond budget-constrained facilities.


By Refurbishment Provider: OEM dominance meets independent agility
OEM-certified refurbishers held 64.02% of the refurbished medical devices market share in 2025. They leverage proprietary schematics, factory parts bins, and integrated service teams to promise uptime levels identical to new installations. Hospitals attach high weight to brand support for advanced modalities such as interventional cardiology labs and linear accelerators, so OEM programs continue to command price premiums that preserve market leadership. These channels further strengthen customer lock-in because they synchronize software licenses and cybersecurity patches with corporate road maps.
Independent and in-house refurbishers are scaling faster, growing at a 10.55% CAGR. Their competitive edge stems from shorter quotation cycles, the ability to cannibalize multiple donor units to restore legacy platforms, and the willingness to handle niche brands that OEMs no longer support. The United States Food and Drug Administration confirmed in a Food and Drug Administration Reauthorization Act (FDARA) 710 study that qualified third-party servicers can meet safety norms. This finding boosted credibility across the refurbished medical devices market. Collaborations between independents and original manufacturers are emerging in parts sourcing, while blockchain-based certificates record each test result, easing traceability concerns for cross-border buyers.
By End-User: Hospitals remain core while outpatient sites accelerate
Hospitals commanded 63.10% of the refurbished medical devices market size in 2025. Integrated delivery networks write multi-year capital plans that treat refurbished equipment as a hedge against reimbursement uncertainty. Teaching hospitals update standard monitoring or infusion fleets through refurbishment to reroute funds toward breakthrough therapies. Extended warranties and service-level agreements ensure risk profiles match those of new assets, sustaining confidence even for cardiology cath labs and high-field MR scanners.
Ambulatory surgical centers represent the fastest-growing end-user slice with an 11.34% CAGR outlook. Procedure migration to outpatient settings drives investment in anesthesia, endoscopy, and minimally invasive surgical stacks. Refurbished towers or C-arms reduce per-procedure depreciation and help centers pass savings to payers. Diagnostic imaging centers further round out demand, especially in urban India and China, where middle-income populations require accessible scans but capital budgets remain tight. Clinics that outsource maintenance to third-party specialists create recurring service revenue streams for refurbishers and raise switching barriers over time.
Geography Analysis
North America generated 39.55% of global revenue in 2025 as reimbursement pressures, large installed bases, and Section 179 deductions aligned to favor second-life equipment. Many hospital chains run centralized asset-management dashboards that benchmark refurbishment against new-buy scenarios, which helps justify upgrades that meet cyber-security guidelines. Canadian provincial health networks similarly analyze lifecycle costs, and their preference for proven OEM recertification maintains steady demand for high-end scanners and ventilators.
Asia-Pacific is the fastest-growing region, with the refurbished medical devices market size projected to expand at 11.12% CAGR from 2026 to 2031. China and India anchor volume, but secondary hubs such as Vietnam and Indonesia illustrate the ripple effect as private insurance enrollment expands. The region's regulatory landscape is evolving, with countries like Malaysia developing specific guidelines for refurbishment through their Medical Device Authority, creating more structured pathways to market. Regional refurbishment centers in South Korea and Singapore shorten shipping times and simplify customs clearance, while newly issued guidelines from local regulators clarify intake inspections and labeling rules. The resulting predictability reassures private investors who run imaging chains or day-surgery clinics.
Europe retains a pivotal position, advancing at 9.43% CAGR. Environmental procurement directives and the Medical Device Regulation create both headwinds and tailwinds. Compliance costs rise, yet public hospitals now score tender bids partly on carbon footprint, a metric that naturally elevates refurbished options. Germany, France, and the United Kingdom lead volume, whereas Eastern European markets show the fastest percentage increases because structural funds earmark money for diagnostic build-outs. Regional innovators also pilot cloud-linked refurbishment documentation, which can feed directly into electronic equipment passports under EU policy.


Regulatory Landscape
Regulation of refurbished medical devices continues to tighten around manufacturer-level accountability and documented process controls, which raises compliance requirements for third-party refurbishers while improving buyer confidence. In the United States, the FDA maintains a distinction between servicing or maintenance and remanufacturing, and remanufacturing triggers stricter obligations tied to the original device safety and performance specifications. This distinction was reinforced through FDA remanufacturing guidance updates during 2024 and into 2026. In Europe, Regulation (EU) 2017/745 (MDR) governs device lifecycle compliance, and MDR definitions around rebuilding used devices into compliant products shape how refurbishers build quality management systems, technical documentation, and post-market surveillance.
Emerging markets are formalizing refurbishment pathways through national Good Refurbishment Practice requirements and import controls. Malaysia, through the Medical Device Authority, requires third-party refurbishers to hold establishment licenses as manufacturers and to register refurbished devices via MeDC@St, in line with refurbished medical device requirements and GRPMD-style controls. Nigeria (NAFDAC) and Ethiopia (EFDA) have published refurbishment guidelines that restrict changes to intended use or specifications and require traceable documentation for authorization, bringing refurbishment closer to regulated manufacturing in practice. Internationally, IEC 63077:2019 is a recognized process standard in medical imaging refurbishment and can support cross-border acceptance when paired with complete refurbishment records.
Value Chain Analysis
The refurbished medical device value chain starts with equipment sourcing and reverse logistics, where hospitals, imaging centers, and other providers de-install devices and route them through OEM buyback programs, brokers, or digital auction platforms. These channels help match surplus assets in mature markets with demand in cost-sensitive regions. Refurbishment operations then depend on access to donor units, certified parts and components, test fixtures, and modality-specific technical expertise, especially for imaging and operating room systems. The workflow culminates in reconditioning, software resets or updates where permitted, recalibration, electrical safety and performance testing, and issuance of documentation and a fresh warranty. Distribution and installation run through OEM service organizations, independent distributors or remarketers, and increasingly direct-to-provider channels that bundle financing, delivery, and service-level agreements.
Key value-chain constraints cluster around proprietary parts and technical documentation, non-transferable OEM warranties, and uneven regulatory re-certification requirements across borders, which can extend lead times for complex modalities such as PET-CT and MRI. OEM-certified programs tend to retain an advantage through factory parts access and integrated service networks, while independent refurbishers often respond with faster turnaround and flexibility in restoring legacy platforms using multiple donor units. Regulatory and standards alignment, including FDA remanufacturing versus servicing distinctions, MDR expectations for technical documentation, and country-specific pathways such as Malaysia registration via MeDC@St, influences how refurbishers design quality systems and which players can scale reliably across geographies.
Competitive Landscape
The refurbished medical devices market displays moderate concentration. GE HealthCare, Philips, and Siemens Healthineers run factory refurbishment programs that pair original parts with new-equipment warranties, reinforcing brand loyalty. Their divisions also act as buyback channels, securing a steady inflow of de-installed devices that can be recertified. Meanwhile, Avante Health Solutions, Soma Tech Intl, Block Imaging International, and US Med-Equip cultivate specialization: Avante and Soma Tech Intl focus on ultrasound and monitoring, Block on imaging modalities, and US Med-Equip on rental hybrids.
Technology is reshaping rivalry. NFT-backed certificates[4]Senay A. Gebreab, “Trusted Traceability and Certification of Refurbished Medical Devices Using Dynamic Composable NFTs,” IEEE Access, researchgate.net track every inspection and software update, reducing asymmetric information that once advantaged OEMs. Independent refurbishers deploy augmented-reality guidance to field engineers so that calibration steps match OEM torque values in real time. Digital auction houses widen reach and set reference prices, weakening opaque broker networks. Hybrid partnerships now emerge where independents secure selective OEM parts access in exchange for geographic exclusivity, signaling a shift from binary competition toward cooperative ecosystems.
Successful players differentiate through after-sale service. Multi-year maintenance bundles, guaranteed swap stock for mission-critical equipment, and remote monitoring platforms all raise the value ceiling. As reimbursement systems penalize downtime and infection incidents, buyers judge refurbishers less on headline price and more on risk mitigation. Companies that wrap financing, installation, and compliance documentation into single contracts therefore stand to outgrow price-only competitors.
Refurbished Medical Devices Industry Leaders
Avante Health Solutions
GE Healthcare
Koninklijke Philips N.V.
Siemens Healthcare Systems
Soma Technology
- *Disclaimer: Major Players sorted in no particular order

Market Opportunities and Future Outlook
Opportunities concentrate in compliance-led, traceability-heavy refurbishment models that reduce buyer friction in cross-border trade, and in high-value modalities where installed bases are moving into second-life cycles. Regulatory clarity around remanufacturing versus servicing in the United States, and manufacturer-accountability concepts embedded in EU MDR 2017/745, creates room for refurbishers that can run manufacturer-grade QMS, produce complete technical documentation, and maintain post-market processes, especially for AI-ready imaging that includes validated software, cybersecurity patching, and performance verification. As countries such as Malaysia formalize refurbished device requirements through the Medical Device Authority and MeDC@St registration, scaled refurbishers with standardized intake inspection, labeling, and documentation can shorten approval and procurement cycles.
Regional refurbishment capacity and circular-economy procurement also translate into demand beyond hospitals into outpatient settings. GE HealthCare opened a refurbishing unit in Bangladesh for A1-Sure ultrasound systems, reflecting how localized refurbishment centers can improve access and logistics for fast-growing private diagnostic networks in emerging markets. Another area of opportunity sits at the intersection of sustainability and lifecycle management, where health systems look for documented reuse and reduced landfill impact. Partnerships that extend the usable life of high-impact components, such as MRI magnets, and programs that formalize OEM-grade Circular Edition or equivalent offerings can support premium refurbished tiers alongside independent channels. Constraints such as import prohibitions on certain used critical-care devices, for example under India hazardous waste rules for specific equipment categories, also increase the need for modality-specific compliance playbooks, selective product focus, and stronger documentation for legitimate, authorized flows.
Recent Industry Developments
- April 2026: University of Rochester Medicine partnered with GE HealthCare to refurbish MRI imaging equipment, including reuse of 4,000-pound magnets to extend system lifecycles and reduce landfill waste. The collaboration shows how large provider systems and OEM programs are operationalizing circular-economy goals within imaging fleets while protecting performance and safety expectations. It also underscores OEM-certified refurbishment as a pathway for high-value modalities where component handling and documentation requirements are stringent.
- February 2025: Avante Health Solutions completed its sale to an affiliate of Staple Street Capital Group, following a restructuring process that positioned the business to operate with a cleaner balance sheet. The transaction supports continued scale-up in refurbished device categories such as patient monitoring and ultrasound, where independents compete on turnaround time and service bundling. The ownership change also strengthens Avante's ability to invest in inventory, service infrastructure, and geographic reach in the secondary equipment chain.
- April 2024: GE HealthCare launched a refurbishing unit in Bangladesh for its A1-Sure ultrasound systems, targeting improved access to affordable diagnostics in underserved areas. By adding regional refurbishment capacity, the company reduced reliance on long-distance reverse logistics and shortened service cycles for a high-volume modality. The update increases competitive pressure on independent refurbishers in South Asia by pairing localized availability with OEM process controls and warranty-backed offerings.


Research Methodology Framework and Report Scope
Market Definition and Coverage
This market covers the global sale of medical devices that were previously used and then restored through an organized refurbishment process, so they can be resold with verified performance and a fresh warranty, where applicable.
Scope exclusions: We exclude devices sold strictly as-is, single-use disposable items, and short-term rental fleets that do not transfer ownership.
Segmentation Overview
- By Product
- Medical Imaging Equipment
- X-ray Machines
- Ultrasound Systems
- MRI Machines
- CT Scanners
- Nuclear Imaging (PET, SPECT, PET/CT)
- Other Imaging Devices
- Operating Room & Surgical Equipment
- Anaesthesia Machines
- Electrosurgical Units
- Surgical Microscopes
- CO? & Agent Monitors
- Other OR Equipment
- Patient Monitoring Devices
- Multiparameter Monitors
- ECG Devices
- NIBP Monitors
- Cardiovascular & Cardiology Equipment
- Neurology Equipment
- Endoscopy Systems
- ICU & Critical-Care Equipment
- Renal & Dialysis Equipment
- Other Medical Equipment
- Medical Imaging Equipment
- By Refurbishment Provider
- OEM-Certified Refurbishers
- Independent & In-House Refurbishers
- By End-User
- Hospitals
- Ambulatory Surgical Centers
- Diagnostic Imaging Centers
- Other End-Users
- By Geography (Value)
- North America
- United States
- Canada
- Mexico
- Europe
- Germany
- United Kingdom
- France
- Italy
- Spain
- Rest of Europe
- Asia-Pacific
- China
- India
- Japan
- Australia
- South Korea
- Rest of Asia-Pacific
- Middle East & Africa
- GCC
- South Africa
- Rest of Middle East & Africa
- South America
- Brazil
- Argentina
- Rest of South America
- North America
Data Sources, Market Sizing, and Validation
Desk Research
Desk research sets the starting frame for the model by anchoring how demand forms in hospitals, diagnostic centers, and specialty clinics, and how supply is created through OEM and independent refurbishing channels. We typically review public health spending and hospital infrastructure signals from sources such as the World Health Organization, the World Bank, OECD health statistics, and national health ministries.
To connect scope to real device movement, we also reference trade and classification signals from sources such as UN Comtrade, customs and tariff schedules, and medical device regulator portals, including US FDA databases and similar national registries. Company filings, annual reports, investor presentations, and reputable healthcare press are used to cross-check product mix and pricing direction, and a paid subscription covering company financials and news is used selectively when public disclosures are limited. These sources are not exhaustive, and many other public documents and data points are reviewed to collect, validate, and clarify inputs.
Primary Interviews and Surveys
Primary interviews help turn the desk assumptions into a workable market model, especially around refurbishment yields, price ranges versus new equipment, and what qualifies as a sellable refurbished unit in each region. We speak with refurbishers, service providers, distributors, and procurement stakeholders across APAC, EMEA, and the Americas, so the demand pool and practical selling conditions can be checked before finalizing the totals.
Distribution of primary research fieldwork respondents
| Company type | Respondent position | Region |
|---|---|---|
| Top tier: 38% | CXOs: 12% | APAC: 37% |
| Mid tier: 45% | Functional/Unit leaders: 28% | EMEA: 36% |
| Smaller Players: 17% | Managers: 60% | Americas: 27% |
Market-Sizing & Forecasting
Market sizing starts with a top-down build that reconstructs the available demand pool from installed base expansion, replacement cycles, and the share of providers that actively buy refurbished devices due to budget constraints. Once that total is shaped, it is cross-checked with selective bottom-up approximations using sampled average selling prices by modality and a sense-check on volumes through channel discussions, which helps adjust for overstatement in any single data stream.
The model is influenced by a few market fingerprints that show up repeatedly during validation, including typical discount-to-new ranges, modality mix shifts within diagnostic imaging, refurbishment yield after inspection and part replacement, warranty expectations by buyer type, and cross-border movement where trade activity is meaningful. For forecasting, scenario analysis is used so we can reflect different procurement tightening or easing outcomes, and then a simple regression check is applied against drivers such as healthcare capital spending direction and imaging utilization trends. Where bottom-up visibility is patchy, gaps are handled with conservative ranges that are narrowed only after multiple interview confirmations.
Data Validation & Update Cycle
Outputs are validated by comparing the final totals against independent signals such as procurement budgets, major modality shipment direction, and regional spending capacity, and then outliers are investigated before sign-off. When a variance is large, we re-check the device inclusion logic, pricing progression, and the timing of currency conversion assumptions, and we also re-contact sources when needed.
Reports refresh annually, and interim updates are made when material events occur, such as sharp currency movements, major regulatory changes, or large supply disruptions in a region. Before delivery, we do a final pass to ensure the model reflects the latest available public information and interview feedback.
Mordor Intelligence's Global Refurbished Medical Devices Market Market Sizing Compared With Other Published Estimates
Published market sizes for refurbished medical devices often differ because each publisher draws the market boundary differently and also uses different year anchors and pricing logic. In practice, the biggest shifts come from whether used equipment sold without a refurbishment protocol is counted, how warranty-backed units are treated, and how the mix of imaging versus smaller devices changes the average price.
Some estimates expand the scope by grouping refurbished, used, and like-new conditions together, which can pull in transactions that do not include standardized testing, recalibration, and certification steps. Others rely on a single growth curve from a broad pre-owned equipment total, which tends to smooth out regional differences in procurement behavior and the pace at which refurbished imaging systems are adopted.
Benchmark comparison
| Source | Market Size | Gaps in Research Methodology |
|---|---|---|
| Mordor Intelligence | USD 19.01 B (2025) | |
| Industry Publisher A | USD 13.27 B (2025) | The scope explicitly groups like-new, refurbished, and used conditions, and the lower 2025 value likely reflects a tighter pricing set and a different base-year anchoring, which can undercount warranty-backed refurbished imaging systems. |
| Industry Publisher B | USD 16.25 B (2025) | The definition centers on refurbished equipment but does not clearly state exclusions for as-is resale or rental turnover, so totals can shift depending on how those adjacent flows are handled and how modality-level ASPs are progressed. |
The spread across the three numbers is mainly explained by what qualifies as a refurbished sale and how average prices are progressed by device type and region, and this is why the model separates certified refurbishment from simple resale and keeps currency timing consistent, which is the approach applied by Mordor Intelligence.


Key Questions Answered in the Report
Why are healthcare providers increasingly open to refurbished medical equipment?
Tight operating margins and sustainability mandates are steering procurement teams toward assets that deliver comparable clinical performance to new devices yet free up capital for staffing and digital upgrades.
How do AI software upgrades influence demand for refurbished imaging systems?
Hospitals can retrofit older CT and MRI platforms with AI-driven image-analysis modules during refurbishment, gaining modern diagnostic features without replacing core hardware.
What competitive edge do OEM-certified refurbishers maintain over independent players?
Direct access to proprietary parts and the ability to extend factory-level warranties allow OEM programs to command price premiums and win contracts for mission-critical modalities.
Which facility types are accelerating market growth beyond traditional hospitals?
Ambulatory surgical centers and stand-alone diagnostic clinics are scaling rapidly and often choose refurbished equipment to meet expansion timelines and budget ceilings.
How are online auction platforms reshaping the secondary equipment landscape?
Digital marketplaces increase price transparency and global reach, enabling sellers in saturated regions to match with buyers in emerging markets, thereby shortening asset idle time.
What role do evolving regulations play in market adoption rates?
Clearer refurbishment guidelines in regions like the EU and Malaysia boost buyer confidence, while fragmented standards elsewhere still slow cross-border transactions.
Page last updated on:


