Market Overview
| Study Period | 2021 - 2031 |
|---|---|
| Forecast Data Period | 2026 - 2031 |
| Historical Data Period | 2021 - 2024 |
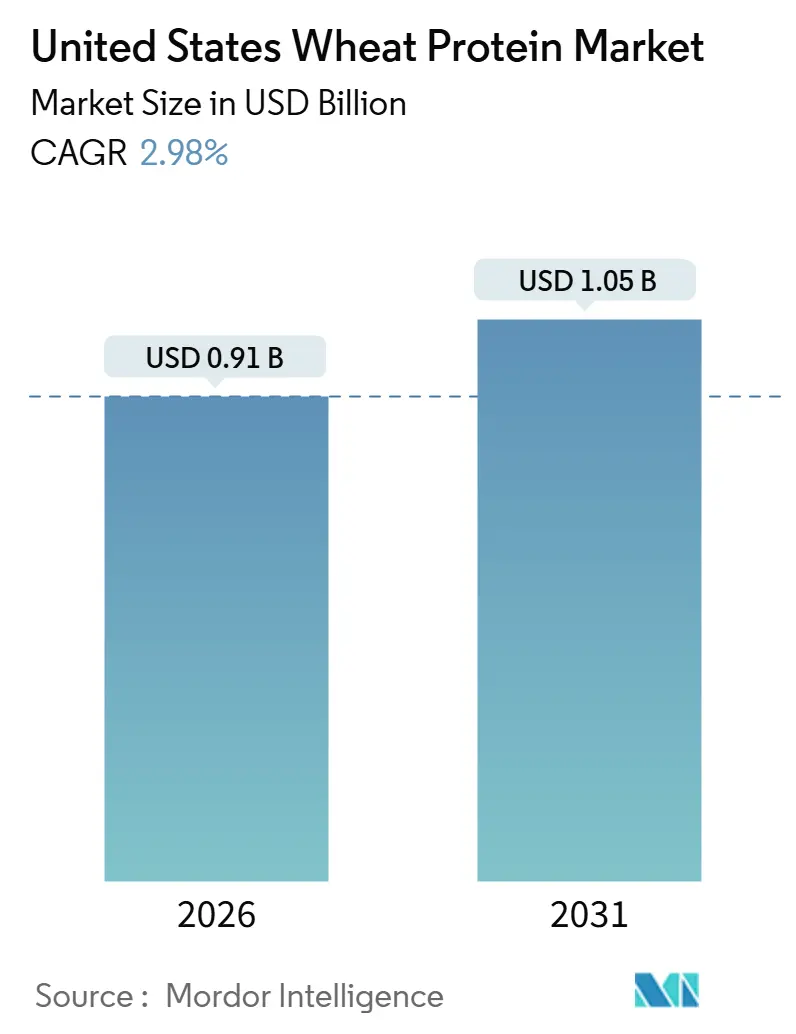
| Market Size (2026) | USD 0.91 Billion |
| Market Size (2031) | USD 1.05 Billion |
| Growth Rate (2026 - 2031) | 2.98% CAGR |
| Market Concentration | Medium |
Major Players
*Disclaimer: Major Players sorted in no particular order Image © Mordor Intelligence. Reuse requires attribution under CC BY 4.0. |
|
United States Wheat Protein Market Analysis by Mordor Intelligence
The United States wheat protein market size is estimated at USD 0.91 billion in 2026, and is projected to grow to USD 1.05 billion by 2031, registering a compound annual growth rate (CAGR) of 2.98% during the forecast period. The market growth is primarily driven by the increasing adoption of plant-based and flexitarian diets, which have boosted the demand for plant proteins that provide structure, texture, and protein density on a large scale. The rising consumption of sports and performance nutrition products is further driving the demand for plant-derived proteins that support protein fortification while ensuring processing stability. Moreover, consumer preferences for clean-label and sustainable products are enhancing the appeal of wheat protein, as its recognizability and compatibility with simplified ingredient statements align with expectations for transparency and natural ingredients.
Key Report Takeaways
- By type, concentrates held 46.33% of 2025 revenue, while textured and hydrolyzed formats are set to advance at a 4.21% CAGR to 2031.
- By nature, conventional formats captured 81.53% of 2025 revenue, whereas organic variants will grow at a 4.09% CAGR through 2031.
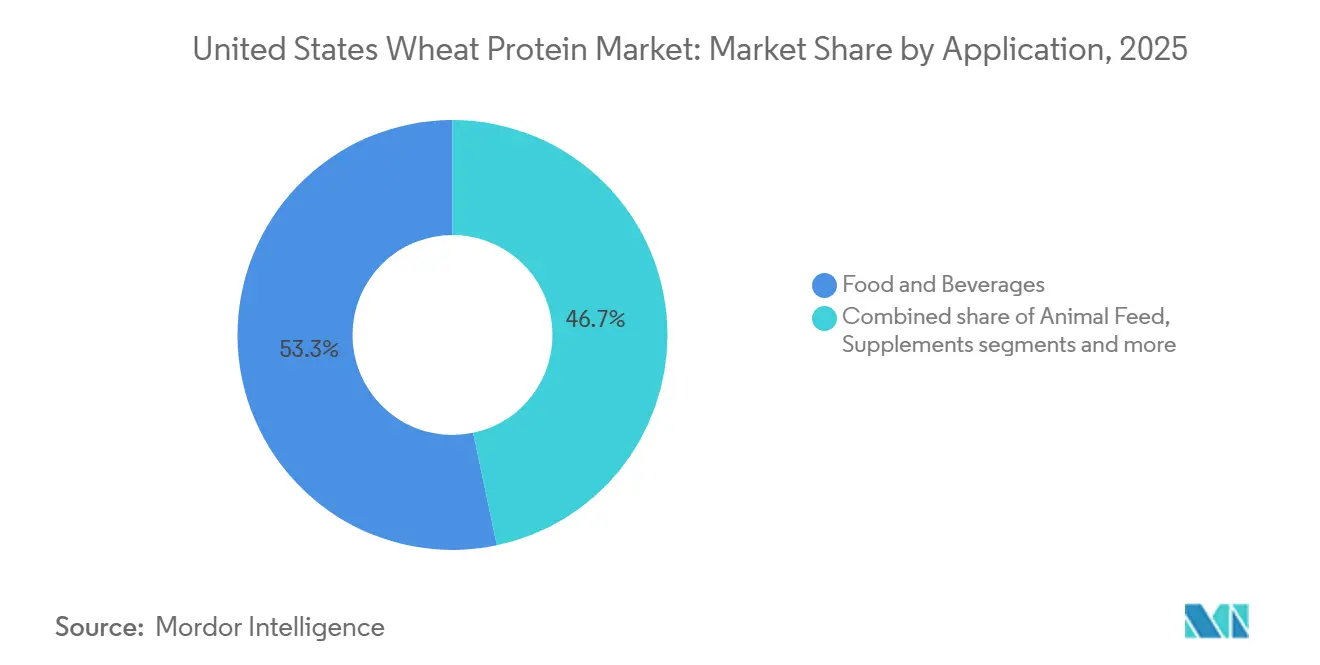
- By application, food and beverages accounted for 53.31% of the 2025 value; animal feed is forecast to expand at a 3.71% CAGR during 2026-2031.
Note: Market size and forecast figures in this report are generated using Mordor Intelligence’s proprietary estimation framework, updated with the latest available data and insights as of January 2026.
United States Wheat Protein Market Trends and Insights
Drivers Impact Analysis*
| Driver | (~) % Impact on CAGR Forecast | Geographic Relevance | Impact Timeline |
|---|---|---|---|
| Rising adoption of plant-based diets | +0.8% | National, with higher penetration in West Coast urban centers | Medium term (2-4 years) |
| Surge in sports and performance nutrition products | +0.6% | National, led by online and specialty retail channels | Short term (≤ 2 years) |
| Preference for clean-label and sustainable ingredients | +0.5% | National, strongest in natural and organic retail | Long term (≥ 4 years) |
| Advancements in processing technologies | +0.4% | National, concentrated in Midwest production hubs | Medium term (2-4 years) |
| Growing preference for Non-GMO ingredient declarations | +0.3% | National, premium channels and e-commerce | Short term (≤ 2 years) |
| Rising demand for plant-based proteins in meat alternatives | +0.7% | National, with early traction in foodservice and QSR | Medium term (2-4 years) |
| Source: Mordor Intelligence | |||
Rising adoption of plant-based diets
The growing adoption of plant-based diets, driven by shifting dietary preferences, is expanding the role of plant-derived proteins in mainstream food systems. Consumers are increasingly integrating plant-based options into their diets for reasons such as health benefits, sustainability, and dietary diversity. This trend is fueling demand for functional plant proteins that provide structure, texture, and nutritional value. Wheat protein, particularly in the form of gluten and textured derivatives, is well-positioned to meet this demand due to its established history of use, familiarity, and ability to mimic meat-like characteristics in plant-based formulations. Supporting this trend, data from the Good Food Institute (GFI) indicates that in 2024, 53% of Americans reported having consumed plant-based meat at least once, demonstrating the mainstream acceptance of plant-based eating [1]Source: Good Food Institute (GFI), "Plant-Based Meat in the United States", gfi.org. As this consumption pattern becomes more widespread, food manufacturers are scaling production and diversifying product offerings, further driving demand for reliable, high-performance plant proteins like wheat protein.
Surge in sports and performance nutrition products
The growing demand for sports and performance nutrition products is a significant driver for the United States wheat protein market. Consumers are increasingly focusing on protein intake to enhance muscle recovery, endurance, and overall physical performance. This trend is no longer confined to professional athletes but has expanded to include recreational fitness enthusiasts, gym-goers, and lifestyle consumers seeking convenient, protein-enriched options for their daily nutrition. This expanding consumer demographic is encouraging manufacturers to utilize plant-based protein sources that provide functional reliability, digestibility, and formulation flexibility. Wheat protein is particularly valued for its ability to enhance protein content while offering functional benefits such as binding, texture stability, and process tolerance, which are essential for performance-focused formulations.
Preference for clean-label and sustainable ingredients
The preference for clean-label and sustainable ingredients is a significant driver of the United States wheat protein market. Consumers are increasingly examining ingredient lists and favoring products that emphasize naturalness, transparency, and responsible sourcing. Clean-label demands are prompting food manufacturers to adopt minimally processed plant proteins that provide both functionality and nutritional benefits without relying on synthetic additives or complex chemical modifications. Wheat protein aligns with these preferences due to its recognizability, versatility, and suitability for simplified ingredient statements, allowing brands to achieve clean-label positioning while maintaining product performance at scale. This trend is evident in consumer behavior: according to the International Food Information Council (IFIC), in 2024, 36% of Americans preferred products labeled as natural, organic, or healthy, highlighting the growing impact of clean-label attributes on purchasing decisions [2]Source: International Food Information Council (IFIC), "2024 IFIC Food & Health SURVEY", ific.org.
Advancements in processing technologies
Advancements in processing technologies play a significant role in driving the United States wheat protein market, with high-moisture extrusion emerging as a key innovation. This advanced processing method enables wheat protein concentrates to be transformed into highly organized, fibrous structures that closely replicate the layered texture, bite, and tear of whole-cut meat. Consequently, wheat protein evolves from a traditional functional ingredient to a core structural protein system with enhanced versatility. High-moisture extrusion significantly improves protein alignment, moisture retention, and textural integrity, allowing manufacturers to achieve consistent, meat-like performance while ensuring formulation stability across various applications. Furthermore, this technology enhances process efficiency and scalability, enabling producers to maintain uniform quality at industrial volumes, reduce production costs, and minimize reliance on complex additive systems, thereby supporting sustainable manufacturing practices.
Restraints Impact Analysis*
| Restraint | (~) % Impact on CAGR Forecast | Geographic Relevance | Impact Timeline |
|---|---|---|---|
| Rising prevalence of gluten intolerance and celiac disease | -0.5% | National, with higher awareness in urban and coastal markets | Long term (≥ 4 years) |
| Intense competition from hypoallergenic plant proteins | -0.6% | National, led by pea and rice protein substitution | Medium term (2-4 years) |
| High production costs due to energy-intensive extraction | -0.3% | National, concentrated in Midwest production hubs | Short term (≤ 2 years) |
| Supply chain disruptions from wheat crop variability | -0.2% | National, with regional impacts in Great Plains wheat belt | Short term (≤ 2 years) |
| Source: Mordor Intelligence | |||
Rising prevalence of gluten intolerance and celiac disease
The rising prevalence of gluten intolerance and celiac disease serves as a significant restraint on the United States wheat protein market. Increased consumer awareness of gluten-related disorders has directly reduced the potential consumer base for wheat-derived proteins. Higher diagnosis rates of celiac disease and non-celiac gluten sensitivity have driven greater avoidance of gluten-containing ingredients, particularly in health-oriented and "free-from" product categories. This trend has compelled many manufacturers to reformulate their products, incorporating gluten-free alternatives such as pea, rice, or soy proteins to address dietary restrictions and allergen concerns. Additionally, the implementation of stringent gluten-free labeling regulations has amplified caution among brands, further discouraging the use of wheat protein even in product categories where gluten functionality could otherwise provide significant benefits. These factors collectively underscore the growing challenges faced by the wheat protein market in adapting to evolving consumer preferences and regulatory landscapes.
Intense competition from hypoallergenic plant proteins
Intense competition from hypoallergenic plant proteins poses a significant challenge to the United States wheat protein market, as food manufacturers increasingly diversify protein sources to address allergen sensitivity and dietary inclusivity. Proteins such as pea, rice, potato, and fava bean are widely regarded as more allergen-friendly alternatives, making them appealing for products marketed with gluten-free, free-from, and all-inclusive nutrition claims. This trend diminishes the appeal of wheat protein, which is inherently associated with gluten and therefore excluded from an expanding range of health-focused formulations. Furthermore, ongoing advancements in the taste, solubility, and texturization of hypoallergenic proteins have reduced the functional advantages previously held by wheat protein, enabling formulators to achieve similar structure and protein delivery without allergen-related constraints.
*Our forecasts treat driver/restraint impacts as directional, not additive. The impact forecasts reflect baseline growth, mix effects, and variable interactions.
Segment Analysis
By Type: Textured Formats Gain as Whole-Cut Analogs Scale
Wheat protein concentrates, which accounted for 46.33% of total market revenue in 2025, continue to drive the United States wheat protein market due to their optimal balance of functionality, protein density, and cost-effectiveness across various end-use applications. These concentrates typically offer high protein content, making them highly attractive to food manufacturers seeking significant protein enrichment without the formulation challenges or higher costs associated with isolates. Their strong water-binding, viscoelasticity, and emulsification properties enable broad usage in bakery products, meat extenders, plant-based meat analogues, and high-protein snacks. In these applications, they enhance texture, structure, and mouthfeel rather than serving solely as a nutritional additive.
Textured and hydrolyzed wheat proteins are expanding at a CAGR of 4.21% through 2031 by addressing evolving formulation priorities around performance, versatility, and value creation rather than merely adding protein. Textured wheat protein is gaining traction due to its ability to deliver structural complexity, density, and mechanical strength that closely replicate animal-protein behavior. This enables manufacturers to develop protein systems with improved bite, cohesion, and moisture stability while maintaining formulation flexibility. Its seamless integration with other plant proteins and fats supports more stable protein matrices and reduces reliance on synthetic binders or additives, aligning with cleaner-label formulation strategies.


By Nature: Organic Certification Drives Premium Positioning
Conventional wheat protein formats, which accounted for 81.53% of total market revenue in 2025, continue to dominate due to their reliable supply, consistent processing performance, and widespread acceptance among manufacturers in large-scale production systems. These proteins benefit from established wheat sourcing networks, standardized quality specifications, and high processing yields. This enables manufacturers to achieve consistent functional performance across batches while maintaining formulation stability at a commercial scale. Their broad availability supports uninterrupted production planning and facilitates long-term supplier contracts, which are essential for high-volume food manufacturers focused on operational efficiency and predictable outcomes.
Organic wheat protein, growing at a CAGR of 4.09% through 2031, is increasingly contributing to the growth of the United States wheat protein market. This trend is supported by strong upstream momentum in organic wheat production and sales. According to the Science Societies, organic wheat sales are nearly 80% higher than regular wheat production. Between 2023 and 2024, the United States sold 24.41 million bushels of organic wheat, reflecting sustained grower participation and market demand for organically produced grains [3]Source: Science Societies, "The surprising potential of organic wheat", sciencesocieties.org. This highlights a structural shift toward certified organic grain cultivation, signaling a more robust raw-material pipeline for organic protein derivatives. The improved availability, consistency, and long-term sourcing confidence for organic wheat directly support the expansion of organic wheat protein in the market.
By Application: Animal Feed Emerges as Volume Anchor Animal feed is expanding at 3.71% through 2031, the fastest rate a
Food and beverages, which accounted for 53.31% of total market revenue in 2025, remain the primary growth driver of the United States wheat protein market. This segment anchors demand in high-volume, repeat-use product categories, emphasizing wheat protein's role as a multifunctional ingredient rather than a niche protein source. The dominance of this segment is attributed to the widespread integration of wheat protein into everyday food systems, where manufacturers focus on texture enhancement, structural stability, and protein enrichment within familiar product formats. Wheat protein's inherent viscoelasticity, binding strength, and water-holding capacity contribute to improved product consistency and processing tolerance while simultaneously increasing protein content, making it highly appealing for scalable food production.
The animal feed segment is expanding at a CAGR of 3.71% through 2031, representing the fastest growth rate among application segments. This growth is driven by improved utilization efficiency and protein optimization across feed formulations. Wheat protein's favorable amino acid profile, digestibility, and binding characteristics enhance feed performance by improving pellet integrity and reducing nutrient loss during processing and storage. Its functional consistency supports stable formulation outcomes, enabling feed producers to standardize protein inclusion levels while maintaining processing efficiency. Additionally, wheat protein provides greater flexibility in protein sourcing strategies, allowing formulators to balance plant-based protein systems and reduce reliance on single-source inputs.
Geography Analysis
The United States wheat protein market is predominantly concentrated in the Midwest and Great Plains regions, which serve as the foundation of domestic wheat protein production. These areas benefit from direct access to hard red winter wheat supplies, ensuring steady raw material availability and reducing transportation distances. This proximity enables processors to maintain cost-efficient operations and consistent input quality. Additionally, the presence of well-established wet-milling and gluten-extraction infrastructure in these regions supports large-scale protein processing and facilitates just-in-time delivery models for downstream customers requiring reliable supply chains.
Within the primary production belt, Kansas, Nebraska, and Missouri account for the majority of the country's wheat gluten and wheat protein extraction capacity. These states leverage robust agricultural ecosystems, skilled labor pools, and strong connectivity to national freight networks. These factors collectively enable high-throughput processing and efficient outbound logistics. Their central location allows manufacturers to serve the bakery, pet food, and feed industries nationwide with shorter lead times, solidifying their role as strategic hubs for producing volume-driven and functionally oriented wheat protein formats.
In contrast, regions such as California, New York, and the Pacific Northwest are characterized as demand-driven growth areas rather than production centers. These regions feature dense concentrations of natural-channel retailers, specialty bakeries, and innovation-focused food startups, driving demand for organic and Non-GMO Project Verified wheat protein formats. Consumer preferences in these areas emphasize clean-label, certified, and sustainably sourced ingredients, fostering premium positioning and supporting higher-value wheat protein variants. While production remains concentrated in the central United States, coastal and West Coast markets play a pivotal role in influencing product innovation, certification adoption, and premium demand trends within the broader United States wheat protein market.
Competitive Landscape
The United States wheat protein market exhibits moderate concentration, driven by a combination of large, diversified ingredient multinationals and specialized wheat processors. Key players in the market include Cargill, Incorporated, MGP Ingredients, Inc., Roquette Frères SA, Tereos SCA, and Kerry Group plc. These companies leverage vertically integrated supply chains, robust wheat sourcing capabilities, and established customer relationships across food, feed, and specialty nutrition segments. This enables them to maintain a competitive edge while meeting the demand for both high-volume and value-added protein products.
Competition in the market is increasingly influenced by investments in production capacity and advancements in processing technologies, particularly in high-moisture extrusion and enzyme-assisted hydrolysis. Leading companies are expanding extrusion capacities to develop advanced wheat protein formats with improved structural integrity and performance, addressing the growing demand for next-generation protein systems. Simultaneously, investments in enzymatic hydrolysis enable the production of low-bitterness, neutral-flavor wheat protein derivatives with enhanced solubility and functional efficiency. These advancements broaden the application scope of wheat protein in formulation-sensitive products. Such processing capabilities create significant entry barriers, favoring established players with the necessary scale, technical expertise, and financial resources.
Certification-led competition is gaining prominence, with major companies seeking Non-GMO Project verification and clean-label compliance to cater to premium demand in natural and specialty product channels. Additionally, technology adoption is increasingly focused on twin-screw extrusion systems for precise texturization control and enzymatic processing platforms for functional customization. These technologies enable suppliers to develop tailored wheat protein solutions that meet evolving customer requirements, further strengthening their competitive positioning in the market.
United States Wheat Protein Industry Leaders
-
Cargill, Incorporated
-
MGP Ingredients, Inc.
-
Roquette Freres SA
-
Kerry Group plc
-
Tereos SCA
- *Disclaimer: Major Players sorted in no particular order

Recent Industry Developments
- October 2025: Arla Foods Ingredients has introduced a new concept, Easy Bite, a bite-sized protein snack. Developed with the customized whey protein solution Lacprodan EasyBar, it provides up to 40% high-quality protein in a convenient 18g serving.
- December 2024: Manildra Group USA celebrated its 50th anniversary, highlighting its expertise in the production and distribution of vital wheat gluten, wheat starches, and wheat proteins.


United States Wheat Protein Market Report Scope
Wheat protein is a plant-based protein primarily derived from wheat gluten. It is valued for its functional properties, including elasticity, viscosity, and water absorption, which make it suitable for applications in bakery products, meat analogues, and nutritional formulations.
The United States wheat protein market is segmented by type, nature, and application. By type, the market is segmented into Concentrates, isolates, and textured/hydrolysed. By nature, the market is segmented into organic and conventional. By application, the market is segmented into food and beverage, animal feed, personal care, cosmetics, and supplements. The food and beverage segment is further sub-segmented into bakery and snacks, breakfast cereals, meat, poultry, seafood, and meat alternatives, and RTE/RTC food products. Market sizing has been done in value terms in USD and in volume in tons for all the abovementioned segments.
By Type
| Concentrates |
| Isolates |
| Textured / Hydrolyzed |
By Nature
| Conventional |
| Organic |
By Application
| Food and Beverages | Bakery and Snacks |
| Breakfast Cereals | |
| Meat / Poultry / Seafood and Meat Alternatives | |
| RTE / RTC Food Products | |
| Condiments / Sauces | |
| Animal Feed | |
| Personal Care and Cosmetics | |
| Supplements |
| By Type | Concentrates | |
| Isolates | ||
| Textured / Hydrolyzed | ||
| By Nature | Conventional | |
| Organic | ||
| By Application | Food and Beverages | Bakery and Snacks |
| Breakfast Cereals | ||
| Meat / Poultry / Seafood and Meat Alternatives | ||
| RTE / RTC Food Products | ||
| Condiments / Sauces | ||
| Animal Feed | ||
| Personal Care and Cosmetics | ||
| Supplements | ||


Market Definition
- End User - The Protein Ingredients Market operates on a B2B basis. Food, Beverages, Supplements, Animal Feed, and Personal Care & Cosmetic manufacturers are considered to be end-consumers in the market studied. The scope excludes manufacturers buying liquid/dry whey to be used for application as a binding agent or thickener or other non-protein applications.
- Penetration Rate - Penetration Rate is defined as the percentage of Protein-Fortified End User Market Volume in the Overall End User Market Volume.
- Average Protein Content - Average protein content is the average protein content present per 100 g of product manufactured by all end-user companies considered under the scope of this report.
- End User Market Volume - End-user market volume is the consolidated volume of all types and forms of end-user products in the country or region.
| Keyword | Definition |
|---|---|
| Alpha-lactalbumin (α-Lactalbumin) | It is a protein that regulates the production of lactose in the milk of almost all mammalian species. |
| Amino acid | It is an organic compound that contains both amino and carboxylic acid functional groups, which are required for the synthesis of body protein and other important nitrogen-containing compounds, such as creatine, peptide hormones, and some neurotransmitters. |
| Blanching | It is the process of briefly heating vegetables with steam or boiling water. |
| BRC | British Retail Consortium |
| Bread improver | It is a flour-based blend of several components with specific functional properties designed to modify dough characteristics and give quality attributes to bread. |
| BSF | Black Soldier Fly |
| Caseinate | It is a substance produced by adding an alkali to acid casein, a derivative of casein. |
| Celiac disease | Celiac disease is an immune reaction to eating gluten, a protein found in wheat, barley, and rye. |
| Colostrum | It is a milky fluid that’s released by mammals that have recently given birth before breast milk production begins. |
| Concentrate | It is the least processed form of protein and has a protein content ranging from 40-90% by weight. |
| Dry protein basis | It refers to the percentage of "pure protein" present in a supplement after the water in it is completely removed through heat. |
| Dry whey | It is the product resulting from drying fresh whey which has been pasteurized and to which nothing has been added as a preservative. |
| Egg protein | It is a mixture of individual proteins, including ovalbumin, ovomucoid, ovoglobulin, conalbumin, vitellin, and vitellenin. |
| Emulsifier | It is a food additive that facilitates the blending of foods that are immiscible with one another, such as oil and water. |
| Enrichment | It is the process of addition of micronutrients that are lost during the processing of the product. |
| ERS | Economic Research Service of the USDA |
| Extrusion | It is the process of forcing soft mixed ingredients through an opening in a perforated plate or die designed to produce the required shape. The extruded food is then cut to a specific size by blades. |
| Fava | Also known as Faba, it is another word for yellow split beans. |
| FDA | Food and Drug Administration |
| Flaking | It is a process in which typically a cereal grain (like corn, wheat, or rice) is broken down into grits, cooked with flavors and syrups, and then pressed into flakes between cooled rollers. |
| Foaming agent | It is a food ingredient that makes it possible to form or maintain a uniform dispersion of a gaseous phase in a liquid or solid food. |
| Foodservice | It refers to the part of the food industry which includes businesses, institutions, and companies which prepare meals outside the home. It includes restaurants, school and hospital cafeterias, catering operations, and many other formats. |
| Fortification | It is the deliberate addition of micronutrients that are not found in them naturally or which are lost during processing, to improve a food product's nutritional value. |
| FSANZ | Food Standards Australia New Zealand |
| FSIS | Food Safety and Inspection Service |
| FSSAI | Food Safety and Standards Authority of India |
| Gelling agent | It is an ingredient that functions as a stabilizer and thickener to provide thickening without stiffness through the formation of gel. |
| GHG | Greenhouse Gas |
| Gluten | It is a family of proteins found in grains, including wheat, rye, spelt, and barley. |
| Hemp | It is a botanical class of Cannabis sativa cultivars grown specifically for industrial or medicinal use. |
| Hydrolysate | It is a form of protein manufactured by exposing the protein to enzymes that can partially break the bonds between the protein's amino acids and break down large, complicated proteins into smaller pieces. Its processing makes it easier and quicker to digest. |
| Hypoallergenic | It refers to a substance that causes fewer allergic reactions. |
| Isolate | It is the purest and most processed form of protein which has undergone separation to obtain a pure protein fraction. It typically contains ≥ 90% of protein by weight. |
| Keratin | It is a protein that helps form hair, nails, and the outer layer of skin. |
| Lactalbumin | It is the albumin contained in milk and obtained from whey. |
| Lactoferrin | It is an iron‑binding glycoprotein that is present in the milk of most mammals. |
| Lupin | It is the yellow legume seeds of the genus Lupinus. |
| Millenial | Also known as Generation Y or Gen Y, it refers to the people born from 1981 to 1996. |
| Monogastric | It refers to an animal with a single-compartmented stomach. Examples of monogastric include humans, poultry, pigs, horses, rabbits, dogs, and cats. Most monogastric are generally unable to digest much cellulose food materials such as grasses. |
| MPC | Milk protein concentrate |
| MPI | Milk protein isolate |
| MSPI | Methylated soy protein isolate |
| Mycoprotein | Mycoprotein is a form of single-cell protein, also known as fungal protein, derived from fungi for human consumption. |
| Nutricosmetics | It is a category of products and ingredients that act as nutritional supplements to care for skin, nails, and hair natural beauty. |
| Osteoporosis | It is a medical condition in which the bones become brittle and fragile from loss of tissue, typically as a result of hormonal changes, or deficiency of calcium or vitamin D. |
| PDCAAS | Protein digestibility-corrected amino acid score (PDCAAS) is a method of evaluating the quality of a protein based on both the amino acid requirements of humans and their ability to digest it. |
| Per-capita consumption of animal protein | It is the average amount of animal protein (such as milk, whey, gelatin, collagen, and egg proteins) that is readily available for consumption by each person in an actual population. |
| Per-capita consumption of plant protein | It is the average amount of plant protein (such as soy, wheat, pea, oat, and hemp proteins) that is readily available for consumption by each person in an actual population. |
| Quorn | It is a microbial protein manufactured using mycoprotein as an ingredient, in which the fungus culture is dried and mixed with egg albumen or potato protein, which acts as a binder, and then is adjusted in texture and pressed into various forms. |
| Ready-to-Cook (RTC) | It refers to food products that include all of the ingredients, where some preparation or cooking is required through a process that is given on the package. |
| Ready-to-Eat (RTE) | It refers to a food product prepared or cooked in advance, with no further cooking or preparation required before being eaten. |
| RTD | Ready-to-Drink |
| RTS | Ready-to-Serve |
| Saturated fat | It is a type of fat in which the fatty acid chains have all single bonds. It is generally considered unhealthy. |
| Sausage | It is a meat product made of finely chopped and seasoned meat, which may be fresh, smoked, or pickled and which is then usually stuffed into a casing. |
| Seitan | It is a plant-based meat substitute made out of wheat gluten. |
| Softgel | It is a gelatin-based capsule with a liquid fill. |
| SPC | Soy protein concentrate |
| SPI | Soy protein isolate |
| Spirulina | It is a biomass of cyanobacteria that can be consumed by humans and animals. |
| Stabilizer | It is an ingredient added to food products to help maintain or enhance their original texture, and physical and chemical characteristics. |
| Supplementation | It is the consumption or provision of concentrated sources of nutrients or other substances that are intended to supplement nutrients in the diet and is intended to correct nutritional deficiencies. |
| Texturant | It is a specific type of food ingredient that is used to control and alter the mouthfeel and texture of food and beverage products. |
| Thickener | It is an ingredient that is used to increase the viscosity of a liquid or dough and make it thicker, without substantially changing its other properties. |
| Trans fat | Also called trans-unsaturated fatty acids or trans fatty acids, it is a type of unsaturated fat that naturally occurs in small amounts in meat. |
| TSP | Textured soy protein |
| TVP | Textured vegetable protein |
| WPC | Whey protein concentrate |
| WPI | Whey protein isolate |


Research Methodology
Mordor Intelligence follows a four-step methodology in all our reports.
- Step-1: Identify Key Variables: The quantifiable key variables (industry and extraneous) pertaining to the specific product segment and country are selected from a group of relevant variables & factors based on desk research & literature review; along with primary expert inputs. These variables are further confirmed through regression modeling (wherever required).
- Step-2: Build a Market Model: In order to build a robust forecasting methodology, the variables and factors identified in Step-1 are tested against available historical market numbers. Through an iterative process, the variables required for market forecast are set and the model is built on the basis of these variables.
- Step-3: Validate and Finalize: In this important step, all market numbers, variables and analyst calls are validated through an extensive network of primary research experts from the market studied. The respondents are selected across levels and functions to generate a holistic picture of the market studied.
- Step-4: Research Outputs: Syndicated Reports, Custom Consulting Assignments, Databases & Subscription Platforms


