Market Overview
| Study Period | 2021 - 2031 |
|---|---|
| Forecast Data Period | 2026 - 2031 |
| Historical Data Period | 2021 - 2024 |
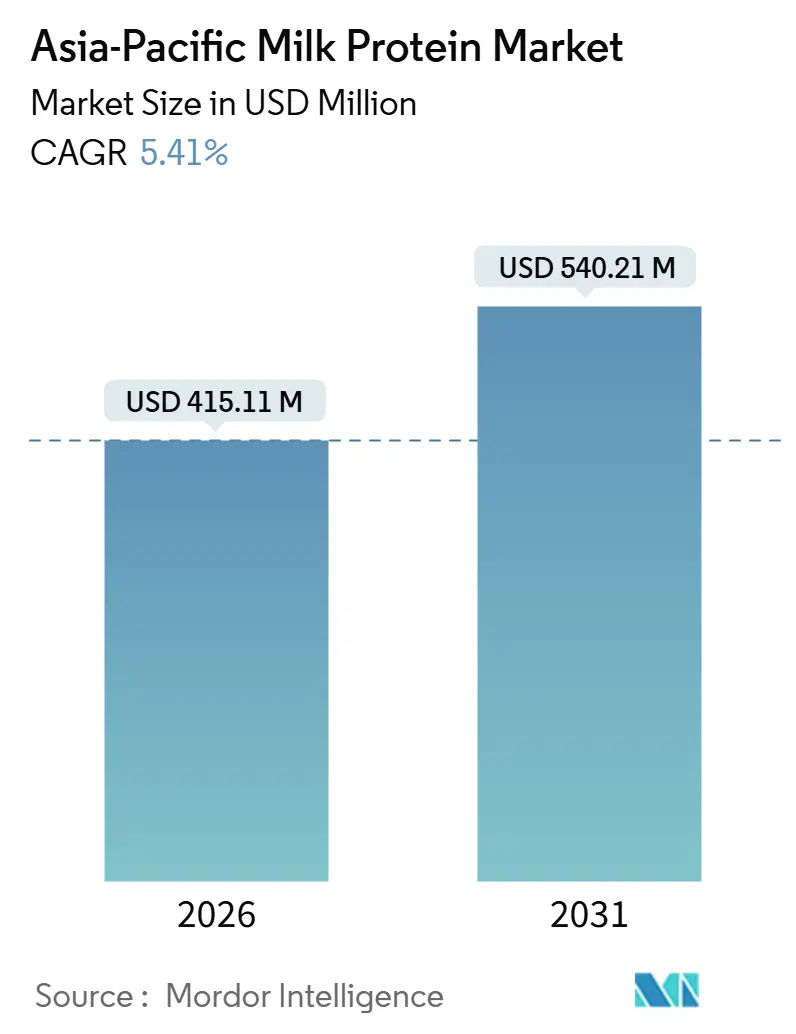
| Market Size (2026) | USD 415.11 Million |
| Market Size (2031) | USD 540.21 Million |
| Growth Rate (2026 - 2031) | 5.41% CAGR |
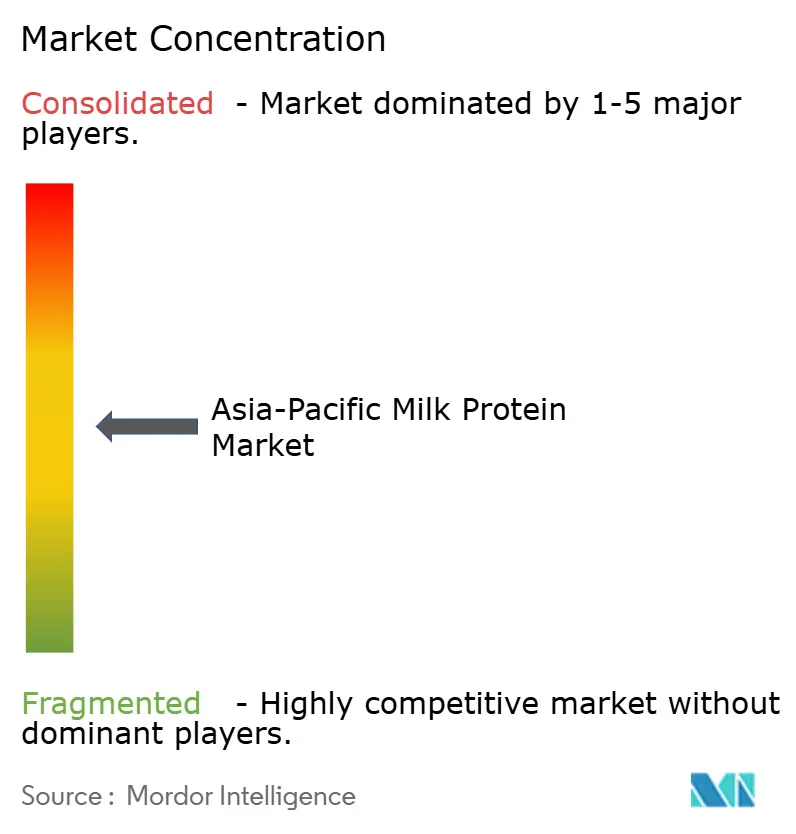
| Market Concentration | Medium |
Major Players*Disclaimer: Major Players sorted in no particular order Image © Mordor Intelligence. Reuse requires attribution under CC BY 4.0. |
|
Asia-Pacific Milk Protein Market Analysis by Mordor Intelligence
The Asia-Pacific milk protein market size reached USD 415.11 million in 2026 and is projected to attain USD 540.21 million by 2031, progressing at a 5.41% CAGR. Demand expansion is anchored in the continuing penetration of protein-fortified foods, the rapid scale-up of sports nutrition across South and Southeast Asia, and the emergence of personal-care uses that shelter suppliers from commodity cycles. China remained the largest revenue contributor in 2025, holding 36.72%, yet India is poised for faster growth through 2031 as government dairy programs close supply gaps and a young population boosts per-capita protein intake. Form-factor dynamics reveal a divide between concentrates, which keep costs low in bakery and beverage uses, and isolates that answer purity needs in infant formula, clinical nutrition, and premium sports powders. New charged-membrane and cold microfiltration lines reduce energy use and improve bioactive retention, sharpening the competitive edge of processors able to finance modern plants. Ingredient producers also face divergent demographic pressures: East Asia’s declining birth rates cool infant-formula volumes, while South Asia’s rising fitness culture accelerates demand for high-protein drinks and bars in urban centers.
Key Report Takeaways
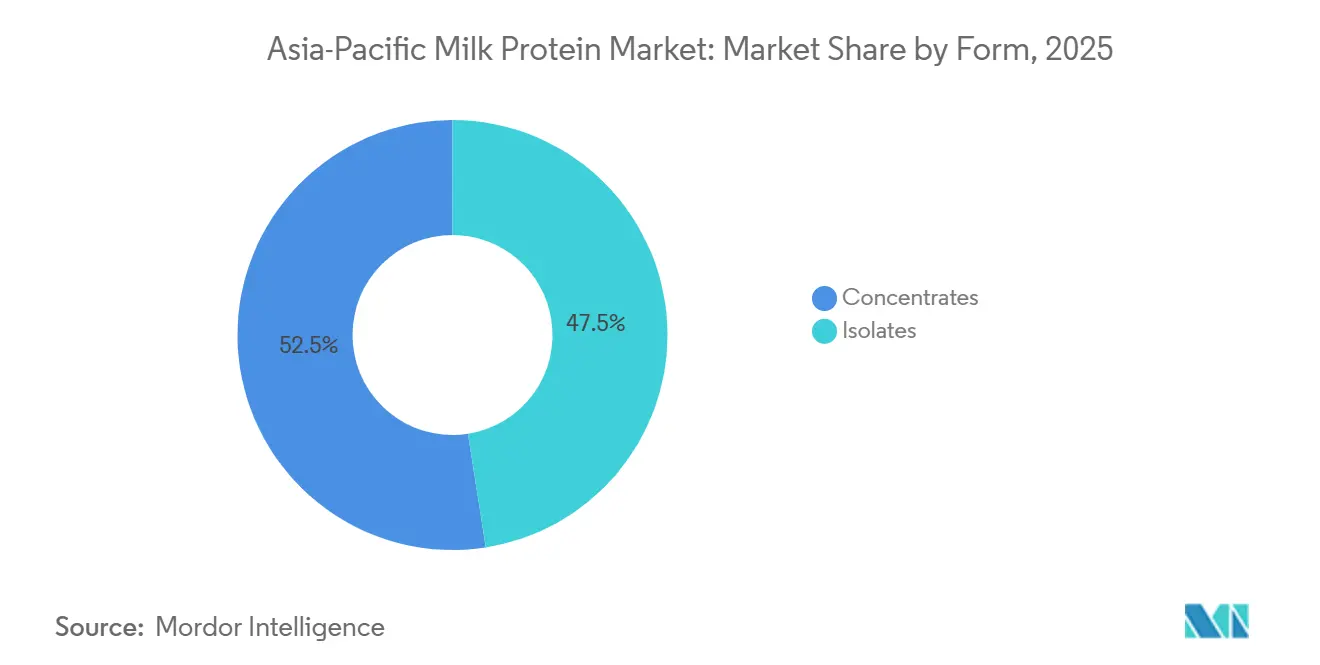
- By Form, Concentrates held 52.48% of the Asia-Pacific milk protein ingredients market share in 2025, while isolates advanced at a 6.81% CAGR through 2031.
- By End-User, Food and beverages accounted for an 81.25% share of the Asia-Pacific milk protein ingredients market size in 2025, whereas personal care and cosmetics are forecast to expand at a 7.02% CAGR to 2031.
- By Geography, China captured 36.72% revenue share in 2025; India is projected to register a 7.28% CAGR between 2026 and 2031 as dairy modernization programs lift raw-milk quality.
Note: Market size and forecast figures in this report are generated using Mordor Intelligence’s proprietary estimation framework, updated with the latest available data and insights as of January 2026.
Asia-Pacific Milk Protein Market Trends and Insights
Drivers Impact Analysis*
| Drivers | (~) % Impact on CAGR Forecasts | Geographic Relevance | Impact Timeline |
|---|---|---|---|
| Rising Health Consciousness Boosting Demand for Protein-Rich Foods and Supplements | +1.2% | India, Indonesia, Philippines, Vietnam; spillover to urban China and Thailand | Medium term (2-4 years) |
| Popularity of Functional Foods Like Protein Shakes and Fortified Yogurt | +0.9% | China, South Korea, Japan, Singapore; expanding to Malaysia and Thailand | Short term (≤ 2 years) |
| Demand for Infant Formula and Clinical Nutrition Products | +0.7% | China (clinical), India, Indonesia, Philippines (infant formula growth markets) | Long term (≥ 4 years) |
| Technological Advancements in Protein Extraction and Processing | +0.6% | Global, with early adoption in Australia, New Zealand, Japan, South Korea | Long term (≥ 4 years) |
| Government Initiatives Targeting Protein Deficiency and Dairy Promotion | +0.8% | India (NPDD, RGM, AHIDF), China (dairy stabilization), national programs across ASEAN | Medium term (2-4 years) |
| Rising Preference for High-Protein Diets and Sports Nutrition | +1.1% | India, China, South Korea, Thailand, Vietnam; urban centers across APAC | Short term (≤ 2 years) |
| Source: Mordor Intelligence | |||


Rising Health Consciousness Boosting Demand for Protein-Rich Foods and Supplements
Protein awareness has shifted from athletic subcultures to mainstream consumer consciousness across Asia-Pacific, driven by rising incomes, urbanization, and exposure to Western dietary patterns. India's sports nutrition market is expanding at approximately 9.5% annually, with whey protein concentrates and isolates capturing the majority of supplement formulations due to their superior amino acid profiles and digestibility. This demand extends beyond gym-goers to office workers seeking convenient nutrition and aging populations prioritizing muscle maintenance. The trend creates sustained pull for milk protein ingredients across retail supplements, functional beverages, and fortified snacks, particularly in markets where traditional diets have been plant-centric and protein intake historically lower than recommended levels.
Popularity of Functional Foods Like Protein Shakes and Fortified Yogurt
Functional foods commanded a USD143.4 billion market across Asia-Pacific in 2025, with protein claims emerging as the leading health attribute on product labels, according to the OECD-FAO Agricultural Outlook[1]Source: “OECD-FAO Agricultural Outlook 2024-2033,” OECD-FAO, oecd.org. Dairy-based beverages, protein shakes, fortified yogurts, and high-protein milk drinks represent the fastest-growing category within this segment, as manufacturers leverage milk proteins' clean-label appeal and familiar taste profiles. South Korea and Japan lead in per-capita consumption of functional dairy, while China's urban centers drive absolute volume growth. The convergence of convenience, taste, and perceived health benefits positions protein-fortified dairy as a gateway for ingredient suppliers to access premium price points without the regulatory hurdles associated with pharmaceutical-grade supplements.
Demand for Infant Formula and Clinical Nutrition Products
Between 2024 and 2029, China's infant formula market is anticipated to decline by approximately USD 4.8 billion, largely due to falling birth rates. Conversely, markets in India, Indonesia, and the Philippines are expected to experience significant double-digit growth, driven by the rapid expansion of the middle class, increasing disposable incomes, and rising maternal employment rates. This pronounced geographic divergence is pushing ingredient suppliers to reevaluate their production strategies, optimize supply chains, and ensure compliance with diverse regulatory requirements to effectively address these shifting market dynamics. In parallel, aging populations in countries like Japan and South Korea are driving growth in the clinical nutrition segment. This category includes enteral feeds, medical foods tailored for conditions such as sarcopenia, and specialized formulas for post-surgical recovery. These products are increasingly in demand as healthcare systems and consumers prioritize nutritional solutions for aging-related health challenges. Whey protein isolates, valued for their exceptional purity and hypoallergenic characteristics, dominate these applications. Their consistent demand provides a reliable foundation for the clinical nutrition market, even as birth rates fluctuate and reshape the infant formula landscape globally.
Technological Advancements in Protein Extraction and Processing
Producers have now adopted advanced membrane filtration technologies—ultrafiltration, microfiltration, and nanofiltration—that allow for the selective fractionation of milk into specific protein streams while significantly reducing thermal degradation. Charged-membrane systems, which utilize electrostatic forces to enhance selectivity, enable the commercial-scale isolation of β-casein and lactoferrin without relying on the chemical inputs required by conventional ion-exchange resins. Additionally, cold microfiltration, which operates at temperatures below 10°C, effectively preserves heat-sensitive bioactive peptides and immunoglobulins. This preservation unlocks new opportunities for their application in sports recovery products and immune-support supplements, meeting the growing demand for functional and health-focused ingredients. These technological advancements also deliver a 15-20% reduction in energy consumption per kilogram of protein compared to traditional spray-drying methods. This improvement not only enhances cost efficiency but also strengthens sustainability credentials, aligning with the values of environmentally conscious brands and consumers.
Restraint Impact Analysis*
| Restraints | (~) % Impact on CAGR Forecasts | Geographic Relevance | Impact Timeline |
|---|---|---|---|
| Stringent Food Safety, Labeling, and Regulatory Standards | -0.5% | China (GB standards), India (FSSAI), Japan (MHLW), ASEAN harmonization zones | Medium term (2-4 years) |
| Lactose Intolerance and Dairy Allergies in Populations | -0.7% | East Asia (90% prevalence), South Asia (70%), Southeast Asia (60%) | Long term (≥ 4 years) |
| Competition from Plant-Based Protein Alternatives | -0.9% | China, India, Thailand, Singapore; urban centers with vegan/flexitarian trends | Short term (≤ 2 years) |
| Consumer Worries Over Additives, Preservatives, and Artificial Ingredients | -0.4% | Japan, South Korea, Australia, Singapore; spreading to China and India | Medium term (2-4 years) |
| Source: Mordor Intelligence | |||
Stringent Food Safety, Labeling, and Regulatory Standards
Regulatory fragmentation across the Asia-Pacific imposes significant compliance costs on ingredient suppliers operating in multiple jurisdictions. China's GB standards mandate specific protein content thresholds and microbial limits for dairy ingredients, while India's Food Safety and Standards Authority (FSSAI) enforces distinct labeling requirements and additive approvals[2]Source: Food Safety and Standards Authority of India, "Labeling and Additives Requirements", fssai.gov.in. Japan's Ministry of Health, Labour and Welfare (MHLW) maintains stringent import protocols, including facility audits and batch testing, that can delay market entry by 6-12 months. ASEAN's efforts to harmonize food regulations remain incomplete, forcing manufacturers to navigate country-specific rules in Indonesia, Thailand, Vietnam, and Malaysia. These compliance burdens favor larger players with dedicated regulatory teams and create barriers for smaller processors seeking regional scale.
Lactose Intolerance and Dairy Allergies in Populations
According to the National Institutes of Health, approximately 90% of East Asians, 70% of South Asians, and 60% of Southeast Asians experience lactose intolerance due to the high prevalence of lactase non-persistence (LNP) genetic variants. This physiological condition significantly reduces the demand for lactose-containing dairy products, prompting a shift in consumer preferences toward lactose-free alternatives and plant-based protein options. Whey protein isolates, which undergo additional processing to lower lactose content to less than 1%, offer a partial solution to this issue. However, their higher cost limits their accessibility and adoption in the mass market. Additionally, dairy allergies, though less common than lactose intolerance, affect an estimated 2-3% of infants and young children. These allergies necessitate the use of specialized hypoallergenic formulas made from extensively hydrolyzed proteins or amino acids. Together, these biological factors impose a structural limitation on the adoption of milk protein ingredients, presenting a challenge that cannot be fully addressed through technological advancements alone.
*Our forecasts treat driver/restraint impacts as directional, not additive. The impact forecasts reflect baseline growth, mix effects, and variable interactions.
Segment Analysis
By Form–Concentrates Retain Volume, Isolates Capture Premium Margins
In 2025, concentrates accounted for 52.48% of the Asia-Pacific milk protein ingredients market, as bakers and beverage companies balanced functionality with cost considerations. For example, water-binding enhances the texture of bread and cookies, while emulsification ensures the stability of ready-to-drink (RTD) coffees. With protein levels ranging from 35-80%, companies can meet nutrition claims without exceeding budget constraints. Regional processors in Indonesia and Thailand prefer concentrates sourced from Oceania to fortify sweetened condensed milk, maintaining affordability for lower-income consumers.
Isolates, growing at a 6.81% CAGR, are projected to continue outpacing the Asia-Pacific milk protein ingredients market through 2031. With purity levels above 90% and negligible lactose content, isolates meet the stringent requirements of infant formulas and clinical nutrition. Additionally, elite sports powders in South Korea and Japan are driving demand. The use of cold microfiltration preserves bioactive peptides, making these products appealing to brands focused on recovery and immune support. This additional 1.4 percentage-point CAGR advantage underscores a market shift toward high-margin specialization, even as concentrates continue to dominate bulk tonnage.


By End User–Personal Care Achieves Frontier Growth
In 2025, food and beverages contributed a significant 81.25% of revenues, with milk proteins incorporated into yogurt, ready-to-drink shakes, protein coffee, and various bakery snacks. Reformulations now replace part of the wheat flour with protein concentrates, increasing protein content to 7–10 grams per serving without affecting texture. In Singapore, beverage innovators combine these concentrates with oat milk, blending dairy nutrition with a plant-based appeal. Meanwhile, the supplement sector, which includes infant nutrition, sports powders, and medical foods, relies on isolates to comply with regulatory requirements.
Although personal care and cosmetics represent a smaller segment, they are set to grow at a strong 7.02% CAGR through 2031, surpassing the overall growth of the Asia-Pacific milk protein ingredients industry. Lactoferrin is being used in antimicrobial creams, while milk-derived growth factors are incorporated into anti-aging serums aimed at boosting collagen synthesis. Prestige brands from Japan and Korea are launching sheet masks infused with hydrolyzed casein, priced three times higher than conventional options. This diversification not only protects ingredient suppliers from dairy commodity fluctuations but also supports higher gross margins.

Geography Analysis
China's 36.72% market share in 2025 reflects decades of dairy infrastructure investment and urbanization-driven consumption growth, yet India's 7.28% forecast CAGR through 2031 signals a structural shift. India's sports nutrition market is expanding at approximately 9.5% annually, propelled by a median age of 28 years and rising disposable incomes among millennials and Gen Z cohorts. Government initiatives, National Programme for Dairy Development (INR 2,790 crore), Rashtriya Gokul Mission (INR 3,400 crore), and Animal Husbandry Infrastructure Development Fund (INR 29,610 crore), modernize milk procurement and processing, reducing supply-chain losses and improving ingredient quality, according to the Government of India[3]Source: Department of Animal Husbandry & Dairying, “National Programme for Dairy Development,” Government of India, dahd.nic.in.
China's infant formula market contracted by an estimated USD 4.8 billion between 2024 and 2029 due to declining birth rates, forcing suppliers to pivot toward clinical nutrition and functional foods for aging consumers. Japan and South Korea, though smaller in absolute market size, lead in per-capita consumption of high-value protein ingredients, driven by aging demographics and established sports nutrition cultures. Australia and New Zealand function as export-oriented production hubs, leveraging pasture-based dairy systems and stringent quality controls to supply ingredient-grade proteins to the broader Asia-Pacific region.
Southeast Asian markets, Indonesia, Thailand, Vietnam, Malaysia, exhibit the fastest urbanization rates and rising middle-class populations, creating greenfield opportunities for functional food penetration. Indonesia's growing infant formula demand, driven by maternal employment and nuclear family structures, contrasts with Thailand's mature sports nutrition market, illustrating the diversity of growth drivers across the region. Regulatory harmonization under ASEAN frameworks remains incomplete, requiring suppliers to navigate country-specific food safety standards and labeling requirements that favor regional specialists over global generalists.
Competitive Landscape
Asia-Pacific milk protein ingredients market competition registers moderate concentration at 5 on a 10-point scale. Global cooperatives such as Fonterra, FrieslandCampina, and Arla leverage scale in milk pools and drying assets to supply multi-country clients. Fonterra finalized a NZD 1 billion investment wave in China in 2025 to install two innovation centers and extend WPC capacity, locking in proximity to key customers. FrieslandCampina formed a joint venture with a Chinese dairy to produce 15,000 t of concentrates for domestic bakers, demonstrating local partnership as a route to regulatory ease.
Regional players like Morinaga and Westland exploit niche strengths: Morinaga expanded lactoferrin output by 40% through fermentation, targeting cosmetics, while Westland pushes grass-fed whey isolates at a sustainability premium. Technology adoption drives differentiation. Plants retrofitted with charged-membrane and cold-process lines gain energy savings and satisfy clean-label criteria. Regulatory mastery, especially of China’s GB and India’s FSSAI frameworks, becomes a barrier that entrenches incumbents.
Smaller innovators are establishing their presence by tailoring amino-acid profiles and developing unique flavor variants that align with local consumer preferences. In India, contract manufacturers are actively collaborating with sports-nutrition startups to create isolates infused with Ayurvedic-inspired flavors, catering to the growing demand for traditional and functional ingredients. Similarly, Thai companies are enhancing their ready-to-drink (RTD) shakes by incorporating locally popular flavors such as matcha and durian, appealing to regional tastes. This strategic diversification not only addresses consumer preferences but also helps maintain a balanced competitive landscape. By avoiding aggressive price wars and destructive discounting, the market remains sustainable, even as production capacities continue to expand.
Asia-Pacific Milk Protein Industry Leaders
-
Arla Foods amba
-
Fonterra Co-operative Group Limited
-
Glanbia PLC
-
Kerry Group PLC
-
Koninklijke FrieslandCampina N.V.
- *Disclaimer: Major Players sorted in no particular order

Recent Industry Developments
- September 2025: FrieslandCampina Ingredients, a global leader in proteins and prebiotics, has launched a new state-of-the-art application centre in Singapore, expanding local R&D space by 30% with support from the Singapore Economic Development Board (EDB).
- May 2025: Arla Foods Ingredients and Alchemy Agencies established a distribution partnership to serve the animal proteins for the performance nutrition market in Australia, New Zealand, and the Pacific Islands. The agreement focuses on the Australia and New Zealand (ANZ) markets.
- September 2024: Arla Foods Ingredients has introduced the "Go High in Protein" campaign to help dairy manufacturers develop innovative high-protein products using its patented Nutrilac ProteinBoost range of microparticulated whey proteins, rich in essential amino acids.


Asia-Pacific Milk Protein Market Report Scope
Milk protein is the natural protein found in milk, primarily composed of casein (about 80%) and whey (about 20%), offering all essential amino acids for muscle growth, repair, and overall health.
Asia-Pacific milk protein is segmented by form into concentrates and isolates. By end-user, the market is segmented into animal feed, food and beverages, personal care and cosmetics, and supplements. Food and beverages are further segmented into bakery, beverages, breakfast cereals, condiments/sauces, dairy and dairy-alternatives, RTE/RTC foods, and snacks. Supplements are further segmented into baby food and infant formula, elderly and medical nutrition, and sports/performance nutrition. The market is segmented by geography into Australia, China, India, Indonesia, Japan, Malaysia, New Zealand, South Korea, Thailand, Vietnam, and the rest of Asia-Pacific. The market sizing has been done in value terms in USD for all the abovementioned segments.
Form
| Concentrates |
| Isolates |
End User
| Animal Feed | |
| Food and Beverages | Bakery |
| Beverages | |
| Breakfast Cereals | |
| Condiments / Sauces | |
| Confectionery | |
| Dairy and Dairy-Alternative Products | |
| RTE / RTC Foods | |
| Snacks | |
| Personal Care and Cosmetics | |
| Supplements | Baby Food and Infant Formula |
| Elderly and Medical Nutrition | |
| Sport / Performance Nutrition |
Geography
| Australia |
| China |
| India |
| Indonesia |
| Japan |
| Malaysia |
| New Zealand |
| South Korea |
| Thailand |
| Vietnam |
| Rest of Asia-Pacific |
| Form | Concentrates | |
| Isolates | ||
| End User | Animal Feed | |
| Food and Beverages | Bakery | |
| Beverages | ||
| Breakfast Cereals | ||
| Condiments / Sauces | ||
| Confectionery | ||
| Dairy and Dairy-Alternative Products | ||
| RTE / RTC Foods | ||
| Snacks | ||
| Personal Care and Cosmetics | ||
| Supplements | Baby Food and Infant Formula | |
| Elderly and Medical Nutrition | ||
| Sport / Performance Nutrition | ||
| Geography | Australia | |
| China | ||
| India | ||
| Indonesia | ||
| Japan | ||
| Malaysia | ||
| New Zealand | ||
| South Korea | ||
| Thailand | ||
| Vietnam | ||
| Rest of Asia-Pacific | ||


Market Definition
- End User - The Protein Ingredients Market operates on a B2B basis. Food, Beverages, Supplements, Animal Feed, and Personal Care & Cosmetic manufacturers are considered to be end-consumers in the market studied. The scope excludes manufacturers buying liquid/dry whey to be used for application as a binding agent or thickener or other non-protein applications.
- Penetration Rate - Penetration Rate is defined as the percentage of Protein-Fortified End User Market Volume in the Overall End User Market Volume.
- Average Protein Content - Average protein content is the average protein content present per 100 g of product manufactured by all end-user companies considered under the scope of this report.
- End User Market Volume - End-user market volume is the consolidated volume of all types and forms of end-user products in the country or region.
| Keyword | Definition |
|---|---|
| Alpha-lactalbumin (α-Lactalbumin) | It is a protein that regulates the production of lactose in the milk of almost all mammalian species. |
| Amino acid | It is an organic compound that contains both amino and carboxylic acid functional groups, which are required for the synthesis of body protein and other important nitrogen-containing compounds, such as creatine, peptide hormones, and some neurotransmitters. |
| Blanching | It is the process of briefly heating vegetables with steam or boiling water. |
| BRC | British Retail Consortium |
| Bread improver | It is a flour-based blend of several components with specific functional properties designed to modify dough characteristics and give quality attributes to bread. |
| BSF | Black Soldier Fly |
| Caseinate | It is a substance produced by adding an alkali to acid casein, a derivative of casein. |
| Celiac disease | Celiac disease is an immune reaction to eating gluten, a protein found in wheat, barley, and rye. |
| Colostrum | It is a milky fluid that’s released by mammals that have recently given birth before breast milk production begins. |
| Concentrate | It is the least processed form of protein and has a protein content ranging from 40-90% by weight. |
| Dry protein basis | It refers to the percentage of "pure protein" present in a supplement after the water in it is completely removed through heat. |
| Dry whey | It is the product resulting from drying fresh whey which has been pasteurized and to which nothing has been added as a preservative. |
| Egg protein | It is a mixture of individual proteins, including ovalbumin, ovomucoid, ovoglobulin, conalbumin, vitellin, and vitellenin. |
| Emulsifier | It is a food additive that facilitates the blending of foods that are immiscible with one another, such as oil and water. |
| Enrichment | It is the process of addition of micronutrients that are lost during the processing of the product. |
| ERS | Economic Research Service of the USDA |
| Extrusion | It is the process of forcing soft mixed ingredients through an opening in a perforated plate or die designed to produce the required shape. The extruded food is then cut to a specific size by blades. |
| Fava | Also known as Faba, it is another word for yellow split beans. |
| FDA | Food and Drug Administration |
| Flaking | It is a process in which typically a cereal grain (like corn, wheat, or rice) is broken down into grits, cooked with flavors and syrups, and then pressed into flakes between cooled rollers. |
| Foaming agent | It is a food ingredient that makes it possible to form or maintain a uniform dispersion of a gaseous phase in a liquid or solid food. |
| Foodservice | It refers to the part of the food industry which includes businesses, institutions, and companies which prepare meals outside the home. It includes restaurants, school and hospital cafeterias, catering operations, and many other formats. |
| Fortification | It is the deliberate addition of micronutrients that are not found in them naturally or which are lost during processing, to improve a food product's nutritional value. |
| FSANZ | Food Standards Australia New Zealand |
| FSIS | Food Safety and Inspection Service |
| FSSAI | Food Safety and Standards Authority of India |
| Gelling agent | It is an ingredient that functions as a stabilizer and thickener to provide thickening without stiffness through the formation of gel. |
| GHG | Greenhouse Gas |
| Gluten | It is a family of proteins found in grains, including wheat, rye, spelt, and barley. |
| Hemp | It is a botanical class of Cannabis sativa cultivars grown specifically for industrial or medicinal use. |
| Hydrolysate | It is a form of protein manufactured by exposing the protein to enzymes that can partially break the bonds between the protein's amino acids and break down large, complicated proteins into smaller pieces. Its processing makes it easier and quicker to digest. |
| Hypoallergenic | It refers to a substance that causes fewer allergic reactions. |
| Isolate | It is the purest and most processed form of protein which has undergone separation to obtain a pure protein fraction. It typically contains ≥ 90% of protein by weight. |
| Keratin | It is a protein that helps form hair, nails, and the outer layer of skin. |
| Lactalbumin | It is the albumin contained in milk and obtained from whey. |
| Lactoferrin | It is an iron‑binding glycoprotein that is present in the milk of most mammals. |
| Lupin | It is the yellow legume seeds of the genus Lupinus. |
| Millenial | Also known as Generation Y or Gen Y, it refers to the people born from 1981 to 1996. |
| Monogastric | It refers to an animal with a single-compartmented stomach. Examples of monogastric include humans, poultry, pigs, horses, rabbits, dogs, and cats. Most monogastric are generally unable to digest much cellulose food materials such as grasses. |
| MPC | Milk protein concentrate |
| MPI | Milk protein isolate |
| MSPI | Methylated soy protein isolate |
| Mycoprotein | Mycoprotein is a form of single-cell protein, also known as fungal protein, derived from fungi for human consumption. |
| Nutricosmetics | It is a category of products and ingredients that act as nutritional supplements to care for skin, nails, and hair natural beauty. |
| Osteoporosis | It is a medical condition in which the bones become brittle and fragile from loss of tissue, typically as a result of hormonal changes, or deficiency of calcium or vitamin D. |
| PDCAAS | Protein digestibility-corrected amino acid score (PDCAAS) is a method of evaluating the quality of a protein based on both the amino acid requirements of humans and their ability to digest it. |
| Per-capita consumption of animal protein | It is the average amount of animal protein (such as milk, whey, gelatin, collagen, and egg proteins) that is readily available for consumption by each person in an actual population. |
| Per-capita consumption of plant protein | It is the average amount of plant protein (such as soy, wheat, pea, oat, and hemp proteins) that is readily available for consumption by each person in an actual population. |
| Quorn | It is a microbial protein manufactured using mycoprotein as an ingredient, in which the fungus culture is dried and mixed with egg albumen or potato protein, which acts as a binder, and then is adjusted in texture and pressed into various forms. |
| Ready-to-Cook (RTC) | It refers to food products that include all of the ingredients, where some preparation or cooking is required through a process that is given on the package. |
| Ready-to-Eat (RTE) | It refers to a food product prepared or cooked in advance, with no further cooking or preparation required before being eaten. |
| RTD | Ready-to-Drink |
| RTS | Ready-to-Serve |
| Saturated fat | It is a type of fat in which the fatty acid chains have all single bonds. It is generally considered unhealthy. |
| Sausage | It is a meat product made of finely chopped and seasoned meat, which may be fresh, smoked, or pickled and which is then usually stuffed into a casing. |
| Seitan | It is a plant-based meat substitute made out of wheat gluten. |
| Softgel | It is a gelatin-based capsule with a liquid fill. |
| SPC | Soy protein concentrate |
| SPI | Soy protein isolate |
| Spirulina | It is a biomass of cyanobacteria that can be consumed by humans and animals. |
| Stabilizer | It is an ingredient added to food products to help maintain or enhance their original texture, and physical and chemical characteristics. |
| Supplementation | It is the consumption or provision of concentrated sources of nutrients or other substances that are intended to supplement nutrients in the diet and is intended to correct nutritional deficiencies. |
| Texturant | It is a specific type of food ingredient that is used to control and alter the mouthfeel and texture of food and beverage products. |
| Thickener | It is an ingredient that is used to increase the viscosity of a liquid or dough and make it thicker, without substantially changing its other properties. |
| Trans fat | Also called trans-unsaturated fatty acids or trans fatty acids, it is a type of unsaturated fat that naturally occurs in small amounts in meat. |
| TSP | Textured soy protein |
| TVP | Textured vegetable protein |
| WPC | Whey protein concentrate |
| WPI | Whey protein isolate |


Research Methodology
Mordor Intelligence follows a four-step methodology in all our reports.
- Step-1: Identify Key Variables: The quantifiable key variables (industry and extraneous) pertaining to the specific product segment and country are selected from a group of relevant variables & factors based on desk research & literature review; along with primary expert inputs. These variables are further confirmed through regression modeling (wherever required).
- Step-2: Build a Market Model: In order to build a robust forecasting methodology, the variables and factors identified in Step-1 are tested against available historical market numbers. Through an iterative process, the variables required for market forecast are set and the model is built on the basis of these variables.
- Step-3: Validate and Finalize: In this important step, all market numbers, variables and analyst calls are validated through an extensive network of primary research experts from the market studied. The respondents are selected across levels and functions to generate a holistic picture of the market studied.
- Step-4: Research Outputs: Syndicated Reports, Custom Consulting Assignments, Databases & Subscription Platforms


