Payroll Services Market Size and Share
Market Overview
| Study Period | 2020 - 2031 |
|---|---|
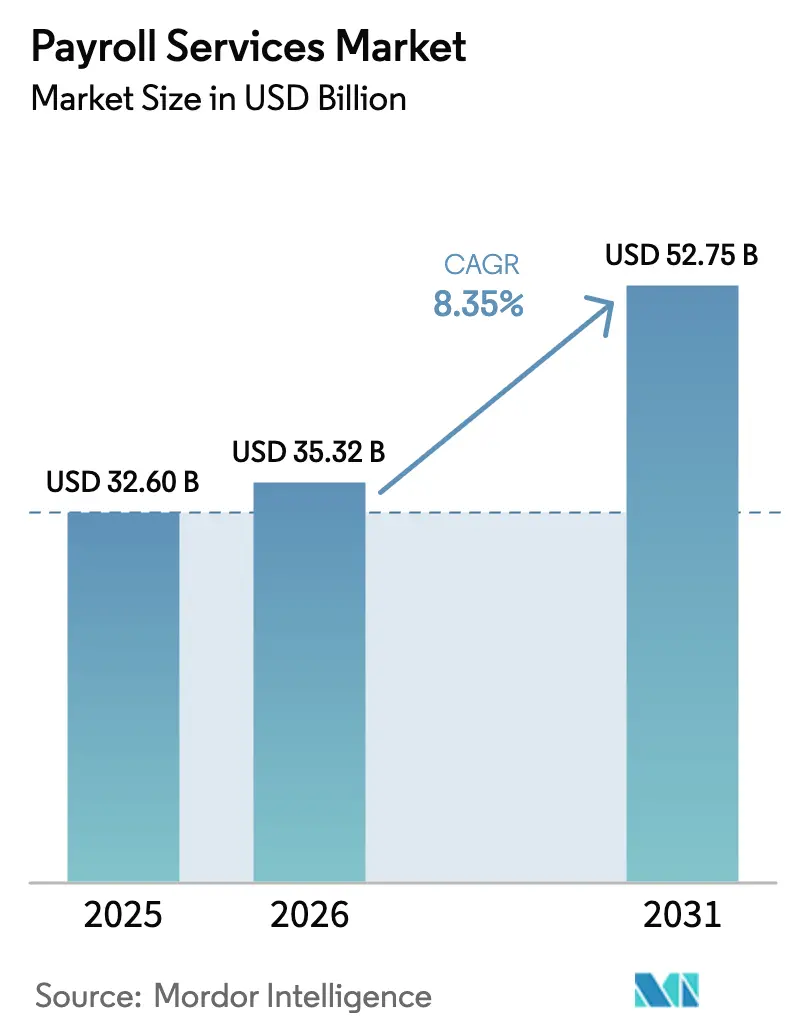
| Market Size (2026) | USD 35.32 Billion |
| Market Size (2031) | USD 52.75 Billion |
| Growth Rate (2026 - 2031) | 8.35% CAGR |
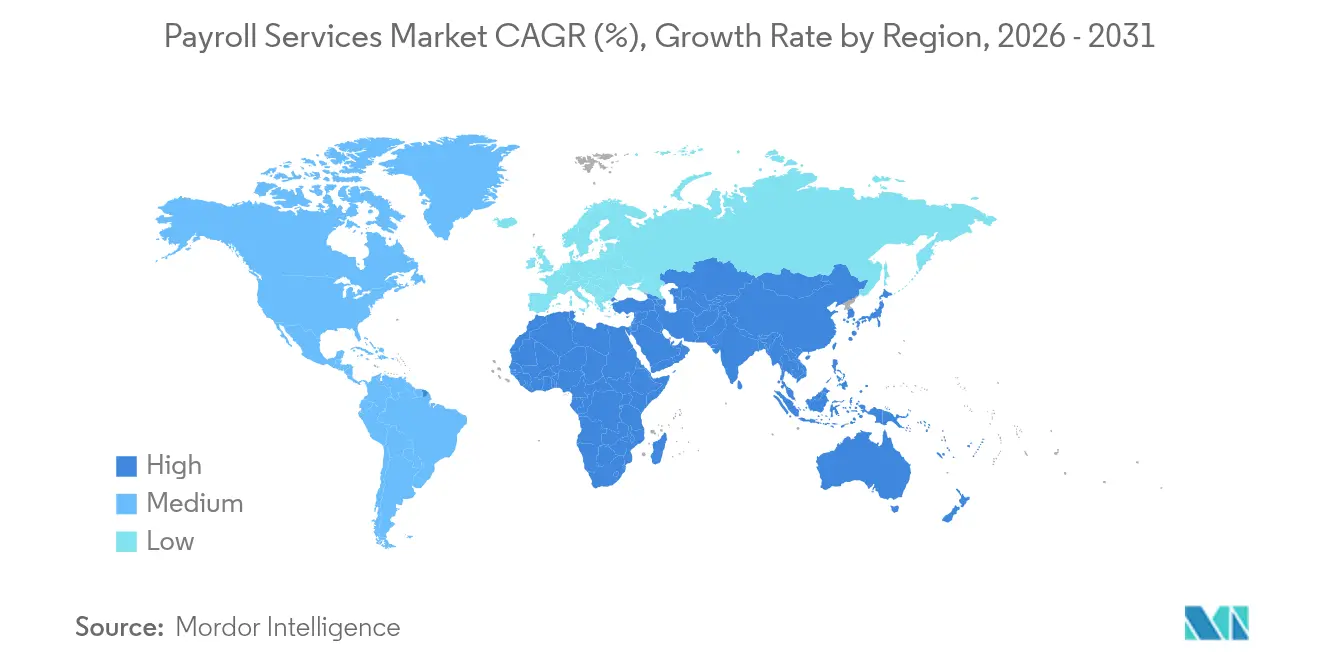
| Fastest Growing Market | Asia Pacific |
| Largest Market | North America |
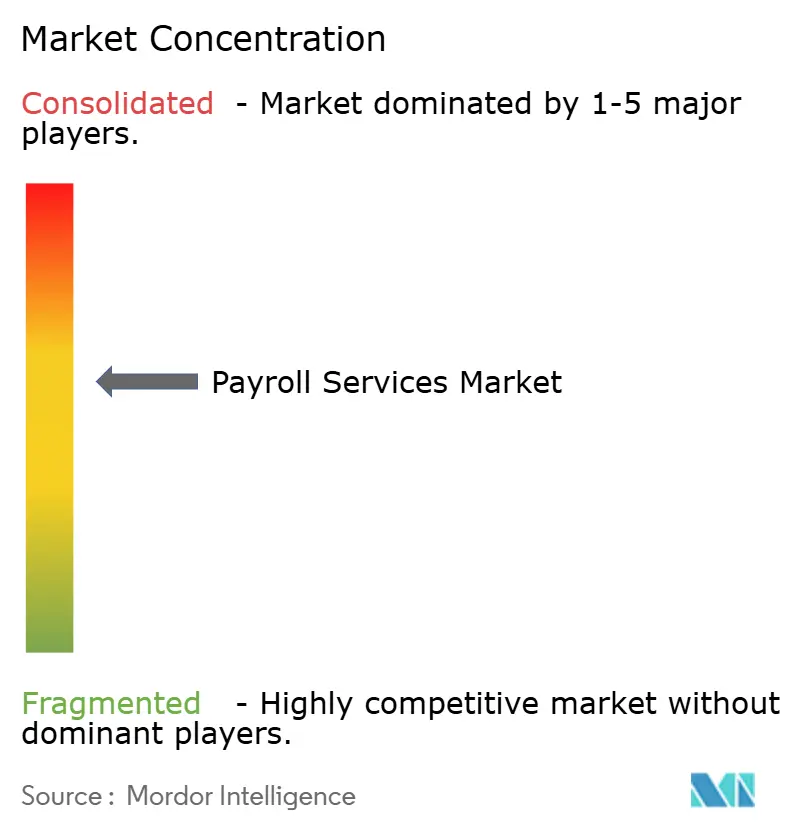
| Market Concentration | Medium |
Major Players *Disclaimer: Major Players sorted in no particular order Image © Mordor Intelligence. Reuse requires attribution under CC BY 4.0. | |
Payroll Services Market Analysis by Mordor Intelligence
Global payroll services market size in 2026 is estimated at USD 35.32 billion, growing from 2025 value of USD 32.6 billion with 2031 projections showing USD 52.75 billion, growing at 8.35% CAGR over 2026-2031. Demand accelerates as employers confront widening regulatory obligations, cross-border hiring, and real-time pay expectations. Cloud platforms now embed compliance logic for more than 140 countries, accelerating adoption among companies with limited in-house payroll teams. Large enterprises still dominate volume, yet small businesses are closing the technology gap because scalable subscription pricing removes the fixed-cost burden of on-premise software. Meanwhile, employer-of-record (EoR) vendors reshape the value proposition by bundling payroll, statutory benefits, and local entity management in a single contract, turning payroll from a back-office activity into a strategic enabler of global talent acquisition.
Key Report Takeaways
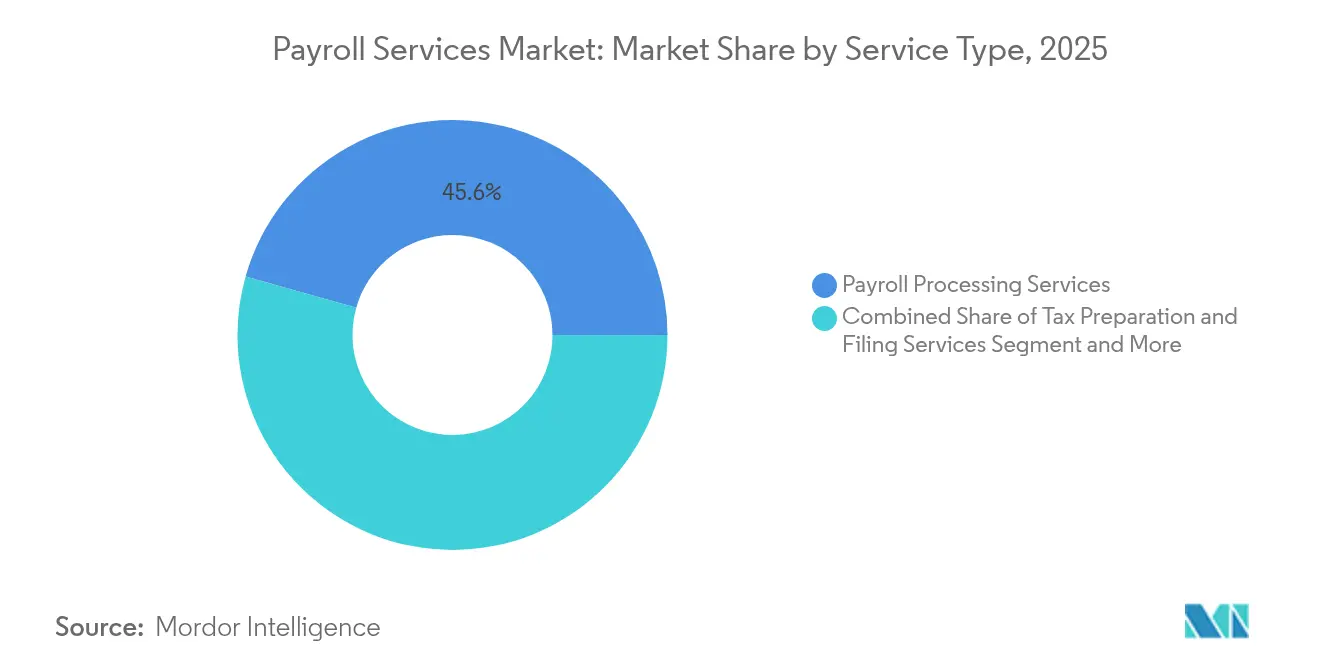
- By service type, payroll processing accounted for 45.62% of the global payroll services market in 2025, while employer-of-record services held 16.15% share and are among the fastest-growing segments through 2031.
- By business size, large enterprises held 55.55% of the global payroll services market share in 2025, while small businesses are expanding at a 13.05% CAGR through 2031.
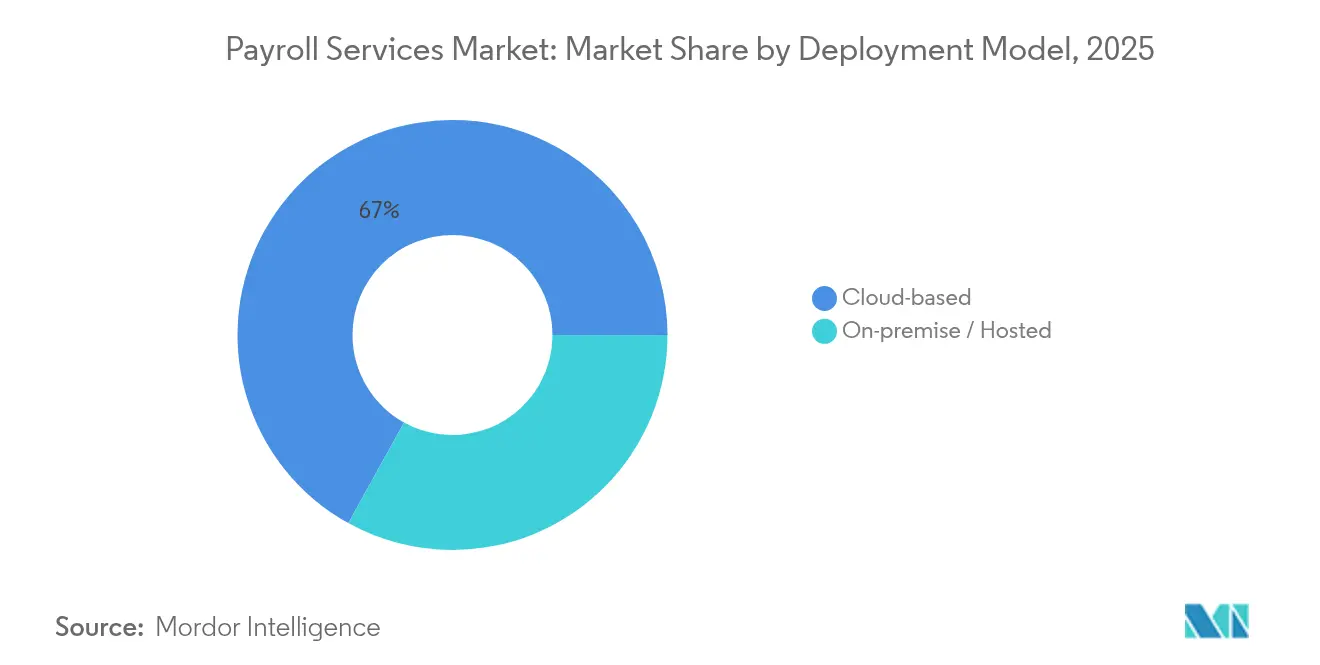
- By deployment, cloud solutions commanded 66.95% share of the global payroll services market size in 2025 and are growing at 12.2% annually.
- By vertical, the BFSI sector led with 22.08% revenue share in 2025; IT-and-telecom payroll is the fastest climber, rising at a 13.75% CAGR to 2031.
- By geography, North America contributed 38.12% of the global payroll services market size in 2025, while Asia-Pacific is pacing at an 11.4% CAGR to 2031.
Note: Market size and forecast figures in this report are generated using Mordor Intelligence’s proprietary estimation framework, updated with the latest available data and insights as of 2026.
Global Payroll Services Market Trends and Insights
Drivers Impact Analysis*
| Driver | (~) % Impact on CAGR Forecast | Geographic Relevance | Impact Timeline |
|---|---|---|---|
| Cloud adoption among SMEs | +2.1% | Global; strongest in APAC and Latin America | Medium term (2-4 years) |
| Growth of EoR platforms | +1.8% | North America and Europe lead | Short term (≤2 years) |
| Rising global hiring compliance complexity | +1.5% | EU and APAC | Long term (≥4 years) |
| Real-time payments integration | +1.2% | North America and Europe, expanding to APAC | Medium term (2-4 years) |
| AI-driven payroll anomaly detection | +0.9% | Developed markets | Medium term (2-4 years) |
| ESG-linked wage-equity mandates | +0.7% | EU and North America | Long term (≥4 years) |
| Source: Mordor Intelligence | |||
Mainstream Cloud-Based Adoption Among SMEs
Small firms now devote 20% of operating spend to wages, so executives are migrating to subscription payroll suites that slash capex and deliver one-click multi-country compliance. Wage inflation cooled to 4.5% year-over-year in January 2025, but compliance workloads still climbed, making cloud economics compelling. Vendors embed country-specific tax tables and automatic rule updates, turning sophisticated payroll into a utility that even micro-enterprises can afford. In emerging markets, leapfrogging from spreadsheets to cloud portals lets business owners bypass legacy infrastructure entirely, driving double-digit adoption and widening the total addressable global payroll services market.
Expansion of Employer-of-Record Platforms
EoR operators let companies hire in 180+ jurisdictions without forming legal entities, handing off payroll, statutory benefits, and tax remittance within one subscription. The model expands at 6.8% annually, mirroring the rise of borderless tech teams. Technology firms use EoR contracts to pilot new markets in Asia-Pacific, where labor codes and currency restrictions are challenging to navigate. M&A shows the land-grab: providers acquire regional specialists to bundle local compliance into their global stack, shortening launch timelines for multinational clients.
Increasing Global Hiring Compliance Complexity
Data-sovereignty statutes, equal-pay rules, and worker-classification tests proliferate. The U.S. Department of Justice rule, effective April 2025, restricts transfers of sensitive payroll data to certain foreign jurisdictions, compelling providers to architect localized storage nodes. India’s Digital Personal Data Protection Act layers on fiduciary obligations for processors handling employee files. Vendors capable of safeguarding data across divergent regimes command premium fees and capture share.
Real-Time Payments Integration with Payroll Rails
As instant payment networks mature, employees expect on-demand wage access. Compensation costs rose 3.6% in the year to March 2025, adding urgency to liquidity planning. Payroll engines now plug into real-time rails to push net pay within seconds, improving cash-flow flexibility for workers and offering employers a retention lever. Providers must maintain multi-currency liquidity buffers, deepening the moat against smaller rivals.
Restraints Impact Analysis*
| Restraint | (~) % Impact on CAGR Forecast | Geographic Relevance | Impact Timeline |
|---|---|---|---|
| Heightened data-sovereignty regulations | -1.4% | EU and APAC | Short term (≤2 years) |
| Cross-border FX volatility and treasury cost | -1.1% | Emerging markets | Medium term (2-4 years) |
| Shortage of certified payroll talent | -0.8% | North America and Europe | Long term (≥4 years) |
| Fragmented HCM API standards | -0.6% | Global | Medium term (2-4 years) |
| Source: Mordor Intelligence | |||
Heightened Data-Sovereignty Regulations
Data-localization mandates force providers to replicate infrastructure in every jurisdiction they serve, inflating cost-to-serve and elongating deployment cycles. India’s statute can classify a large global payroll provider as a Significant Data Fiduciary, triggering heavier audit and breach-notification duties. Smaller vendors lacking capital for regional data centers may retreat to domestic markets, trimming overall capacity in the global payroll services market.
Cross-Border FX Volatility and Treasury Costs
The U.S. current-account deficit narrowed to 3% of GDP in 2024, yet emerging-market currencies remain volatile, exposing providers to translation losses when settling salaries across 50+ currencies. Hedging programs and multi-currency wallets demand scale and banking relationships unavailable to niche processors, squeezing margins and slowing expansion.
*Our forecasts treat driver/restraint impacts as directional, not additive. The impact forecasts reflect baseline growth, mix effects, and variable interactions.
Segment Analysis
By Service Type: EoR Platforms Reshape Traditional Boundaries
Employer-of-record services are expanding at 15.25% CAGR, shrinking the share of standalone processors to 45.62% in 2025. The rise of integrated EoR suites illustrates how users now buy compliance assurance and workforce mobility in a single SKU, rather than stitching together payroll, benefits, and legal counsel across dozens of countries. Strategic bundles command premium pricing, sustaining margin expansion even as the global payroll services market grows.
EoR platforms also blur the line between payroll and broader HR tech. Providers embed onboarding, time-tracking, and statutory benefits into one workflow. Innovations like self-service paycheck validation—Paycom’s Beti is a leading example—shift data entry to employees, driving accuracy, and reducing back-office effort. As these capabilities converge, transactional payroll alone risks commoditization inside the global payroll services industry.


By Business Size: SME Acceleration Drives Market Expansion
Large employers still account for 55.55% of revenue, yet small enterprises are the fastest mover at 13.05% CAGR. With payroll eating one-fifth of a typical small-business budget, owner-managers embrace cloud suites that auto-update tax tables and file returns electronically. SaaS pricing based on active headcount rather than perpetual licenses lowers the barrier of entry. This trend makes the global payroll services market more evenly distributed and intensifies competition for down-market logos.
Cloud accessibility also compresses feature disparity between micro-firms and Fortune 1000 employers. Research on Bahraini SMEs shows cloud HRM upgrades cut manual paperwork and energy use, underlining both cost and sustainability gains. As usage grows, the global payroll services market size for the SME tier is projected to widen at a pace once limited to large-enterprise rollouts.
By Deployment Model: Cloud Dominance Accelerates
Cloud deployments already hold 66.95% of the global payroll services market share and still post a 12.2% growth clip. Remote and hybrid workplaces demand browser-based access with no VPN friction, favoring multi-tenant SaaS architectures. Real-time tax-rule updates and API integration with banking networks further increase switching costs for on-premise users.
On-premise installations persist in heavily regulated industries, but even banks now pilot hosted ‘private-SaaS’ pods inside accredited data centers, migrating sensitive workloads once audit sign-off is secured. With security tooling—from auto-patching to ransomware detection—now demonstrably stronger in hyperscale clouds, legacy inclination toward physical servers is fading quickly across the global payroll services market.
By Industry Vertical: IT Sector Leads Digital Transformation
BFSI still contributes 22.08% of spending owing to stringent audit trails, yet IT-and-telecom payroll is the pacesetter, rising 13.75% annually as software firms staff distributed dev teams. Each time zone and currency complicates gross-to-net calculations; tech companies, therefore, over-index on integrated solutions that autofill statutory deductions and feed expense data into ERP ledgers.
Healthcare employers add complexity via shift differentials and union agreements, while manufacturers juggle hourly overtime and piece-rate incentives. The Employment Situation report showed healthcare adding 54,000 jobs in May 2025 with hourly earnings of USD36.00, raising urgency for systems that automate variable pay and compliance. Specialized rule libraries for these use-cases carve out new white-space for vendors that extend beyond generic payroll scripts, expanding the accessible global payroll services market.
Geography Analysis
North America leads in absolute revenue thanks to established SaaS acceptance and a dense ecosystem of payroll intermediaries. Recent mega-deals, such as Acrisure’s USD 1.1 billion purchase of Heartland Payroll Solutions, show incumbents bulking up to defend turf. Yet wage growth has tempered to 4.5%, so providers now compete on instant pay, analytics, and wellness add-ons rather than basic processing.
Asia-Pacific is the headline growth story. Fast-rising wages, widening middle-class employment, and divergent labor laws make automated payroll a necessity. Deals like Ascentium’s acquisition of Links International demonstrate the premium placed on in-country expertise for statutory reporting across Japan, Macau, and South Korea. Vendors that master multilingual interfaces and multi-currency net-pay calculations are scaling fastest.
Europe’s opportunity centres on ESG compliance. The region’s directive-driven need for pay-equity analytics is spurring upgrades even among enterprises already running cloud payroll. Meanwhile, currency swings in emerging European economies elevate treasury-management hurdles, nudging corporates toward vendors offering in-platform hedging modules.
Mordor Intelligence provides coverage of the payroll services market across other key regional markets. Detailed country-level analysis extends to United States incorporating local coverage and market participation, as required.

Competitive Landscape
The global payroll services market remains moderately fragmented. ADP and Paychex leverage decades-long compliance pedigrees, but cloud-first challengers such as Paycom scale rapidly through self-service UX and continuous product releases. Paycom now supports data for more than 7 million employees, yet still commands under 5% share—evidence of ample consolidation runway.
Strategic M&A is accelerating. Acrisure’s USD 1.1 billion Heartland deal and Paychex’s Paycor buyout extend client rosters and add mid-market depth. Cloud natives are equally acquisitive: EoR specialists are snapping up regional players to deepen local statutory expertise. AI and real-time pay integration are the next battlegrounds; platforms embedding anomaly detection and push-to-card payout APIs are capturing premium price points.
Looking forward, success hinges on balancing horizontal scale with vertical or regional depth. Vendors that can map every payroll rule, support every major payment rail, and surface ESG analytics through a single interface will consolidate share in the expanding global payroll services market.
Payroll Services Industry Leaders
ADP
Paychex
Rippling
Deel
OnPay
- *Disclaimer: Major Players sorted in no particular order

Recent Industry Developments
- May 2025: Acrisure completed a USD 1.1 billion acquisition of Heartland Payroll Solutions, underscoring consolidation for scale advantages.
- January 2025: Paychex agreed to acquire Paycor to bolster mid-market coverage and expand its technology stack.
- January 2025: The U.S. Department of Justice implemented rules limiting cross-border payroll data flows, raising compliance stakes.
- February 2024: Ascentium bought Links International, adding local payroll capabilities across four Asia-Pacific countries.


Research Methodology Framework and Report Scope
Market Definitions and Key Coverage
Our study defines the payroll services market as all fee-based external solutions that calculate gross-to-net pay, file payroll taxes, disburse wages, and maintain statutory records for salaried or contract workers across domestic and cross-border locations. These solutions span stand-alone payroll processors, employer-of-record (EoR) platforms, and bundled bookkeeping or HR administration add-ons.
Scope Exclusion: in-house payroll software sold under perpetual licenses is not counted within this market.
Segmentation Overview
- By Service Type
- Payroll Processing Services
- Tax Preparation and Filing Services
- Other Accounting and HR Admin Services
- By Business Size
- Small Enterprises (1–99)
- Medium Enterprises (100–999)
- Large Enterprises (1,000+)
- By Deployment Model
- Cloud-based
- On-premise / Hosted
- By Industry Vertical
- IT and Telecom
- BFSI
- Healthcare
- Manufacturing
- Retail and eCommerce
- Others
- By Geography
- North America
- United States
- Canada
- Mexico
- South America
- Brazil
- Argentina
- Rest of South America
- Europe
- Germany
- United Kingdom
- France
- Spain
- Russia
- Rest of Europe
- Asia-Pacific
- China
- India
- Japan
- South Korea
- Rest of Asia-Pacific
- Middle East
- Israel
- Saudi Arabia
- United Arab Emirates
- Turkey
- Rest of Middle East
- Africa
- South Africa
- Egypt
- Rest of Africa
- North America
Detailed Research Methodology and Data Validation
Primary Research
Mordor analysts interviewed payroll heads at multinational corporations, SME finance managers, EoR platform product leads, and regional compliance consultants across North America, Europe, and Asia-Pacific. These conversations validated adoption triggers, clarified fee structures by employee band, and pressure-tested the growth assumptions derived from desk research.
Desk Research
We began with trusted labor and tax datasets such as the US Bureau of Labor Statistics' employment tables, OECD employment cost indices, International Labour Organization wage databases, and World Bank entrepreneurship series, which anchor workforce size, wage bills, and business creation trends. Industry-specific context was enriched through the American Payroll Association, HMRC's PAYE real-time data release, Australia's Single Touch Payroll disclosures, and public filings that reveal average payroll spend per employee. Commercial intelligence drawn from D&B Hoovers and Dow Jones Factiva supplied revenue splits and acquisition prices that flag service pricing corridors. The sources listed illustrate the range consulted; many additional public records, journals, and national statistics offices were reviewed to complete our desk work.
Market-Sizing & Forecasting
A top-down build combines salaried and contingent worker headcounts with average payslip processing fees, adjusted for multi-country premiums and cloud uptake rates, which are then cross-checked through selective bottom-up supplier roll-ups and channel checks. Key variables feeding the model include: 1) formal sector employment growth, 2) percentage of firms outsourcing any payroll task, 3) cloud HR adoption rate, 4) average fee per employee by company size, and 5) regulatory change intensity indexes. A multivariate regression projects these drivers to 2030, while scenario analysis cushions for abrupt statutory shifts. Data gaps in bottom-up estimates are bridged through interpolations using nearest peer pricing or regional fee medians.
Data Validation & Update Cycle
Outputs pass a three-layer review that screens residue errors, variance versus historical series, and peer benchmarks; anomalies trigger re-contact with sources. Reports refresh yearly, with mid-cycle updates when material events such as landmark wage legislation arise. Before delivery, an analyst performs a fresh validation pass so clients receive the latest view.
Why Mordor's Payroll Services Baseline Commands Dependability
Published numbers often diverge because firms differ in service scope, fee assumptions, and refresh cadence.
Key gap drivers include: whether EoR revenues are folded in, if tax-filing only services are counted, the fee per payslip assumption, and the choice of currency conversion year. Mordor's model applies a transparent scope, updates annually, and blends both actual fee data and employment statistics, making our baseline balanced and repeatable.
Benchmark comparison
| Market Size | Anonymized source | Primary gap driver |
|---|---|---|
| USD 32.6 B (2025) | Mordor Intelligence | |
| USD 73.3 B (2025) | Regional Consultancy A | Counts HR software subscriptions alongside services |
| USD 37.4 B (2024) | Industry Association B | Excludes cross-border EoR fees |
| USD 12.2 B (2024) | Global Consultancy C | Uses SME-only sample then scales globally |
Together, the comparison shows that when service definitions and sampling frames shift, market values swing widely. By triangulating multiple datasets and maintaining a clear scope, Mordor Intelligence delivers a dependable baseline for planning and investment decisions.


Key Questions Answered in the Report
What is the current value of the global payroll services market?
The global payroll services market size stands at USD 35.32 billion in 2026 and is projected to hit USD 52.75 billion by 2031.
Which deployment model is growing fastest?
Cloud platforms dominate with 66.95% share and are advancing at a 12.2% CAGR thanks to lower up-front costs and seamless compliance updates.
Why is Asia-Pacific considered the growth engine?
Salary inflation exceeding 4.6% and rapidly formalizing labor markets push enterprises toward automated, multi-country payroll, generating an 11.4% regional CAGR.
How are employer-of-record platforms changing the landscape?
EoR vendors let companies hire overseas without local entities, expanding at 15.25% CAGR and bundling payroll with statutory compliance.
What new regulations most affect payroll providers?
Data-sovereignty rules such as the U.S. DOJ directive and India’s Digital Personal Data Protection Act require localized storage and stricter oversight.
How are real-time payments influencing payroll solutions?
Integration with instant payment rails enables same-day wage access, differentiating providers and boosting employee retention in North America and Europe.
Page last updated on:


