
Nano Radiation Sensors Market Size and Share
Market Overview
| Study Period | 2020 - 2031 |
|---|---|
| Market Size (2026) | USD 382.13 Billion |
| Market Size (2031) | USD 466.94 Billion |
| Growth Rate (2026 - 2031) | 4.11 % |
| Fastest Growing Market | Asia Pacific |
| Largest Market | North America |
| Market Concentration | Medium |
Major Players *Disclaimer: Major Players sorted in no particular order Image © Mordor Intelligence. Reuse requires attribution under CC BY 4.0. | |
Nano Radiation Sensors Market Analysis by Mordor Intelligence
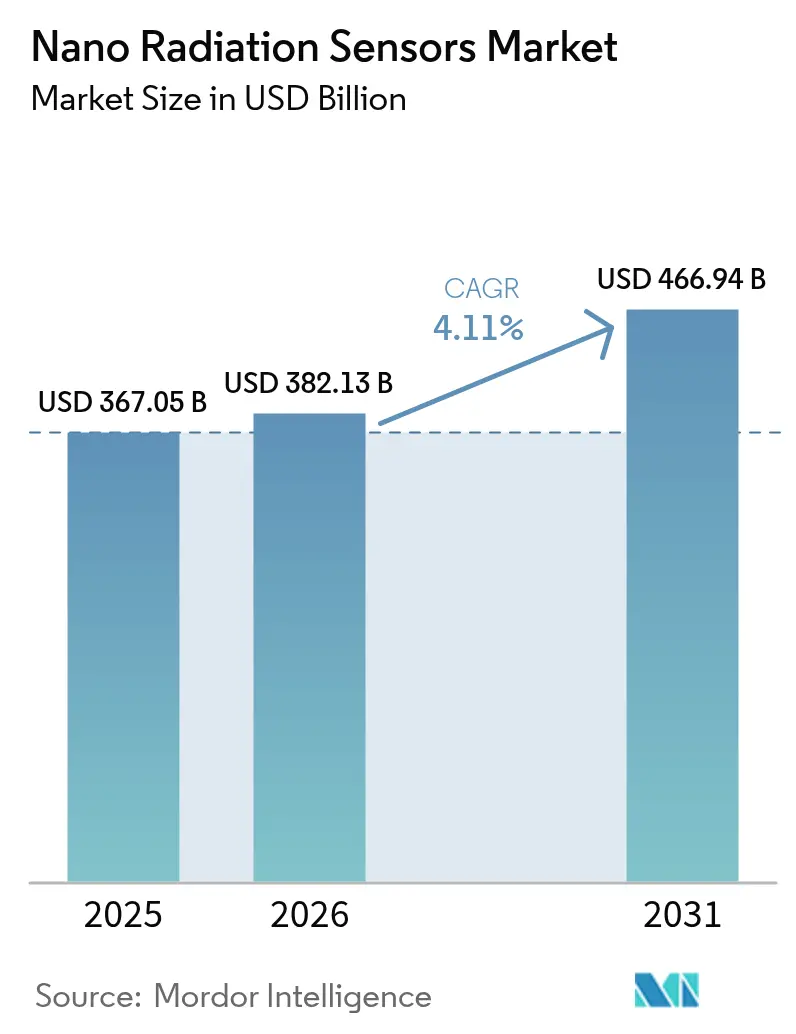
The nano radiation sensors market size is expected to grow from USD 367.05 billion in 2025 to USD 382.13 billion in 2026 and is forecast to reach USD 466.94 billion by 2031 at 4.11% CAGR over 2026-2031. Growth reflects consistent miniaturization across consumer electronics, aerospace, and automotive systems, paired with stringent safety rules in nuclear decommissioning and space exploration. Recent breakthroughs in perovskite semiconductor materials now allow detector footprints small enough for smartphone integration and wearable patches, removing long-standing size and power barriers. Government stimulus ranging from the GBP 30 million package under the UK Nuclear Decommissioning Authority to the USD 105 million CHIPS Act grant for Analog Devices shortens commercialization cycles and accelerates supply expansion. CubeSat proliferation, particularly in university and startup missions, compounds the addressable volume for ultra-light sensors, while parallel demand arises from healthcare dosimetry and automotive safety subsystems. Manufacturing complexity and yield losses remain the most significant constraints; however, firms that resolve material-stability issues while maintaining cost control gain an immediate competitive edge. [1]UK Government, “NDA invests £30 million in decommissioning innovation,” gov.uk
Key Report Takeaways
- By type, solid-state detectors led with 57.35% of the nano radiation sensors market share in 2025; scintillation detectors are projected to expand at a 6.32% CAGR through 2031.
- By material, silicon-based devices accounted for 45.20% share of the nano radiation sensors market size in 2025, whereas perovskite devices are poised to grow at an 8.05% CAGR to 2031.
- By application, healthcare held 29.12% revenue share in 2025; automotive is forecast to advance at a 6.74% CAGR through 2031.
- By technology, direct-conversion photon-counting systems captured 41.35% share of the nano radiation sensors market size in 2025, while flexible perovskite scintillators exhibit an 8.18% CAGR outlook.
- By detection radiation type, gamma/X-ray sensors commanded 50.25% of the nano radiation sensors market share in 2025 and are expected to grow at a 6.95% CAGR to 2031.
- By form factor, module units dominated with 47.40% contribution in 2025; wearable patches register the highest 8.72% CAGR through 2031.
- Regional view: North America retained 34.65% share of the nano radiation sensors market in 2025, whereas APAC is growing fastest at a 5.73% CAGR to 2031.
Note: Market size and forecast figures in this report are generated using Mordor Intelligence’s proprietary estimation framework, updated with the latest available data and insights as of 2026.
Market Trends and Insights
Drivers Impact Analysis of Nano Radiation Sensors Market*
| Driver | (~) % Impact on CAGR Forecast | Geographic Relevance | Impact Timeline |
|---|---|---|---|
| Miniaturization trend across industries | 1.20% | Global, with concentration in APAC consumer electronics hubs | Medium term (2-4 years) |
| Government nanotech funding & standards | 0.80% | North America & EU, with spillover to allied nations | Long term (≥ 4 years) |
| Growing demand for high-precision healthcare dosimetry | 0.70% | Global, early adoption in developed healthcare systems | Medium term (2-4 years) |
| Nuclear decommissioning & safety regulations | 0.50% | North America & EU, with expansion to aging reactor markets | Long term (≥ 4 years) |
| CubeSat & small-sat adoption of nano-sensors | 0.40% | Global space markets, concentrated in US, EU, China | Short term (≤ 2 years) |
| Flexible perovskite scintillators enable wearable dosimetry | 0.60% | APAC manufacturing centers, global deployment | Medium term (2-4 years) |
| Source: Mordor Intelligence | |||
Miniaturization trend across industries
Relentless downsizing in consumer electronics and automotive platforms pushes radiation sensor modules toward wafer-level integration. Sharp demonstrated a 25 × 20 × 2.5 mm module drawing only 7.5 mW, making smartphone-based radiation tracking practical. Parallel progress in 5 nm and 3 nm process nodes allows logic and detection circuitry to share a common die, lowering bill-of-materials costs for original-equipment manufacturers. In automobiles, compact sensors now fit inside existing electronic control units, supporting Advanced Driver Assistance Systems without altering cabin design. As IoT architectures spread, distributed nano radiation sensors can be deployed in factories and hospitals at node-level costs that were unattainable five years ago. [2]U.S. Department of Commerce, “Preliminary Memorandum of Terms with Analog Devices,” commerce.gov
Government nanotech funding and standards
Targeted public programs guarantee long-term demand while harmonizing certification. The U.S. Department of Commerce earmarked USD 105 million for Analog Devices to modernize three domestic fabs, explicitly citing commercial and defense radiation detection as priority outputs. The UK Nuclear Decommissioning Authority injected GBP 30 million into sensor R & D to support safe dismantling of legacy reactors. In parallel, the European Commission’s Horizon Europe platform directs resources toward sustainable radiation-protection technology. ISO and IEEE working groups now draft unified nano sensor test protocols that cut compliance cycles and enable cross-border procurement.
Growing demand for high-precision healthcare dosimetry
Modern proton-therapy centers and interventional radiology suites need sub-0.1 mm dose mapping to minimize collateral tissue exposure. Lab prototypes employing perovskite detectors have achieved sensitivities of 15,891 µC Gy_air-1 cm-2 and detection limits down to 260 nGy, an order-of-magnitude jump over conventional solid-state dosimeters. The rise of wearable staff monitors improves occupational safety by logging cumulative dose in real time. Coupling sensor streams with machine-learning software allows dose prediction and automatic beam adjustment, reinforcing clinical accuracy while reducing manual recalibration cycles.
Nuclear decommissioning and safety regulations
As reactors in the US, Europe, and parts of Asia reach retirement, plant operators face strict mandates for continuous radiation surveillance. Nano radiation sensors embedded on mobile robots enable remote mapping of hotspots, trimming human exposure and accelerating cleanup schedules. Gallium-nitride–based devices extend operating life under intense radiation, reducing replacement frequency in high-flux zones. Regulatory agencies such as the U.S. NRC now stipulate networked sensor arrays during dismantling phases, making distributed nano platforms a procurement requirement rather than a speculative upgrade.
Restraints Impact Analysis of Nano Radiation Sensors Market*
| Restraint | (~) % Impact on CAGR Forecast | Geographic Relevance | Impact Timeline |
|---|---|---|---|
| Manufacturing complexity & yield losses | -0.90% | Global semiconductor manufacturing centers | Short term (≤ 2 years) |
| High capital cost of nano-fabrication lines | -0.60% | Advanced manufacturing economies | Long term (≥ 4 years) |
| Lack of integration standards across OEMs | -0.40% | Global, with fragmentation in emerging markets | Medium term (2-4 years) |
| Stability issues of perovskite / organic materials | -0.70% | Research-intensive markets globally | Medium term (2-4 years) |
| Source: Mordor Intelligence | |||
Manufacturing complexity and yield losses
Sub-10 nm features needed for latest detector architectures experience higher defect rates than mainstream logic chips, depressing first-pass yields below 60% at several foundries. Supply-chain shocks—such as the temporary shutdown of Spruce Pine’s quartz mine that feeds high-purity silica into photolithography mask blanks—amplify cost pressures by constricting vital materials. Fab operators must adopt tighter particulate controls and advanced metrology, driving up per-wafer operating expenses in the short run.
Stability issues of perovskite / organic materials
Ion migration, moisture sensitivity, and thermal cycling degrade perovskite detectors, causing drift that disqualifies units from critical-safety roles. Encapsulation techniques and grain-boundary passivation improve stability, yet large-scale reliability data remain scarce, forcing extended validation and slowing product launch timelines. The trade-off between flexible form factors and long-term calibration integrity remains the core engineering dilemma for startups entering this segment.
*Our forecasts treat driver/restraint impacts as directional, not additive. The impact forecasts reflect baseline growth, mix effects, and variable interactions.
Nano Radiation Sensors Market Segment Analysis
By Type:
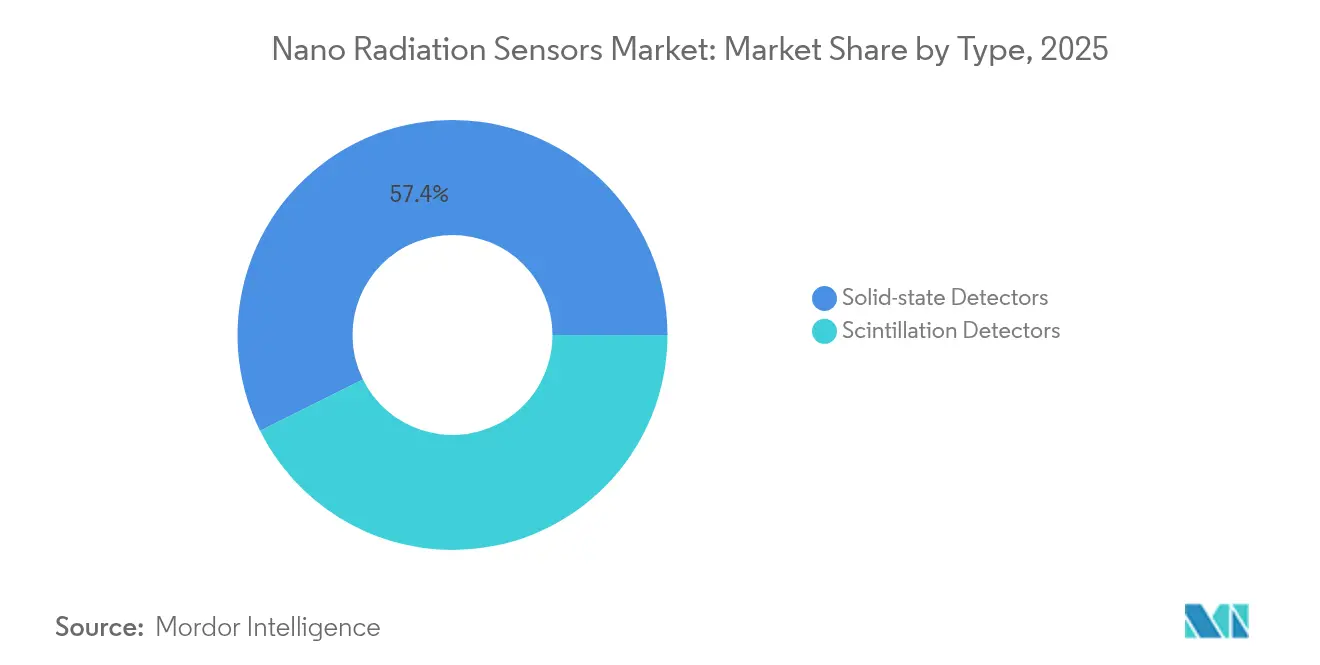
Solid-state Dominance Drives IntegrationSolid-state detectors captured 57.35% of 2025 revenue within the nano radiation sensors market, leveraging CMOS compatibility to embed sensing elements directly onto mixed-signal chips. This architecture trims power budgets and simplifies board layouts, attributes valued in medical imaging consoles and satellite payloads. Scintillation units, though smaller in share, benefit from 6.32% CAGR prospects tied to perovskite nanocrystal breakthroughs delivering light yields above 100,000 photons MeV-1. Hybrid designs now merge solid-state readout with nanocrystal scintillators, achieving sub-400 ps response while retaining wafer-level processing economies. Second-generation solid-state platforms adopt nano-plasmonic enhancement layers that triple photon-collection efficiency without expanding footprint. As perovskite coatings mature, manufacturers experiment with monolithic integration of high-Z scintillators atop silicon photodiodes, pointing toward single-chip gamma cameras for endoscopic surgery. The evolution indicates that categorical boundaries between solid-state and scintillation approaches will blur, generating new revenue pools throughout the nano radiation sensors industry.



By Material:
Silicon Foundation Enables Perovskite InnovationSilicon maintained 45.20% contribution to 2025 revenue, offering reliable supply and extensive foundry support that underpins the current nano radiation sensors market size for mainstream applications. Production learning curves keep average selling prices predictable, a trait essential for automotive Tier-1 suppliers committing to decade-long product cycles. Perovskite detectors, at 8.05% CAGR, benefit from solution processing that allows roll-to-roll coating of flexible substrates, widening addressable opportunities in wearable health monitors and drone platforms. Composite stacks merging silicon ASICs with thin perovskite absorber layers allow detection of soft X-ray and low-energy gamma photons in a single envelope, improving multispectral imaging for nondestructive testing. Lead-free compositions featuring manganese complexes reach photoluminescence quantum yields above 80%, providing an environmental upgrade without sacrificing detection efficiency. These hybrid stacks signal an inflection point where material-choice decisions become application-specific rather than supply-chain constrained.
By Application:
Healthcare Precision Accelerates Automotive SafetyHealthcare generated 29.12% of 2025 revenue, as oncology centers increasingly specify nano-level dose-profiling tools. Integration of AI analytics converts real-time counts into adaptive beam modulation, reducing healthy-tissue irradiation. Automotive safety registers the highest 6.74% CAGR thanks to sensor fusion within ADAS platforms, where radiation sensors validate LIDAR and camera function under cosmic-ray exposure during high-altitude driving. Consumer electronics uptake rises through smartphone add-ons that alert users to environmental radiation, a trend boosted by China’s mass-produced 15 mm × 15 mm × 3 mm chip released by CNNC. Industrial plants adopt networked nano detectors to monitor sealed-source gauges without daily human inspection. Oil-and-gas majors deploy ruggedized neutron sensors for downhole logging, while nuclear power operators embed direct-conversion arrays near reactor cores for continuous flux mapping, evidencing wide cross-industry pull.
By Technology:
Direct Conversion Leads Flexible InnovationDirect-conversion photon-counting held 41.35% share of the 2025 nano radiation sensors market size, favored for low-dose imaging where electronic noise suppression is mandatory. Energy-dispersive medical CT scanners, for instance, rely on cadmium-telluride or silicon-drift pixels to improve contrast at reduced patient exposure. Flexible perovskite scintillator panels, growing at 8.18% CAGR, promise garment-integrated dosimetry for nuclear-medicine staff. Indirect scintillation-CMOS cameras dominate baggage-screening lines, while radiation-hardened SoC modules serve cubesat avionics that endure high orbit doses. Research groups have prototyped DNA-inspired fiber detectors surviving 1,000 stretch cycles while preserving calibration, making them ideal for firefighter turnout gear. The convergence of flexible substrates with ultra-low-power Bluetooth links supports self-organizing sensor swarms across industrial sites.
By Detection Radiation Type:
Gamma Dominance Enables Alpha InnovationGamma/X-ray devices delivered 50.25% of total revenue in 2025 and exhibit a superior 6.95% CAGR, reflecting pervasive usage in medical diagnostics, cargo inspection, and nuclear safeguards. Emerging ultrahigh-resolution alpha imagers, attaining 2 µm spatial precision, open market space in semiconductor-cleanroom contamination checks and spent-fuel microanalysis. Beta detectors address radiopharmaceutical dosing in nuclear medicine, whereas neutron counters, employing lithium fluoride converters, remain indispensable for reactor-core monitoring and port-security portals. Sensor providers increasingly integrate multi-modal stacks-such as layered perovskite-silicon detectors-capable of concurrent gamma and neutron counting, simplifying payload design for lunar surface probes where mass budgets are strict.
By Form Factor:
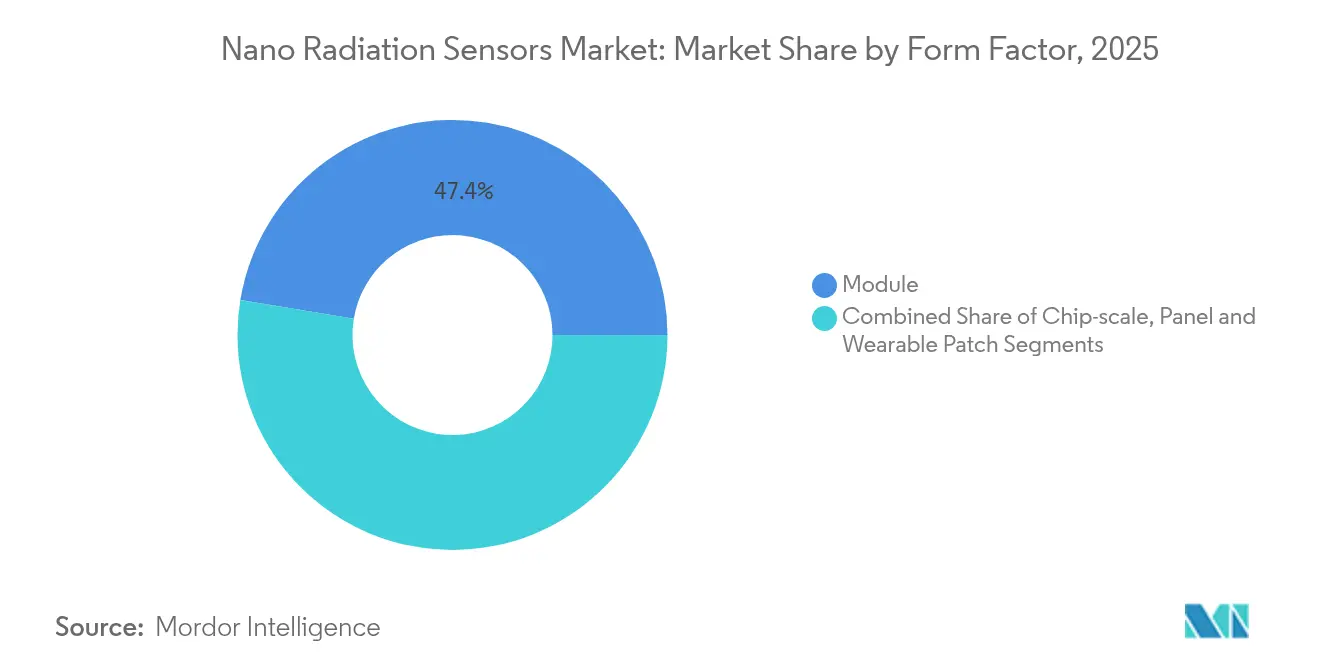
Module Flexibility Drives Wearable InnovationModules accounted for 47.40% of 2025 shipments, striking a balance between performance and drop-in design simplicity for integrators. Standardized pinouts let OEMs refresh detection capability without redrawing system boards. Wearable patches, expanding at 8.72% CAGR, ride regulatory pushes for continuous staff monitoring in nuclear medicine wards. Textile-based dosimeters convert cotton yarn into active sensing fibers using nano-surface functionalization, delivering comfort equal to everyday clothing. Chip-scale packages less than 3 mm thick support board-area-constrained applications such as swarming drones. Wide-area panels protect airport checkpoints and scrap-metal yards where coverage overrides miniaturization.
Geography Analysis
North America, APAC and Europe Nano Radiation Sensors Market
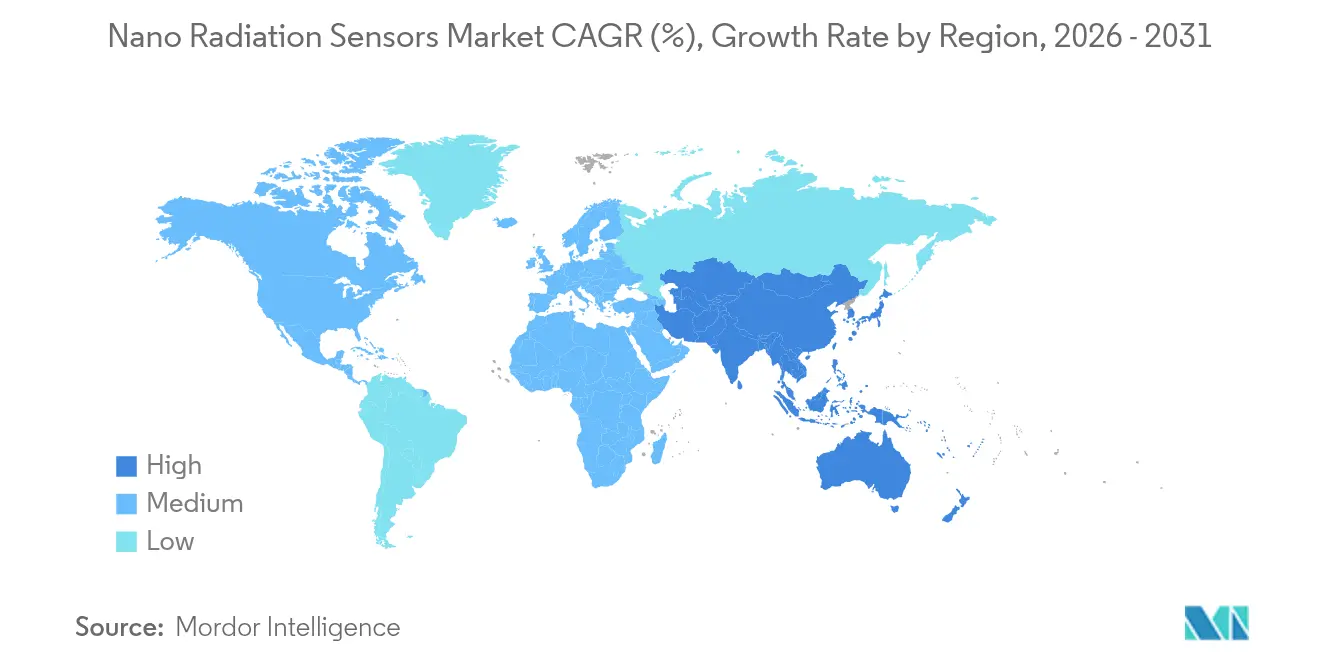
North American leadership, with 34.65% 2025 share, is anchored by continuous defense procurement and multi-billion-dollar modernization across 93 operating nuclear reactors. Analog Devices is tripling wafer starts in Massachusetts and Oregon under the CHIPS Act, securing long-run availability of military-grade detectors. Thermo Fisher’s enlarged US network of 64 manufacturing sites reinforces domestic supply for healthcare, industrial NDT, and homeland-security programs, while AI-augmented monitoring at two US pressurized-water reactors cuts unscheduled outage hours through predictive analytics. APAC shows the fastest 5.73% CAGR forecast, underpinned by China’s successful scaling of smartphone-compatible radiation chips, which broaden public-safety adoption. Japan maintains domain expertise via Sharp’s ultra-thin sensor module and JAEA’s silicon gamma-ray detectors qualified for boiling-water reactor retrofits. South Korea’s LEO-DOS payload on NEXTSat-2 validates homegrown radiation-hard designs for low-Earth-orbit dosimetry, signalling export-ready competence for emerging space economies in Southeast Asia. Europe prioritizes safe dismantling of 171 GW of nuclear capacity set for phase-out before 2050, creating near-term demand peaks for distributed sensor arrays. The UK’s GBP 30 million research grant seeds university-industry consortia to prototype autonomous robotic monitors. Germany’s automotive Tier-1 suppliers explore integrating radiation sensing into ADAS control units to certify electronics against single-event upsets, while France’s EDF upgrades core flux mapping with nano sensors to extend plant licenses beyond 60 years. Finland’s University of Jyväskylä produced a handheld multi-purpose detector that merges neutron, gamma, and beta channels, supporting first-responder toolkits across the continent.

Regulatory Landscape
Regulatory requirements for nano radiation sensors cover radiation protection rules, instrument performance standards, medical-device compliance, and trade controls affecting semiconductor inputs. In the United States, the Nuclear Regulatory Commission (NRC) moved in July 2026 to reform and modernize its radiation protection framework, including proposed updates tied to ALARA concepts, which influences qualification and documentation expectations for continuous monitoring systems used in decommissioning and other regulated nuclear activities.
Standards and trade policy also affect market access and supply economics. IEEE N42.35-2025 updates performance-testing expectations for radiation detection systems, while IEC 62387:2022 (with 2025 draft amendments) specifies requirements for passive dosimetry used in individual and workplace monitoring, which feed into procurement specifications in hospitals, industrial safety programs, and nuclear sites. On the supply side, a White House proclamation effective January 15, 2026 introduced a 25% ad valorem duty on imported semiconductors (with defined exemptions), and USTR action in December 2025 under Section 301 maintained pressure on China-linked semiconductor supply chains, raising the importance of compliant sourcing strategies for sensor OEMs and module integrators.
Value Chain Analysis
The value chain starts with specialty inputs (high-purity semiconductor and scintillator materials and substrates), then moves through nano-fabrication and device build (wafer processing, crystal growth, thin-film deposition, packaging), followed by calibration and verification to meet radiological performance requirements. It ends with integration into end systems for healthcare imaging and dosimetry, industrial monitoring, space payloads, and nuclear safety networks.
Downstream, system integrators and OEMs embed sensor modules into instruments and connected monitoring platforms, where calibration labs and service networks support recurring value in regulated and mission-critical deployments. Bottlenecks concentrate around material and component chokepoints, including single-source dependencies for crystalline scintillator cores, refining constraints for certain rare earth and specialty elements (notably concentrated in parts of Asia), and tariff exposure on semiconductor-related inputs that can flow into module pricing. Yield management and metrology capability at the nano-fabrication stage remain central to cost control, while compliance readiness (including alignment with IEEE and IEC standards used in procurement) and application-specific certification pathways (medical and nuclear use cases) shape time-to-market and vendor qualification cycles.
Competitive Landscape
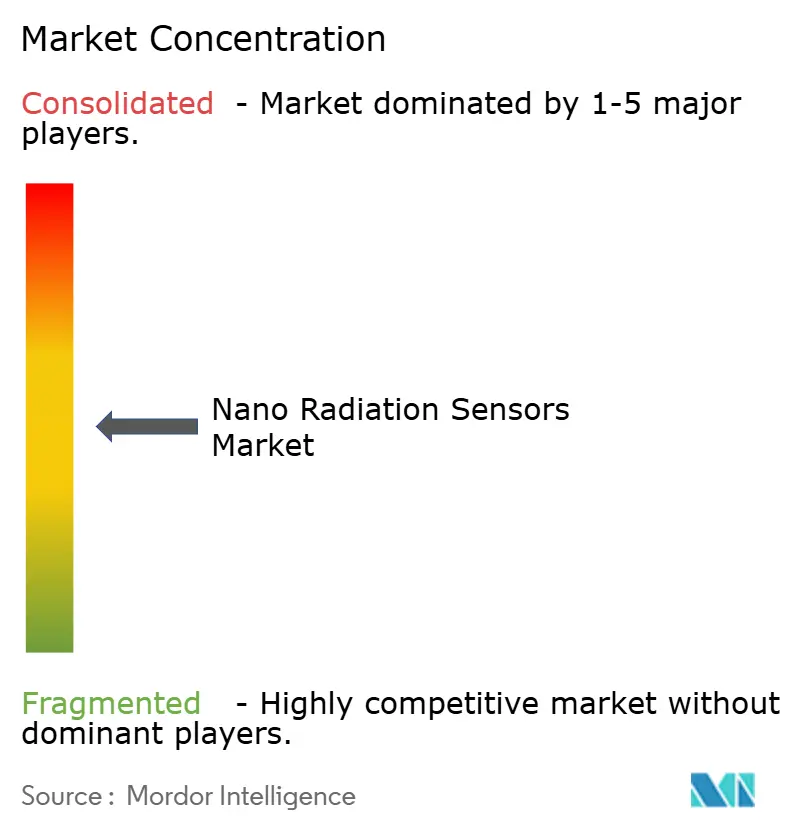
The market features moderate fragmentation. Mirion Technologies, Thermo Fisher Scientific, and Analog Devices leverage vertical integration spanning crystal growth through calibration labs, defending share with broad patent estates. Analog Devices anchors its edge in mixed-signal processing, bundling radiation-hardened front ends with proprietary error-correction IP for military avionics. Thermo Fisher exploits economies of scope across analytical instrumentation to absorb variable demand shocks.
Emerging challengers focus on perovskite stability and flexible substrates. Several Chinese fab-light startups license production to contract manufacturers in Jiangsu, shrinking time-to-market for consumer modules. Bosch’s quantum-sensing joint venture with Element Six extends its automotive portfolio into ultra-precise magnetic and radiation detection by exploiting synthetic diamonds’ defect-center properties. Consolidation continues: Curtiss-Wright’s USD 200 million buyout of Ultra Energy and Teledyne’s USD 710 million Excelitas carve-out add neutron and gamma monitoring portfolios to broader aerospace offerings.
White-space opportunities lie in implantable medical devices where detectors must function reliably at body temperature for 10-year lifespans, and in battery-powered IoT nodes that cap draw under 10 µW. Firms resolving perovskite encapsulation at these operating points could displace incumbent silicon by the decade’s end, reshaping the nano radiation sensors industry. [4]Curtiss-Wright Corporation, “Acquisition of Ultra Energy,” curtisswright.com
Nano Radiation Sensors Industry Leaders
Analog Devices Inc.
Thermo Fisher Scientific Inc.
Hamamatsu Photonics KK
Robert Bosch GmbH
Mirion Technologies Inc.
- *Disclaimer: Major Players sorted in no particular order
Nano Radiation Sensors Market Companies Covered in this Report
- Analog Devices Inc.
- Robert Bosch GmbH
- Nihon Kessho Kogaku Co. Ltd.
- Thermo Fisher Scientific Inc.
- Baker Hughes Co.
- Honeywell International Inc. (RAE Systems)
- First Sensor AG (TE Connectivity)
- Hamamatsu Photonics KK
- Toshiba Corporation
- Mirion Technologies Inc.
- Fortive Corporation
- PerkinElmer Inc. (Revvity)
- Radiation Monitoring Devices Inc.
- Texas Instruments Inc.
- Lockheed Martin Corp.
- OMRON Corporation
- Space Micro Inc.
- Analogic Corporation
- Canon Medical Systems Corp.
- Siemens Healthineers AG
- GE Healthcare Technologies Inc.
- BAE Systems plc
- Hitachi Ltd.
- STMicroelectronics N.V.

Market Opportunities and Future Outlook
Opportunities are expanding where ultra-low size, weight, and power (SWaP) sensors enable measurement points that legacy dosimeters and bulk detectors do not serve well, especially in distributed monitoring and wearables. The clearest whitespace clusters around (i) continuous, networked monitoring for nuclear decommissioning and plant safety programs that increasingly specify distributed sensor arrays, (ii) clinical and occupational dosimetry that requires higher spatial resolution and real-time logging, and (iii) space and small-satellite payloads where radiation-hardened miniaturization is valued.
Technology evidence points to several routes for differentiation that translate into new form factors and use cases. In September 2024, Nature Photonics reported real-time detection of 3H and 85Kr radioactive gas mixtures using nanoporous aerogels, which supports a pathway toward compact fieldable monitors for hard-to-detect radionuclides. In 2026, published work included a micro-ring-resonator photonic bolometric concept for space radiation (Scientific Reports, March 2026) and a miniaturized, scalable scintillation-based particle-detection platform (NanoArduSiPM, May 2026), both reinforcing interest in modular, low-footprint architectures that can be reused across healthcare, industrial, and space deployments. Wide-bandgap and nanomaterial approaches, such as GaN homojunction beta detection and ultralow-power nanomaterial X-ray sensing reported in technical literature, further widen room for sensors that combine radiation tolerance, low power draw, and smaller footprints for embedded and battery-powered nodes.
Recent Industry Developments in Nano Radiation Sensors Market
- July 2026: NRC advanced a proposed rulemaking to reform and modernize the radiation protection framework, including elements tied to ALARA. This regulatory action raises the compliance bar for instruments used in regulated nuclear activities and can reshape qualification and documentation expectations for networked radiation monitoring deployments.
- April 2025: Thermo Fisher Scientific announced a USD 2 billion US manufacturing and R&D plan spanning 64 facilities. The move strengthens domestic capacity and supply assurance for radiation detection and related analytical instrumentation, supporting shorter lead times for healthcare, industrial, and government customers.
- April 2025: Robert Bosch formed Bosch Quantum Sensing with Element Six to commercialize diamond-based sensors. The joint venture expands Bosch's pathway into high-precision sensing modalities relevant to harsh-environment and safety-oriented applications, adding competitive pressure on incumbent detection technologies.


Nano Radiation Sensors Market Report Scope and Research Methodology
Market Definition and Coverage
For this study, the nano radiation sensors market covers revenues generated from nanoscale or nano-enabled sensor devices and modules that detect ionizing radiation and are sold into end-use applications worldwide.
Scope exclusions: It excludes broader radiation safety services, non-nano conventional detectors, and downstream imaging systems where the sensor is not the primary sold component.
Segments Covered in This Report
- By Type
- Scintillation Detectors
- Solid-state Detectors
- By Material
- Silicon-based Semiconductors
- Inorganic Crystals (GAGG, LSO, CsI)
- Perovskite Semiconductors (Lead and Lead-free)
- Organic / Polymer Scintillators
- By Application
- Automotive
- Consumer Electronics
- Healthcare
- Industrial
- Oil and Gas
- Power Generation
- Other Applications
- By Technology
- Direct-conversion (Photon-counting)
- Indirect Scintillation-CMOS
- Flexible / Wearable Panels
- Radiation-hardened SoC and SiPM
- By Detection Radiation Type
- Alpha
- Beta
- Gamma / X-ray
- Neutron
- By Form Factor
- Chip-scale
- Module
- Panel
- Wearable Patch
- By Geography
- North America
- United States
- Canada
- Mexico
- South America
- Brazil
- Argentina
- Rest of South America
- Europe
- United Kingdom
- Germany
- France
- Italy
- Russia
- Spain
- Rest of Europe
- Asia-Pacific
- China
- Japan
- India
- South Korea
- Rest of Asia-Pacific
- Middle East and Africa
- Middle East
- United Arab Emirates
- Saudi Arabia
- Turkey
- Rest of Middle East
- Africa
- South Africa
- Egypt
- Rest of Africa
- Middle East
- North America
Data Sources, Market Sizing, and Validation
Desk Research
Desk research was used to set the technical and demand context first, then to anchor model inputs to real-world activity. We reviewed public sources such as IAEA publications on nuclear activity, US NRC and EURATOM materials on safety and monitoring requirements, WHO and OECD health statistics linked to imaging volumes, and UN Comtrade trade data for relevant electronics and instrument categories.
Alongside those, we used company annual reports, investor decks, conference proceedings, and reputable press coverage to understand product positioning and pricing logic. Where helpful, paid subscription databases for company financials and patent data were referenced to screen active participants and track technology directions, for example direct conversion and scintillation-coupled designs. The sources listed above are illustrative only, and many other public references were used for data collection, cross-checking, and clarification.
Primary Interviews and Surveys
Primary work focused on validating what counts as nano radiation sensing in commercial terms, and how demand differs by end use, such as healthcare dosimetry, industrial monitoring, energy and nuclear, and defense-related needs. We spoke with product, engineering, and commercial leaders across the value chain, and respondent input was used to confirm adoption rates, typical form factors (chip-scale, modules, and wearables), and practical price ranges by performance tier.
Coverage was balanced across major consuming regions so that the final assumptions, including currency conversion timing and procurement cycles, could be checked against on-the-ground buying behavior.
Distribution of primary research fieldwork respondents
| Company type | Respondent position | Region |
|---|---|---|
| Top tier: 35% | CXOs: 13% | APAC: 41% |
| Mid tier: 51% | Functional/Unit leaders: 28% | EMEA: 33% |
| Smaller Players: 14% | Managers: 59% | Americas: 26% |
Market-Sizing & Forecasting
Sizing starts with a top-down build that reconstructs the addressable demand pool from end-use activity and deployment intensity, then translates it into sensor value using realistic attach rates and price bands. In practice, indicators such as nuclear plant operating and decommissioning activity, medical imaging and dosimetry usage, industrial radiography and inspection needs, and adoption of miniaturized sensing in electronics programs were used as inputs (illustrative, not exhaustive).
Those totals were then checked through selective bottom-up approximations, such as a roll-up of sample supplier revenues, channel checks on average selling prices by detector type (solid-state and scintillation based), and unit-by-program estimates for a few large application clusters. When coverage gaps appeared for smaller suppliers or for emerging materials, for example perovskite and nanostructured semiconductors, the model used conservative penetration assumptions that were later re-tested in interviews.
For forecasting, we relied on scenario analysis supported by a small set of leading variables, including regulation-driven monitoring intensity, procurement cycles in energy and defense, and imaging procedure growth expectations. The final forecast curve is adjusted only after it is consistent with both the demand indicators and the bottom-up checks.
Data Validation & Update Cycle
Outputs were validated in multiple steps so that large jumps could be explained before sign-off. We triangulated totals using independent signals, such as end-use activity indicators and observed pricing ranges, then reviewed variance by region and by major application to make sure the pattern was plausible.
If an anomaly was found, assumptions were reworked and relevant experts were re-contacted to confirm what changed, such as a procurement delay or a shift in material choices. Reports are refreshed annually, with interim updates when material events occur, and a final pre-delivery review is completed so clients receive the latest updated view.
Mordor Intelligence's Global Nano Radiation Sensors Market Market Size Compared Against Other Published Estimates
Published numbers for nano radiation sensors can look far apart because each publisher makes different choices on what counts as a nano sensor, how applications are grouped, and which price points are used for modules versus full systems. Even the base year and currency timing can move the headline value, especially when the market is still developing and volumes are uneven across regions.
Some sources appear to include broader radiation detection equipment, or they rely on a narrow set of detector categories with limited cross-checks on adoption by end use. Mordor Intelligence counts only nano-enabled radiation sensor devices and modules, and it limits the totals by checking attach rates and ASP bands against application activity, so that adjacent systems and services are not quietly blended in.
Benchmark comparison
| Source | Market Size | Gaps in Research Methodology |
|---|---|---|
| Mordor Intelligence | USD 367.05 B (2025) | |
| Global Consultancy A | USD 0.28 B (2024) | This estimate appears to stay close to a narrow detector-type view and can understate value when modules and higher-performance formats are priced into the model, and its base year also differs from the current-year baseline. |
| Industry Publisher B | USD 2.80 B (2024) | The scope likely captures a wider set of radiation sensing products beyond nano-enabled sensors, which can inflate totals if conventional detectors or broader monitoring equipment are included alongside nano devices. |
The spread in the table mainly comes from scope and counting rules, followed by year alignment and pricing assumptions. By keeping the demand pool tied to measurable end-use activity and by separating sensors from surrounding equipment, the final number stays traceable to clear inputs and can be repeated when the market shifts.


Key Questions Answered in the Report
What is the current size of the nano radiation sensors market?
The nano radiation sensors market was valued at USD 382.13 billion in 2026.
How fast is the nano radiation sensors market expected to grow?
It is projected to expand at a 4.11% CAGR, reaching USD 466.94 billion by 2031.
Which region is growing fastest in nano radiation sensors adoption?
APAC leads with a 5.73% CAGR, driven by consumer electronics integration and new nuclear builds.
What application accounts for the largest revenue share today?
Healthcare holds the leading 29.12% share owing to precision dosage requirements in oncology.
Which technology segment is most dominant?
Direct-conversion photon-counting detectors command 41.35% of 2025 revenue for their superior energy resolution.
What are the main restraints hindering market expansion?
Yield losses in nanofabrication and long-term stability issues in perovskite materials are the primary constraints impacting near-term scalability.
Page last updated on:


 Your data is secure and never sold or shared.


