Phosphatic Fertilizer Market Size and Share
Market Overview
| Study Period | 2021 - 2031 |
|---|---|
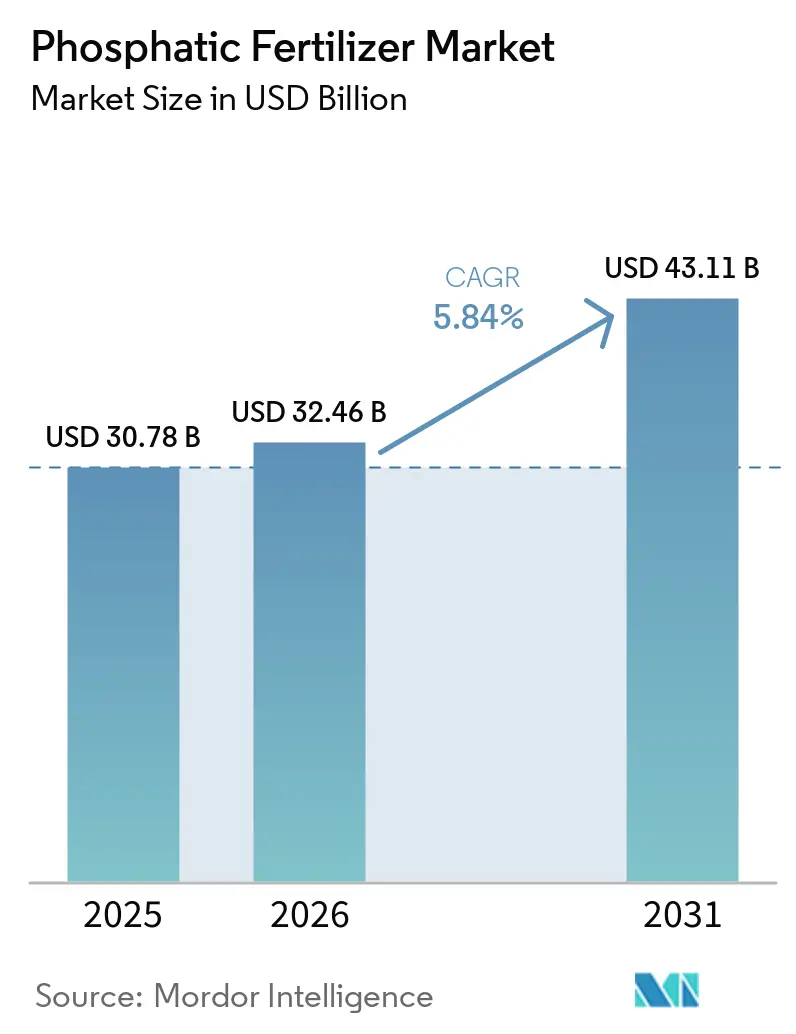
| Market Size (2026) | USD 32.46 Billion |
| Market Size (2031) | USD 43.11 Billion |
| Growth Rate (2026 - 2031) | 5.84% CAGR |
| Fastest Growing Market | Africa |
| Largest Market | Asia-Pacific |
| Market Concentration | Low |
Major Players*Disclaimer: Major Players sorted in no particular order Image © Mordor Intelligence. Reuse requires attribution under CC BY 4.0. | |
Phosphatic Fertilizer Market Analysis by Mordor Intelligence
The phosphatic fertilizer market size is projected to grow from USD 30.78 billion in 2025 to USD 32.46 billion in 2026 and is forecast to reach USD 43.11 billion by 2031 at 5.8% CAGR over 2026-2031. The steady expansion of the phosphatic fertilizer market reflects intensifying food security pressures at a time when arable land per person is shrinking, and protein consumption is rising across emerging economies. Farmers are responding by favoring high-analysis grades such as diammonium phosphate (DAP) and monoammonium phosphate (MAP) that deliver more phosphorus per logistics dollar, while policymakers shift subsidy schemes toward balanced nutrient strategies that reward phosphorus-use efficiency. Regulatory realignments, including the European Union’s cadmium limits and India’s Direct Benefit Transfer (DBT) program, further reinforce demand for low-contaminant formulations and precision application technologies. Meanwhile, investments in controlled-release coatings, site-specific delivery systems, and biotechnology alliances position innovative suppliers to capture premium niches as the phosphatic fertilizer market evolves toward value-based purchasing.
Key Report Takeaways
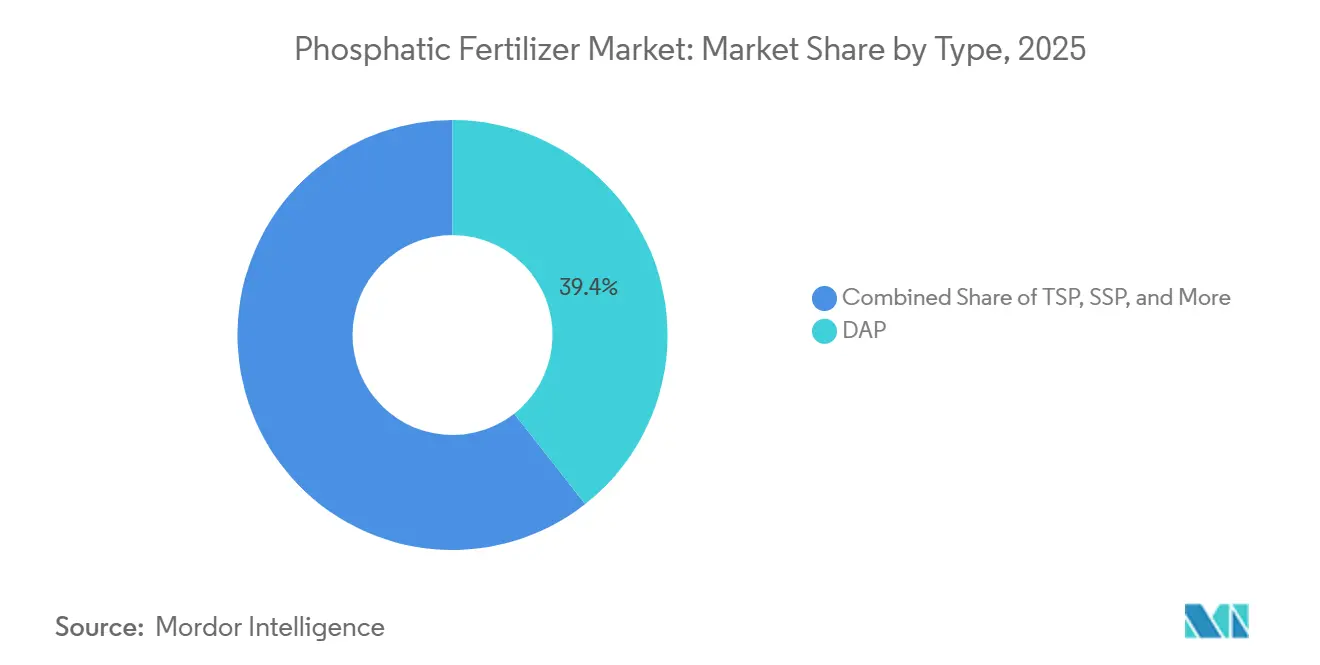
- By type, diammonium phosphate (DAP) accounted for the largest phosphatic fertilizer market share of 39.4% in 2025, while triple superphosphate (TSP) is projected to be the fastest-growing segment, advancing at a CAGR of 8.2% from 2026 to 2031.
- By application mode, soil application represented the largest phosphatic fertilizer market size in 2025 with an 88.5% share, whereas fertigation is forecast to register the highest growth rate at a CAGR of 8.6% through 2031.
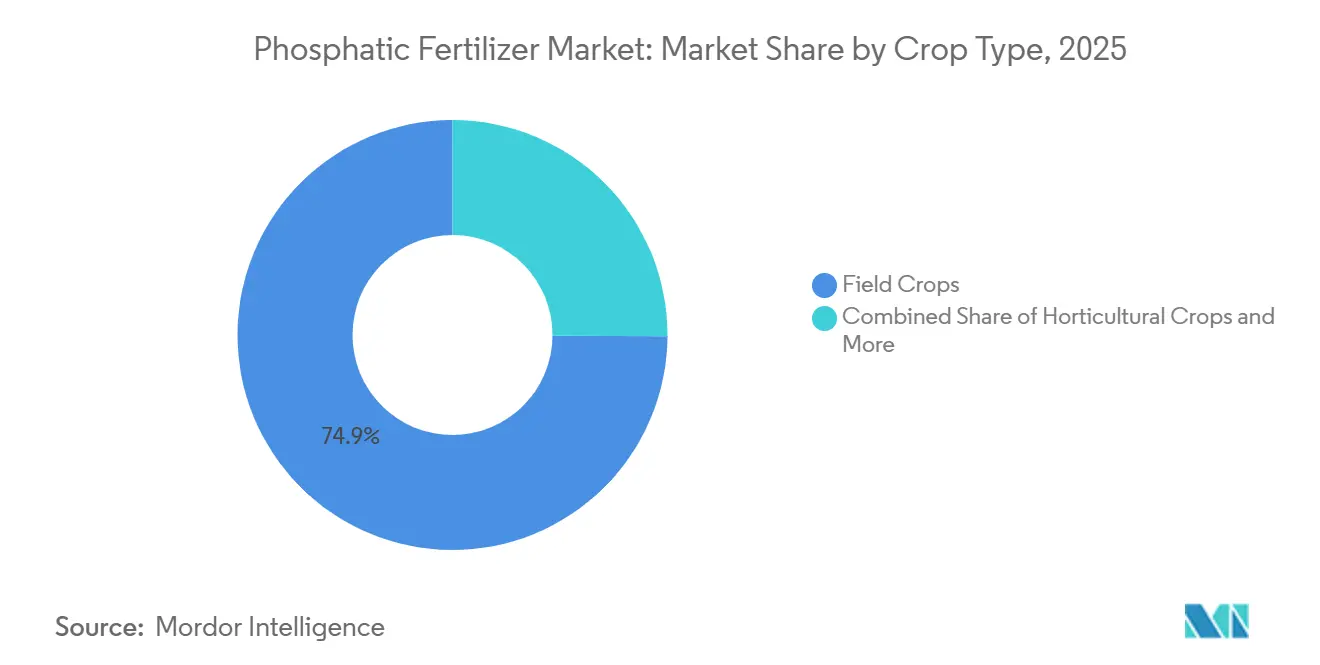
- By crop type, field crops captured 74.9% of the market in 2025, while horticultural crops are projected to be the fastest-growing segment, expanding at a CAGR of 7.4% from 2026 to 2031.
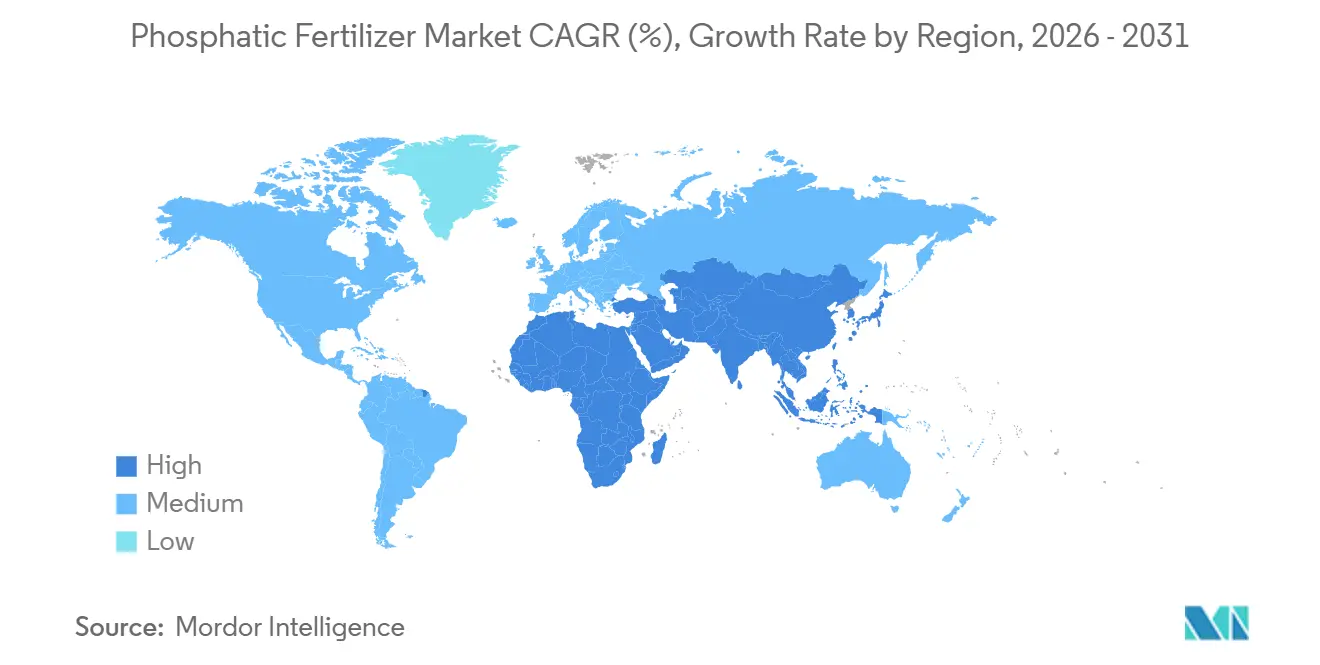
- By geography, Asia-Pacific accounted for 46.5% of the market in 2025, whereas Africa is projected to be the fastest-growing regional market, advancing at a CAGR of 7.4% from 2026 to 2031.
Note: Market size and forecast figures in this report are generated using Mordor Intelligence’s proprietary estimation framework, updated with the latest available data and insights as of 2026.
Global Phosphatic Fertilizer Market Trends and Insights
Drivers Impact Analysis*
| Driver | (~) % Impact on CAGR Forecast | Geographic Relevance | Impact Timeline |
|---|---|---|---|
| Surge in high-analysis fertilizer (DAP/MAP) adoption | +1.2% | Global, strongest in Asia-Pacific and South America | Medium term (2-4 years) |
| Government subsidy realignment in Asia-Pacific | +1.8% | Asia-Pacific core, spill-over to Middle East and Africa | Short term (≤ 2 years) |
| Rising food-grade phosphate demand for specialty crops | +0.7% | North America and Europe, expanding to Asia-Pacific | Long term (≥ 4 years) |
| Precision farming enabling phosphorus use efficiency | +1.1% | North America and Europe, early adoption in Asia-Pacific | Medium term (2-4 years) |
| Controlled-release phosphate coatings adoption | +0.9% | Global, premium markets leading | Long term (≥ 4 years) |
| Low-cadmium African phosphate rock supply growth | +0.8% | Europe and North America, expanding globally | Medium term (2-4 years) |
| Source: Mordor Intelligence | |||


Surge in High-Analysis Fertilizer (DAP/MAP) Adoption
Transportation now accounts for up to 20% of delivered fertilizer cost in remote areas, pushing growers toward DAP and MAP that pack 1.7-to-2.0-times more P₂O₅ per ton than single superphosphate. Brazil’s soybean belt illustrates the shift as cooperatives consolidate storage around highly concentrated grades to reduce freight charges.[1]Source: International Fertilizer Association, “Global Fertilizer Supply and Transportation Costs,” fertilizer.org Rising diesel prices amplify logistics savings, while concentrated grades also reduce packaging waste —a benefit that aligns with tightening environmental regulations in many regions. Traders increasingly lock forward contracts for DAP to hedge against volatile freight markets, and distributors report double-digit drops in inventory carrying costs after pivoting to high-analysis products. Global producers with vertically integrated phosphate rock assets enjoy a cost advantage because they can switch product slates quickly to capture premium demand. As a result, the phosphatic fertilizer market registers stronger volume gains for DAP/MAP than total tonnage growth suggests, indicating an ongoing shift in composition rather than mere consumption expansion.
Government Subsidy Realignment in Asia-Pacific
India’s DBT program redirects USD 14.4 billion annually from product-specific subsidies to farmer-centric transfers, driving adoption of balanced NPK formulations that often include higher phosphorus shares. Chinese incentives under the 14th Five-Year Plan tie payments to phosphorus use efficiency targets, rewarding growers who deploy precision equipment and low-cadmium inputs.[2]Source: Ministry of Chemicals and Fertilizers, “DBT for Fertilizer Subsidies,” fert.nic.in These policies affect global flows because international suppliers must recalibrate capacity toward Asia-Pacific-preferred grades such as DAP and TSP. Short-term volume spikes follow each subsidy tranche, compelling importers to secure inventory earlier in the cycle. Longer term, premium products with controlled release or biological additives gain pricing power as farmers receive direct cash for sustainable practices rather than blanket price supports. For manufacturers, the Asia-Pacific policy overhaul magnifies revenue upside for technology-rich offerings, thereby accelerating R&D investment across the phosphatic fertilizer market.
Rising Food-Grade Phosphate Demand for Specialty Crops
Strong growth in organic produce, hydroponic vegetables, and legalized cannabis triggers demand for food-grade phosphates carrying stricter purity thresholds than commodity fertilizers. U.S. seed companies now bundle pharmaceutical-grade phosphorus treatments with high-value vegetable genetics, citing germination gains in enclosed systems.[3]Source: U.S. Food and Drug Administration, “Food-Grade Phosphate Standards,” fda.gov Hydroponic growers accept premiums of three to four times bulk fertilizer pricing to avoid trace contaminants that can circulate indefinitely in closed-loop setups. European berry producers, targeting residue-free certification, likewise shift toward low-cadmium TSP sourced from African deposits. These trends carve out a premium tier within the phosphatic fertilizer market where volume may stay modest but margins are three to five percentage points higher. Suppliers with integrated beneficiation and quality-assurance capabilities achieve first-mover advantage, while mid-sized blenders partner with specialty distributors to reach greenhouse and vertical-farm clients.
Precision Farming Enabling Phosphorus Use Efficiency
Adoption of GPS-guided spreaders and variable-rate technology permits phosphorus placement within 2.5 centimeters of target rows, trimming wastage by 15-25% and lowering unit costs despite higher per-ton product prices. Soil sensor networks feed real-time indices into agronomic software that automatically adjusts P rates on the go, a shift that favors uniform-granule or liquid phosphate formulations tailored for machine flowability. The efficiency gains resonate in North America, where regulatory scrutiny over runoff intensifies, and in Europe, where nutrient budgets cap allowable applications. Equipment manufacturers bundle cloud analytics with lease packages, easing adoption barriers for mid-sized farms. Continuous data streams also create feedback loops that guide seed variety selection and irrigation scheduling, embedding phosphorus decisions within a broader digital agronomy stack. Consequently, the phosphatic fertilizer market pivots toward services wrapped around the product rather than pure tonnage throughput.
Restraints Impact Analysis*
| Restraint | (~) % Impact on CAGR Forecast | Geographic Relevance | Impact Timeline |
|---|---|---|---|
| Phosphate rock price volatility | -1.4% | Global, strongest in import-dependent regions | Short term (≤ 2 years) |
| Stringent European Union cadmium limits increasing costs | -0.8% | Europe primary, global supply chain effects | Medium term (2-4 years) |
| Shift toward biofertilizers and P-solubilizing microbes | -0.6% | Global, fastest adoption in organic segments | Long term (≥ 4 years) |
| Eutrophication-driven application caps in North America and European Union | -0.7% | North America and Europe, expanding elsewhere | Medium term (2-4 years) |
| Source: Mordor Intelligence | |||
Phosphate Rock Price Volatility
Export restrictions from Morocco and China—the two nations controlling the bulk of globally traded phosphate rock triggered 40-60% quarter-on-quarter price swings during 2024. Morocco’s OCP Group dominates 75% of known reserves and uses discretionary shipment pacing to balance its internal upgrade pipeline, while China imposes quotas to shield domestic food-security priorities. Import-dependent regions such as Brazil and India experience landing-cost spikes that compress farm profits and prompt last-minute demand deferrals. Futures markets for phosphate rock remain thin, leaving processors exposed to spot volatility and short-cycle credit risks. Manufacturers hedge by diversifying sources, yet logistics bottlenecks and ore-quality differentials limit substitution flexibility. The resulting uncertainty undermines forward contracting, constrains inventory financing, and subtracts 1.4 percentage points from the phosphatic fertilizer market CAGR in the immediate term.
Stringent European Union Cadmium Limits Increasing Costs
Regulation 2019/1009 mandates a cadmium ceiling of 60 mg kg⁻¹ P₂O₅ by 2026, compelling suppliers either to procure naturally low-cadmium ore or install purification circuits that add USD 54–86 per metric ton to production costs. The rule applies to all products placed on the European Union market, effectively extending its reach to global production facilities of multinational firms. Compliance spending crowds out other capital projects and tightens short-term supply, fostering a premium tier for certified low-cadmium fertilizers. Small European blenders unable to secure compliant feedstock face exit or consolidation. Over time, cost pass-through raises farm-gate fertilizer prices, which may dampen demand growth in price-sensitive segments. The structural burden clips approximately 0.8 percentage points from the phosphatic fertilizer market CAGR over the medium term.
*Our forecasts treat driver/restraint impacts as directional, not additive. The impact forecasts reflect baseline growth, mix effects, and variable interactions.
Segment Analysis
By Type: DAP Anchors Demand While TSP Records the Fastest Growth
DAP (Diammonium Phosphate) held the largest share of the phosphatic fertilizer market, accounting for 39.4% in 2025. This dominance is attributed to its balanced nitrogen-phosphorus composition, broad applicability across various crops, and a well-established distribution network in major agricultural markets. DAP is extensively used in cereals, oilseeds, and commercial crops due to its high nutrient concentration and cost-effective nutrient delivery. Additionally, monoammonium phosphate and other phosphate-based products continue to drive demand, particularly in intensive farming systems where efficient phosphorus management is essential for crop establishment and yield optimization.
Triple superphosphate (TSP) is projected to be the fastest-growing segment, with a projected CAGR of 8.2% during 2026-2031. This growth is driven by its high phosphorus concentration, compatibility with precision nutrient management programs, and increasing adoption in regions with phosphorus-deficient soils. As environmental regulations become stricter, TSP is gaining popularity due to its suitability for enhanced-efficiency fertilizer formulations and applications in specialty crops. Furthermore, emerging products such as ammonium polyphosphate solutions, micronutrient-fortified phosphates, and coated phosphate fertilizers are broadening the range of phosphorus delivery options available to growers. Over the forecast period, manufacturers are projected to focus on high-analysis and value-added phosphate products, promoting market growth through improved nutrient-use efficiency, reduced application intensity, and enhanced crop productivity.


By Application Mode: Soil Placement Retains Scale, and Fertigation Gains Speed
Soil application accounts for the largest share of the phosphatic fertilizer market, representing 88.5% in 2025. This dominance is attributed to its simplicity, cost-effectiveness, and compatibility with existing farm equipment across major agricultural regions. The method remains the preferred choice for field crops, facilitating efficient phosphorus placement and widespread adoption in both developed and developing markets. Suppliers are meeting demand by offering customized nutrient programs and agronomic advisory services to optimize phosphorus use efficiency and enhance crop performance.
Fertigation is projected to be the fastest-growing application mode, with a projected CAGR of 8.6% during 2026-2031. This growth is driven by the increasing adoption of drip irrigation systems, the need for improved water-use efficiency, and the rising cultivation of high-value crops. Fertigation delivers nutrients precisely to the root zone, enhancing nutrient uptake and minimizing fertilizer losses. As precision agriculture and protected cultivation practices expand globally, fertigation is likely to see greater adoption, particularly in water-scarce regions and intensive horticultural production systems, contributing to sustained growth in the phosphatic fertilizer market.
By Crop Type: Field Staples Dominate, and Propels Margins
Field crops accounted for the largest share of the phosphatic fertilizer market, representing 74.9% in 2025. This dominance is attributed to the extensive cultivation of cereals, oilseeds, and other staple crops that require consistent phosphorus application to sustain yields and maintain soil fertility. Strong demand from crops such as corn, wheat, rice, and soybeans continues to drive phosphorus consumption, particularly in major agricultural regions where maximizing productivity is a priority. Additionally, the ongoing adoption of precision nutrient management practices supports the use of higher-efficiency phosphate products in large-scale farming operations.
Horticultural crops are anticipated to be the fastest-growing segment, with a projected CAGR of 7.4% during 2026–2031. This growth is fueled by increasing consumption of fruits and vegetables, the expansion of protected cultivation, and rising demand for high-quality produce. Horticultural growers are increasingly using phosphorus-rich fertilizers to enhance root development, flowering, fruit formation, and overall crop quality. The growth of greenhouse farming, adoption of drip irrigation systems, and implementation of precision fertilization practices further bolster phosphate fertilizer demand in this segment, positioning horticulture as a significant growth driver for the phosphatic fertilizer market during the forecast period.
Geography Analysis
Asia-Pacific accounted for the largest phosphatic fertilizer market share, 46.5% in 2025, driven by strong demand from major agricultural economies such as China and India. Government-supported nutrient management programs, increasing adoption of balanced fertilization practices, and rising crop productivity requirements continue to support phosphate fertilizer consumption across the region. Southeast Asian countries also contribute significantly to demand as rice, palm oil, and horticultural producers increasingly adopt high-efficiency phosphorus products to improve yields and nutrient-use efficiency. As a result, Asia-Pacific remains the largest regional market for phosphatic fertilizers.
Africa is anticipated to be the fastest-growing regional market, with a projected CAGR of 7.4% during 2026–2031. This growth is driven by the expansion of commercial agriculture, increased investments in food security initiatives, higher fertilizer application rates, and the rising cultivation of cereals, horticultural crops, and export-oriented cash crops. The Middle East remains a significant contributor to regional demand, supported by ongoing investments in fertilizer production capacity, agricultural modernization programs, and irrigated farming systems, which are projected to bolster phosphatic fertilizer consumption across the region during the forecast period.
North America is projected to witness steady growth, supported by widespread adoption of precision agriculture technologies and continued demand from large-scale corn and soybean production systems. Europe is anticipated to expand at a comparatively moderate pace due to mature agricultural markets, stringent environmental regulations, and nutrient-use optimization initiatives. Meanwhile, South America continues to offer attractive growth opportunities, supported by expanding soybean, corn, and sugarcane cultivation, particularly in Brazil and Argentina, reinforcing long-term phosphatic fertilizer demand across the region.

Competitive Landscape
The phosphatic fertilizer market is markedly fragmented, with the top five producers, PhosAgro PJSC, Coromandel International Ltd., EuroChem Group, Indian Farmers Fertiliser Cooperative Limited, and Nutrien Ltd., collectively accounting for only a significant share of global revenue. PhosAgro leads with its fully integrated mine-to-fertilizer model that secures ore supply and controls processing costs. OCP leverages unmatched rock reserves but faces cadmium compliance upgrades for European sales, pushing investment toward beneficiation and downstream partnerships. Nutrien’s strategy revolves around distribution acquisitions, such as its 2025 Brazilian network purchase, coupled with precision-agriculture services to lock in market share closest to the farm gate.
Smaller regional players exploit localized logistics advantages and cater to crop-specific requirements, especially in APAC and Africa, where government relationships and tailored blends can trump scale. Technological differentiation constitutes the new battleground: since 2023, patent filings for controlled-release coatings and liquid phosphorus concentrates have soared 45%. Collaborations, exemplified by Mosaic and Yara’s joint venture on coated phosphates, aim to combine formulation science with distribution reach. ESG imperatives accelerate vertical integration into low-cadmium mining and renewable-powered processing, giving early movers an edge as sustainability metrics enter procurement criteria.
Price competition remains acute in commodity grades, yet premium tiers insulate margins for innovators. Digital agronomy add-ons, such as dosing algorithms and remote equipment calibration, further differentiate offerings and deepen customer retention. Over the next five years, consolidation among mid-tier producers is likely, driven by the capital burden of regulatory compliance and technology upgrades. Nonetheless, a long tail of specialized suppliers will persist, maintaining the phosphatic fertilizer market’s fragmented character.
Phosphatic Fertilizer Industry Leaders
Coromandel International Ltd.
EuroChem Group
Indian Farmers Fertiliser Cooperative Limited
Nutrien Ltd.
PhosAgro PJSC
- *Disclaimer: Major Players sorted in no particular order

Recent Industry Developments
- November 2024: Phosagro Group is set to invest USD 929.0 million in projects at Cherepovets and Volkhov. These initiatives aim to boost phosphate rock processing by nearly 400 thousand metric tons, enhancing the company's production capacity for phosphatic fertilizers and propelling market growth.
- June 2024: Phospholutions has chosen WeGrow AG as its launch partner for the global expansion of RhizoSorb, targeting Central and South America.
- April 2024: Deepak Fertilizers and Haifa Group have forged a strategic alliance, marking Haifa's expanded footprint in India. This partnership aims to drive innovation and champion sustainable practices including the realm of phosphate fertilizers for Indian agriculture.


Global Phosphatic Fertilizer Market Report Scope
Straight are covered as segments by Type. Fertigation, Foliar, and Soil are covered as segments by Application Mode. Field Crops, Horticultural Crops, Turf & Ornamental are covered as segments by Crop Type. Asia-Pacific, Europe, the Middle East, Africa, North America, and South America are covered as segments by Region.
| Straight | Phosphatic | DAP |
| MAP | ||
| SSP | ||
| TSP | ||
| Others |
| Fertigation |
| Foliar |
| Soil |
| Field Crops |
| Horticultural Crops |
| Turf & Ornamental |
| Asia-Pacific | Australia |
| Bangladesh | |
| China | |
| India | |
| Indonesia | |
| Japan | |
| Pakistan | |
| Philippines | |
| Thailand | |
| Vietnam | |
| Rest of Asia-Pacific | |
| Europe | France |
| Germany | |
| Italy | |
| Netherlands | |
| Russia | |
| Spain | |
| Ukraine | |
| United Kingdom | |
| Rest of Europe | |
| North America | Canada |
| Mexico | |
| United States | |
| Rest of North America | |
| South America | Argentina |
| Brazil | |
| Rest of South America | |
| Middle East | Saudi Arabia |
| Turkey | |
| United Arab Emirates | |
| Rest of Middle East | |
| Africa | Egypt |
| Nigeria | |
| South Africa | |
| Rest of Africa |
| Type | Straight | Phosphatic | DAP |
| MAP | |||
| SSP | |||
| TSP | |||
| Others | |||
| Application Mode | Fertigation | ||
| Foliar | |||
| Soil | |||
| Crop Type | Field Crops | ||
| Horticultural Crops | |||
| Turf & Ornamental | |||
| Geography | Asia-Pacific | Australia | |
| Bangladesh | |||
| China | |||
| India | |||
| Indonesia | |||
| Japan | |||
| Pakistan | |||
| Philippines | |||
| Thailand | |||
| Vietnam | |||
| Rest of Asia-Pacific | |||
| Europe | France | ||
| Germany | |||
| Italy | |||
| Netherlands | |||
| Russia | |||
| Spain | |||
| Ukraine | |||
| United Kingdom | |||
| Rest of Europe | |||
| North America | Canada | ||
| Mexico | |||
| United States | |||
| Rest of North America | |||
| South America | Argentina | ||
| Brazil | |||
| Rest of South America | |||
| Middle East | Saudi Arabia | ||
| Turkey | |||
| United Arab Emirates | |||
| Rest of Middle East | |||
| Africa | Egypt | ||
| Nigeria | |||
| South Africa | |||
| Rest of Africa | |||


Market Definition
- MARKET ESTIMATION LEVEL - Market Estimations for various types of fertilizers has been done at the product-level and not at the nutrient-level.
- NUTRIENT TYPES COVERED - All Phosphorus Fertilizers
- AVERAGE NUTRIENT APPLICATION RATE - This refers to the average volume of nutrient consumed per hectare of farmland in each country.
- CROP TYPES COVERED - Field Crops: Cereals, Pulses, Oilseeds, and Fiber Crops Horticulture: Fruits, Vegetables, Plantation Crops and Spices, Turf Grass and Ornamentals
| Keyword | Definition |
|---|---|
| Fertilizer | Chemical substance applied to crops to ensure nutritional requirements, available in various forms such as granules, powders, liquid, water soluble, etc. |
| Specialty Fertilizer | Used for enhanced efficiency and nutrient availability applied through soil, foliar, and fertigation. Includes CRF, SRF, liquid fertilizer, and water soluble fertilizers. |
| Controlled-Release Fertilizers (CRF) | Coated with materials such as polymer, polymer-sulfur, and other materials such as resins to ensure nutrient availability to the crop for its entire life cycle. |
| Slow-Release Fertilizers (SRF) | Coated with materials such as sulfur, neem, etc., to ensure nutrient availability to the crop for a longer period. |
| Foliar Fertilizers | Consist of both liquid and water soluble fertilizers applied through foliar application. |
| Water-Soluble Fertilizers | Available in various forms including liquid, powder, etc., used in foliar and fertigation mode of fertilizer application. |
| Fertigation | Fertilizers applied through different irrigation systems such as drip irrigation, micro irrigation, sprinkler irrigation, etc. |
| Anhydrous Ammonia | Used as fertilizer, directly injected into the soil, available in gaseous liquid form. |
| Single Super Phosphate (SSP) | Phosphorus fertilizer containing only phosphorus which has lesser than or equal to 35%. |
| Triple Super Phosphate (TSP) | Phosphorus fertilizer containing only phosphorus greater than 35%. |
| Enhanced Efficiency Fertilizers | Fertilizers coated or treated with additional layers of various ingredients to make it more efficient compared to other fertilizers. |
| Conventional Fertilizer | Fertilizers applied to crops through traditional methods including broadcasting, row placement, ploughing soil placement, etc. |
| Chelated Micronutrients | Micronutrient fertilizers coated with chelating agents such as EDTA, EDDHA, DTPA, HEDTA, etc. |
| Liquid Fertilizers | Available in liquid form, majorly used for application of fertilizers to crops through foliar and fertigation. |


Research Methodology
Mordor Intelligence follows a four-step methodology in all our reports.
- Step-1: IDENTIFY KEY VARIABLES: In order to build a robust forecasting methodology, the variables and factors identified in Step-1 are tested against available historical market numbers. Through an iterative process, the variables required for market forecast are set and the model is built on the basis of these variables.
- Step-2: Build a Market Model: Market-size estimations for the forecast years are in nominal terms. Inflation is not a part of the pricing, and the average selling price (ASP) is kept constant throughout the forecast period for each country.
- Step-3: Validate and Finalize: In this important step, all market numbers, variables and analyst calls are validated through an extensive network of primary research experts from the market studied. The respondents are selected across levels and functions to generate a holistic picture of the market studied.
- Step-4: Research Outputs: Syndicated Reports, Custom Consulting Assignments, Databases & Subscription Platforms


