Market Overview
| Study Period | 2020 - 2031 |
|---|---|
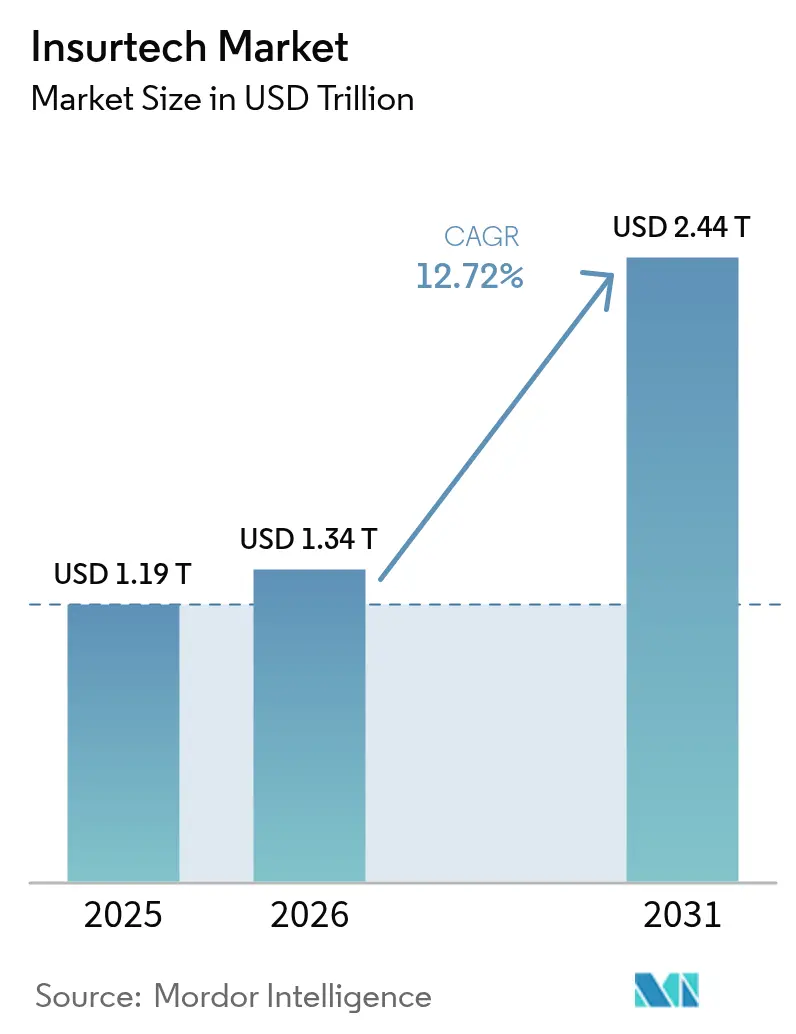
| Market Size (2026) | USD 1.34 Trillion |
| Market Size (2031) | USD 2.44 Trillion |
| Growth Rate (2026 - 2031) | 12.72% CAGR |
| Fastest Growing Market | Asia Pacific |
| Largest Market | North America |
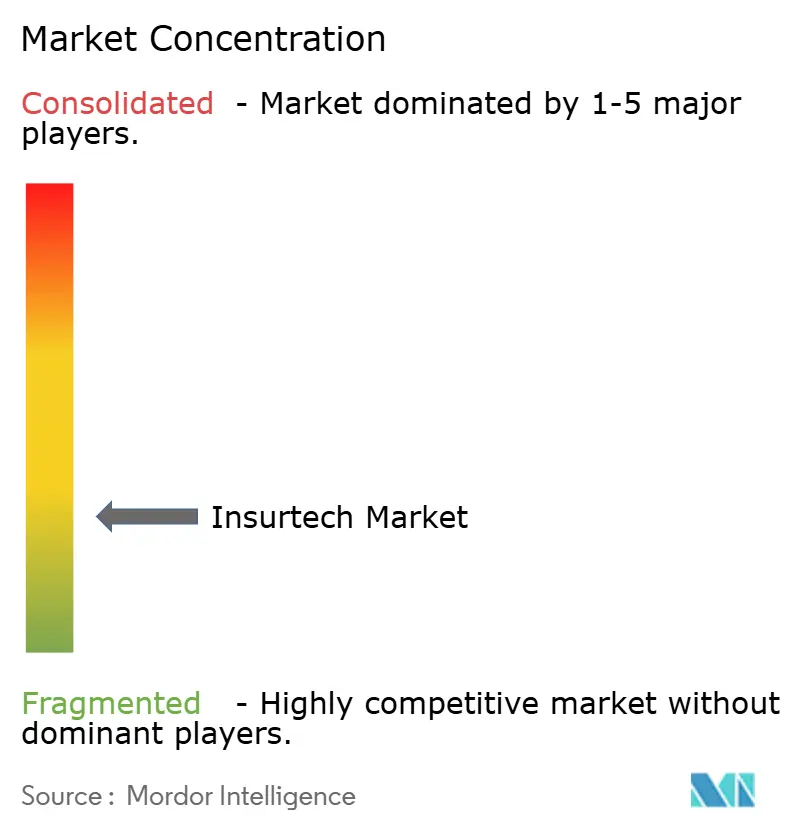
| Market Concentration | Low |
Major Players *Disclaimer: Major Players sorted in no particular order Image © Mordor Intelligence. Reuse requires attribution under CC BY 4.0. | |
Insurtech Market Analysis by Mordor Intelligence
The Insurtech Market size is expected to increase from USD 1.19 trillion in 2025 to USD 1.34 trillion in 2026 and reach USD 2.44 trillion by 2031, growing at a CAGR of 12.72% over 2026-2031.
The sharp growth reflects a structural change in how insurers design, distribute, and service policies as digital-first experiences become table stakes. Cloud-native migrations, AI-enabled underwriting, and embedded insurance have shifted from pilot initiatives to enterprise standards, allowing carriers to cut operating costs, improve speed-to-market, and reach new customer segments. Government sandboxes in more than a dozen jurisdictions have accelerated solution rollouts, while strategic partnerships with mobility and IoT platforms are redefining risk assessment in auto and property lines. Competitive differentiation now rests on data access, platform agility, and the ability to embed coverage seamlessly into non-insurance purchase journeys, rather than on balance-sheet scale alone.
Key Report Takeaways
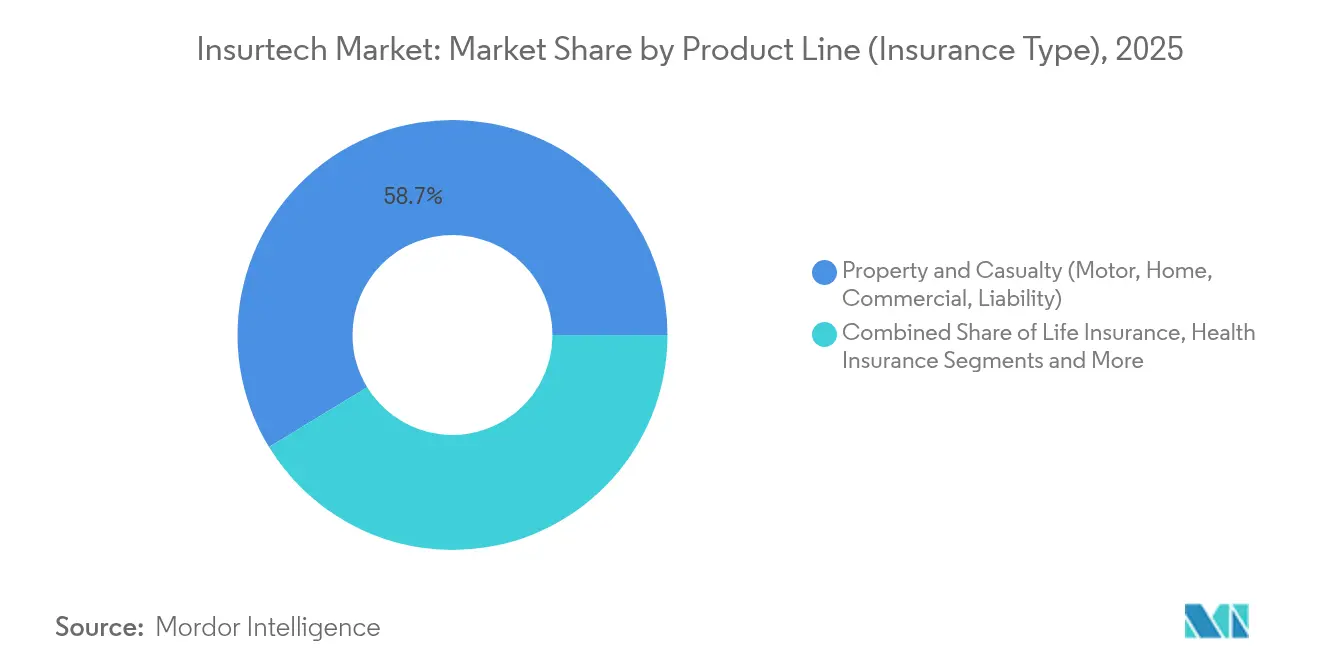
- By product line, Property & Casualty led with 58.73% of the insurtech market share in 2025, while Specialty Lines are projected to post the fastest 18.63% CAGR through 2031.
- By distribution channel, Traditional Agents/Brokers held 40.62% revenue share of the insurtech market in 2025, whereas Embedded Insurance Platforms are advancing at a 16.78% CAGR to 2031.
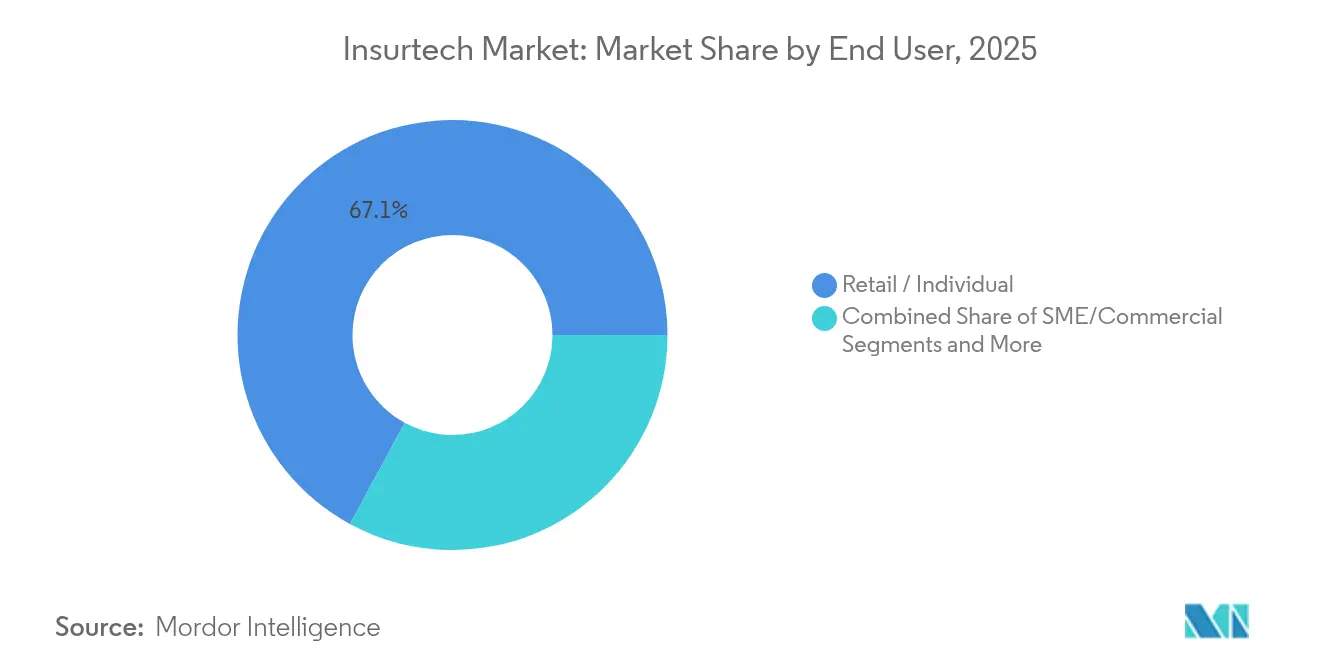
- By end user, Retail/Individual policies accounted for 67.08% of the demand of the insurtech market in 2025; the SME/Commercial segment is forecast to grow at 15.18% CAGR to 2031.
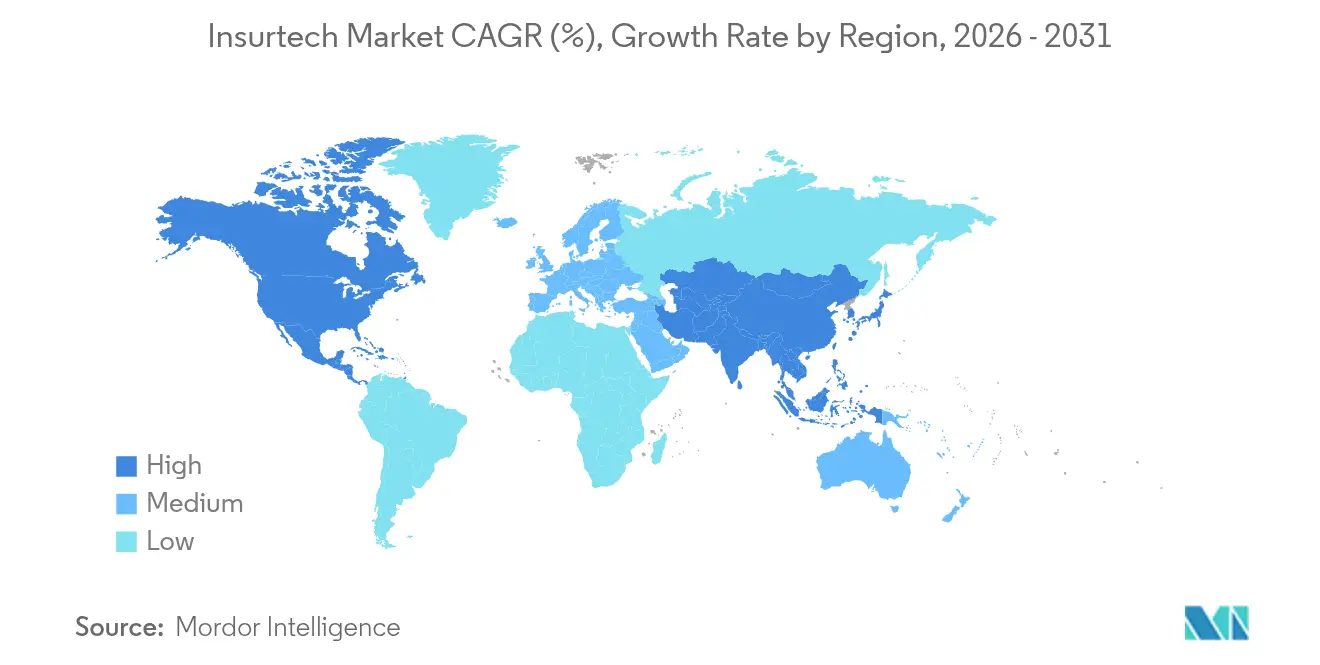
- By geography, North America commanded 37.25% of the insurtech market in 2025, yet Asia-Pacific is poised for the highest 16.25% CAGR between 2026-2031.
Note: Market size and forecast figures in this report are generated using Mordor Intelligence’s proprietary estimation framework, updated with the latest available data and insights as of 2026.
Global Insurtech Market Trends and Insights
Drivers Impact Analysis*
| Driver | (~) % Impact on CAGR Forecast | Geographic Relevance | Impact Timeline |
|---|---|---|---|
| Rising adoption of AI & ML for underwriting & claims | 3.2% | Global, with North America and Europe leading | Medium term (2-4 years) |
| Growing demand for personalized, on-demand insurance products | 2.8% | Global, particularly strong in APAC and North America | Short term (≤ 2 years) |
| Increasing migration to cloud-native core systems | 2.1% | Global, with Europe and North America at the forefront | Medium term (2-4 years) |
| Regulatory sandboxes accelerating product launches | 1.5% | Europe, Asia-Pacific, selective North American states | Short term (≤ 2 years) |
| Data partnerships with mobility & IoT platforms | 1.8% | Global, with Europe leading due to the regulatory framework | Long term (≥ 4 years) |
| Rapid growth of embedded distribution models | 2.4% | Global, with Asia-Pacific showing the highest adoption | Medium term (2-4 years) |
| Source: Mordor Intelligence | |||


Rising adoption of AI & ML for underwriting and claims
AI-driven decision engines now automate large portions of policy issuance and claims triage, shrinking average handling times and improving predictive accuracy. Swiss Re reported that shifting its claims analytics to Microsoft Azure enabled the majority of infrastructure automation, cutting assessment time in half. Insurers that master supervised learning on proprietary datasets gain defensible underwriting moats, pushing competitors to accelerate data-engineering roadmaps. The technology also unlocks new micro-duration products, such as usage-based mobility cover, because risk can be priced in real time. As regulators grow comfortable with explainable models, AI penetration is expected to rise fastest in personal auto, small commercial, and cyber lines. Vendor ecosystems offering pre-trained models on cloud marketplaces further lower adoption barriers.
Growing demand for personalized, on-demand insurance products
Consumers increasingly expect insurance to mimic e-commerce checkout flows, selecting coverage amounts and durations as easily as adding items to a cart. Allianz’s partnership with Cosmo Connected embeds accident coverage in connected helmets for a fixed monthly fee, illustrating how IoT data can trigger automatic policy activation without paperwork [1]Allianz SE, “Connected Vehicle Data and the Future of Auto Products,” allianz.com. Parametric products are likewise filling gaps in travel, agriculture, and climate risk because they pay when predefined triggers hit, sidestepping lengthy claims adjustment. Marketplaces that bundle ancillary value-added services, such as health coaching or cyber monitoring, see higher renewal rates because propositions resonate with everyday needs. This shift forces carriers to re-platform legacy policy administration so riders and limits can adjust dynamically, moving away from static annual contracts.
Increasing migration to cloud-native core systems
Core-system modernisation has become an operational imperative as CFOs target double-digit cost savings and CIOs pursue elastic compute to scale AI. Lincoln Financial Group completed a phased move of 120 on-premise systems to a multi-cloud architecture in under two years. Europe’s AXA Germany achieved 25% faster batch processing after finalising its cloud transition, proving that regulated entities can meet stringent data-residency rules while leveraging modern DevSecOps pipelines [2]AXA Deutschland, “Cloud-Native Conversion Milestones,” axa.de . Faster environment spin-up accelerates product launches, allowing teams to iterate coverage and pricing weekly instead of quarterly. Cloud adoption also facilitates cross-border rollouts because microservices can be reused in multiple jurisdictions without duplicating infrastructure. Over the forecast horizon, insurers without cloud-native cores risk uncompetitive expense ratios.
Regulatory sandboxes accelerating product launches
Insurance regulators are increasingly adopting sandbox regimes to spur innovation without compromising consumer protection. The UK Financial Conduct Authority’s sandbox admitted three new insurtechs in 2025, enabling limited-scope pilots under supervisory oversight. In the United States, Kentucky’s Insurance Innovation Sandbox provides time-boxed regulatory relief, attracting start-ups seeking nationwide expansion paths[3]Commonwealth of Kentucky, “House Bill 386 Insurance Innovation Sandbox,” kentucky.gov. Sandbox cohorts typically graduate to full licences faster because regulators familiarise themselves with product designs during trial phases. Successful frameworks encourage reciprocal agreements, allowing firms to transplant approved models across borders, thereby shortening market-entry timelines. As more jurisdictions formalise innovation pathways, regulatory risk becomes less of a bottleneck in scaling digitally native propositions.
Restraints Impact Analysis*
| Restraint | (~) % Impact on CAGR Forecast | Geographic Relevance | Impact Timeline |
|---|---|---|---|
| Legacy core-system integration complexity | -2.1% | Global, particularly acute in North America and Europe | Medium term (2-4 years) |
| Regulatory & compliance fragmentation | -1.8% | Global, with cross-border operations most affected | Long term (≥ 4 years) |
| Re-insurance capacity constraints for MGAs | -1.4% | North America and Europe, spreading to other regions | Short term (≤ 2 years) |
| Investor pivot from "growth at all costs" to profitability | -2.3% | Global, with venture capital markets most impacted | Short term (≤ 2 years) |
| Source: Mordor Intelligence | |||
Legacy core-system integration complexity
Decades-old mainframes often lack modern APIs, making real-time data exchange expensive and risky. Carriers, therefore, face a trade-off between wholesale replacement and piecemeal wrap-and-renew approaches. Failed conversions can stall policy issuance or claims payouts, eroding customer trust and drawing regulator scrutiny. Integration projects also carry hidden costs when data lineage and audit trails need preservation for compliance. As a result, some incumbents partner with greenfield entities instead of renovating core estates, slowing digital change within the mothership.
Regulatory and compliance fragmentation
Unlike banking, insurance lacks a global Basel-style accord, so capital, solvency, and distribution rules diverge widely. Companies expanding into multiple jurisdictions must customise policy wordings, disclosure formats, and complaint processes country-by-country, raising cost-to-serve. Data-localisation statutes further complicate multi-cloud deployments because customer records must reside within national borders. Small insurtechs often redirect resources from product development to regulatory counsel, diluting innovation velocity. Harmonisation progress remains slow, suggesting compliance drag will persist over the long term.
*Our forecasts treat driver/restraint impacts as directional, not additive. The impact forecasts reflect baseline growth, mix effects, and variable interactions.
Segment Analysis
By Product Line: Specialty Lines outpace mature P&C growth
Property & Casualty dominated revenue with a 58.73% insurtech market share in 2025, reflecting entrenched auto and homeowner demand foundations. Nonetheless, Specialty Lines, encompassing cyber, pet, marine, and travel, are forecast to expand at a 18.63% CAGR through 2031, delivering the fastest incremental premium. Embedded IoT sensors and parametric triggers allow Specialty products to circumvent traditional loss-adjustment delays, creating superior customer experiences that command higher margins. Carriers such as AXA XL have already debuted generative-AI cyber covers to address data-poisoning exposures arising from enterprise AI rollouts. As niche risks proliferate, Specialty innovators can capture outsized wallet-share increases, suggesting the insurtech market size for these lines will compound materially over the forecast window.
Property & Casualty incumbents, meanwhile, leverage telematics to reclaim pricing precision, yet their extensive legacy books create change-management headwinds. Life and Health insurers pilot accelerated underwriting on cloud platforms, but stricter mortality and morbidity regulations temper speed relative to non-regulated specialty covers. Reinsurers increasingly partner with cyber MGAs to collect proprietary claims datasets, improving portfolio modelling accuracy. Given the divergent growth curves, investors may shift capital allocations toward Specialty underwriters that demonstrate robust risk controls and scalable distribution frameworks.


By Distribution Channel: Embedded models challenge agent dominance
Traditional Agents/Brokers still commanded 40.62% of the 2025 premium, proving that relationship-based advice remains valued. However, embedded channels are set to post a 16.78% CAGR, positioning them as the structural growth engine of the insurtech market. E-commerce, airline ticketing, and ride-sharing apps now integrate one-click coverage, shrinking quote-to-bind times significantly as compared with manual processes. Digital brokers complement the movement by providing API bridges that surface multiple carrier quotes inside partner platforms, improving attachment rates without adding checkout friction. While direct-to-consumer portals gain traction in commoditised lines, they struggle in complex commercial risks where advisory depth matters, keeping agents relevant.
Aggregators and marketplaces exploit transparency regulation to encourage price competition, yet their commission-based economics invite disintermediation by carriers building native digital storefronts. Banks are reviving bancassurance via in-app offers tied to account-transaction triggers, broadening distribution without branch networks. For carriers, channel diversification mitigates concentration risk and captures incremental data at each customer touchpoint. The insurtech market size attributed to embedded sales is therefore projected to rise materially, even if absolute agent revenue continues to grow in lockstep with overall premium expansion.
By End User: SMEs emerge as digital adoption catalysts
Retail/Individual policyholders generated 67.08% of the 2025 premium, underscoring the outsized contribution of personal lines. Nonetheless, the SME/Commercial cohort is on course for a 15.18% CAGR because vertical SaaS integrations dramatically reduce acquisition costs for policies under USD 5,000 annual premium. Cloud accounting platforms and e-commerce suites embed general liability or shipping cover at invoice creation, moving insurance purchase from afterthought to workflow staple. For large enterprises, captive programmes and risk analytics platforms deliver self-insurance efficiencies but limit third-party premium growth, aligning carrier strategies toward mid-market niches.
SMEs historically lacked tailored products due to sparse loss data, yet IoT devices and open banking feeds now furnish underwriting signals that enable parametric and pay-as-you-use constructs. Embedded insurers partnering with point-of-sale vendors can secure daily micro-premiums, smoothing cash flow relative to lump-sum annual invoices. Government entities are also experimenting with digital procurement of infrastructure and crop-risk covers, creating public-sector proof points for insurtech market adoption. Over the forecast period, platforms able to aggregate fragmented SME demand are projected to capture an increasing insurtech market share by leveraging data-driven pricing.
Geography Analysis
North America retained 37.25% insurtech market share in 2025, benefiting from deep venture capital pools and established innovation hubs. State-level regulatory competition, exemplified by the Kentucky Insurance Innovation Sandbox, accelerates pilots that often expand nationwide after proof-of-concept results meet solvency criteria. US auto insurers remain early adopters of telematics, while Canadian carriers deploy cloud-native policy administration to overcome geographic service dispersion. M&A activity intensifies as incumbents buy capabilities; Munich Re’s USD 2.6 billion purchase of Next Insurance marked a notable 2025 expansion into US primary lines. Although market maturity constrains headline growth, North American carriers drive profit through operating expense reductions and cross-selling of ancillary cyber and identity-protection bundles.
Asia-Pacific, forecast to grow 16.25% annually to 2031, benefits from high smartphone penetration, government-backed fintech policies, and limited legacy system drag. China and India liberalised foreign ownership caps, encouraging global insurers to localise AI underwriting engines on hyperscale clouds with regional data centres. Singapore’s Monetary Authority operates a well-defined sandbox and grants digital composite licences that cover life, general, and health, accelerating regional scaling. Japanese carriers tackle longevity risk with AI-enabled annuity pricing, and South Korean platforms integrate usage-based mobility cover into ride-hailing super-apps. Lower insurance penetration leaves ample headroom for first-time buyers, so embedded micro-policies sold alongside e-commerce purchases drive volume even at modest ticket sizes.
Europe sustains steady single-digit growth anchored by GDPR-aligned data-governance frameworks, which give local insurtechs credibility on privacy. The forthcoming EU Data Act will mandate standardised vehicle data access, further catalysing telematics product innovation. The UK pursues post-Brexit regulatory agility, enabling faster product approvals while remaining Solvency II-equivalent for cross-border capital relief. Germany’s industrial base spurs demand for advanced commercial and cyber risk solutions, whereas France’s sizeable personal-lines market supports scale economics for behavioural-based pricing. As ESG disclosure rules tighten, European carriers innovate parametric climate-risk covers for agriculture and renewable-energy projects, creating exportable frameworks for other regions.
South America along with the Middle East & Africa remain nascent but promising. Mobile-money ecosystems in Brazil, Kenya, and Nigeria increasingly bundle micro-accident and hospital-cash products, leapfrogging traditional agency networks. Government-to-person payment platforms provide instant premium-collection rails, de-risking small-ticket offerings. Sovereign risk pools in the Caribbean and East Africa adopt parametric hurricane and drought solutions that trigger emergency funds within 24 hours, validating proof of concept for broader disaster markets. International development agencies often co-underwrite early portfolios, encouraging private carriers to enter once loss-frequency models mature.

Competitive Landscape
The current competitive landscape exhibits moderate fragmentation, with the top five players collectively accounting for a limited market share. This scenario presents substantial opportunities for differentiation and strategic positioning. Players cluster into three archetypes: incumbent carriers digitizing cores, born-digital full-stack insurers, and technology vendors selling SaaS modules. Incumbents leverage brand trust and balance-sheet heft but must modernize legacy estates to match the insurtech market’s agility. Born-digital firms prize rapid iteration and often specialize in a single line before broadening through multi-risk platforms. Technology vendors, including DXC Technology and Microsoft Azure partners, monetize migration toolkits and AI accelerators that enable carriers to leapfrog multi-year waterfall projects.
Strategic activity intensified in 2025 as reinsurers moved downstream to secure data access and underwriting talent; Munich Re’s integration of Next Insurance into ERGO illustrates the trend. Meanwhile, Zurich’s minority stake in European auto-insurance Ominimo demonstrates how incumbents hedge innovation risk through option-like investments that maintain future acquisition rights. Embedded-platform specialist Bolttech attained a USD 2.1 billion valuation after its Series C, signalling investor belief in orchestration layers that connect insurers and non-insurance brands. Despite funding pullbacks for early-stage ventures, scale-ups with positive loss ratios continue to attract capital, particularly when they expand into under-penetrated APAC or LATAM markets. Over time, competitive advantage will likely accrue to firms that combine proprietary data, modular tech stacks, and prudent re-insurance partnerships, positioning them to expand insurtech market share as consolidation gathers pace.
Insurtech Industry Leaders
Lemonade
Hippo Insurance
Root Insurance
Oscar Health
Bright Health
- *Disclaimer: Major Players sorted in no particular order

Recent Industry Developments
- July 2025: Munich Re acquired Next Insurance for USD 2.6 billion, marking a significant reinsurer move into US primary small-business cover.
- June 2025: Bolttech closed a USD 147 million Series C round at a USD 2.1 billion valuation to deepen embedded distribution partnerships.
- May 2025: INTX Insurance Software entered North America, signing Xitus Insurance as its first US client after a three-month core-system deployment.
- April 2025: Zurich Insurance Group invested in auto-insurance Ominimo, targeting Central European expansion via AI telematics.


Global Insurtech Market Report Scope
Insurtech is a technological service offered to the insurance industry to improve efficiency. A complete background analysis of the insurtech market, which includes market trends, an assessment of the emerging segments, significant changes in market dynamics, market insights, and a market overview, is covered in the report. The insurtech market is segmented by insurance line and geography. The insurance line is sub-segmented by health, life, automotive, home and property, travel insurance, and other insurance lines, and geography is sub-segmented by North America, Europe, South America, Asia-Pacific, Middle East & Africa. The report offers market size and forecasts for the insurtech market in value (USD) for all the above segments.
By Product Line (Insurance Type)
| Life Insurance |
| Health Insurance |
| Property & Casualty (P&C): Motor, Home, Commercial, Liability, etc. |
| Specialty Lines (e.g., cyber, pet, marine, travel) |
By Distribution Channel
| Direct-to-Consumer (D2C) Digital |
| Aggregators/Marketplaces |
| Digital Brokers/MGAs |
| Embedded Insurance Platforms |
| Traditional Agents/Brokers (digitally enabled) |
| Bancassurance (digitally enabled) |
| Other Channels |
By End User
| Retail/Individual |
| SME/Commercial |
| Large Enterprise/Corporate |
| Government/Public Sector |
By Geography (Value, USD Bn)
| North America | Canada |
| United States | |
| Mexico | |
| South America | Brazil |
| Peru | |
| Chile | |
| Argentina | |
| Rest of South America | |
| Europe | United Kingdom |
| Germany | |
| France | |
| Spain | |
| Italy | |
| BENELUX (Belgium, Netherlands, Luxembourg) | |
| NORDICS (Denmark, Finland, Iceland, Norway, Sweden) | |
| Rest of Europe | |
| Asia-Pacific | India |
| China | |
| Japan | |
| Australia | |
| South Korea | |
| South East Asia (Singapore, Malaysia, Thailand, Indonesia, Vietnam, and Philippines) | |
| Rest of Asia-Pacific | |
| Middle East & Africa | United Arab Emirates |
| Saudi Arabia | |
| South Africa | |
| Nigeria | |
| Rest of Middle East & Africa |
| By Product Line (Insurance Type) | Life Insurance | |
| Health Insurance | ||
| Property & Casualty (P&C): Motor, Home, Commercial, Liability, etc. | ||
| Specialty Lines (e.g., cyber, pet, marine, travel) | ||
| By Distribution Channel | Direct-to-Consumer (D2C) Digital | |
| Aggregators/Marketplaces | ||
| Digital Brokers/MGAs | ||
| Embedded Insurance Platforms | ||
| Traditional Agents/Brokers (digitally enabled) | ||
| Bancassurance (digitally enabled) | ||
| Other Channels | ||
| By End User | Retail/Individual | |
| SME/Commercial | ||
| Large Enterprise/Corporate | ||
| Government/Public Sector | ||
| By Geography (Value, USD Bn) | North America | Canada |
| United States | ||
| Mexico | ||
| South America | Brazil | |
| Peru | ||
| Chile | ||
| Argentina | ||
| Rest of South America | ||
| Europe | United Kingdom | |
| Germany | ||
| France | ||
| Spain | ||
| Italy | ||
| BENELUX (Belgium, Netherlands, Luxembourg) | ||
| NORDICS (Denmark, Finland, Iceland, Norway, Sweden) | ||
| Rest of Europe | ||
| Asia-Pacific | India | |
| China | ||
| Japan | ||
| Australia | ||
| South Korea | ||
| South East Asia (Singapore, Malaysia, Thailand, Indonesia, Vietnam, and Philippines) | ||
| Rest of Asia-Pacific | ||
| Middle East & Africa | United Arab Emirates | |
| Saudi Arabia | ||
| South Africa | ||
| Nigeria | ||
| Rest of Middle East & Africa | ||


Key Questions Answered in the Report
What is the current size of the insurtech market?
The Insurtech market stands at USD 1.34 trillion in 2026 and is forecast to reach USD 2.44 trillion by 2031 at a 12.72% CAGR.
Which product line is growing fastest within the Insurtech space?
Specialty Lines—including cyber, pet, marine, and travel—are projected to grow at a 18.63% CAGR, outpacing mature Property & Casualty offerings.
How significant is embedded insurance in upcoming distribution models?
Embedded platforms are expected to log a 16.78% CAGR through 2031, integrating coverage directly into e-commerce, travel, and SaaS workflows.
Why is Asia-Pacific viewed as the high-growth region for Insurtech?
APAC benefits from smartphone-first consumers, supportive fintech policies, and low existing insurance penetration, driving a 16.25% forecast CAGR.
What challenges do Insurtech's face when scaling internationally?
Fragmented regulatory regimes, legacy system integration, and fluctuating re-insurance capacity remain the main barriers to rapid cross-border expansion.
How fragmented is the competitive landscape?
Moderate fragmentation defines the current competitive scene; the largest five participants hold only a combined share, leaving ample whitespace for differentiation.
Page last updated on:


