Healthcare EDI Market Size and Share
Market Overview
| Study Period | 2020 - 2031 |
|---|---|
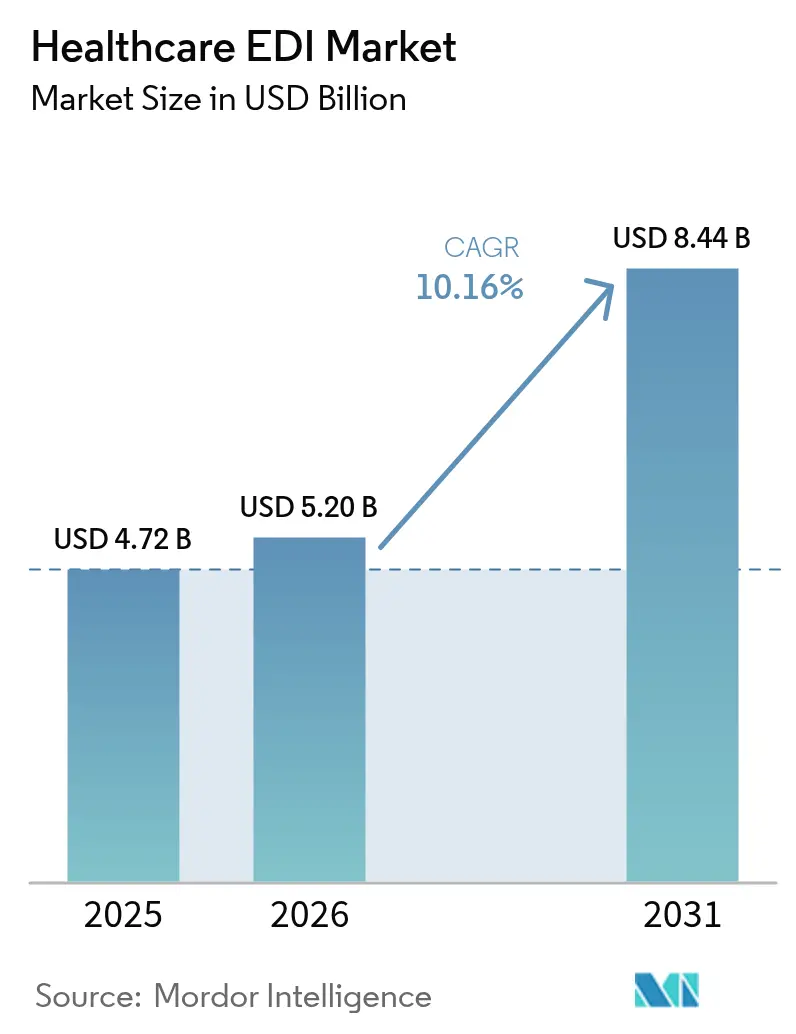
| Market Size (2026) | USD 5.2 Billion |
| Market Size (2031) | USD 8.44 Billion |
| Growth Rate (2026 - 2031) | 10.16% CAGR |
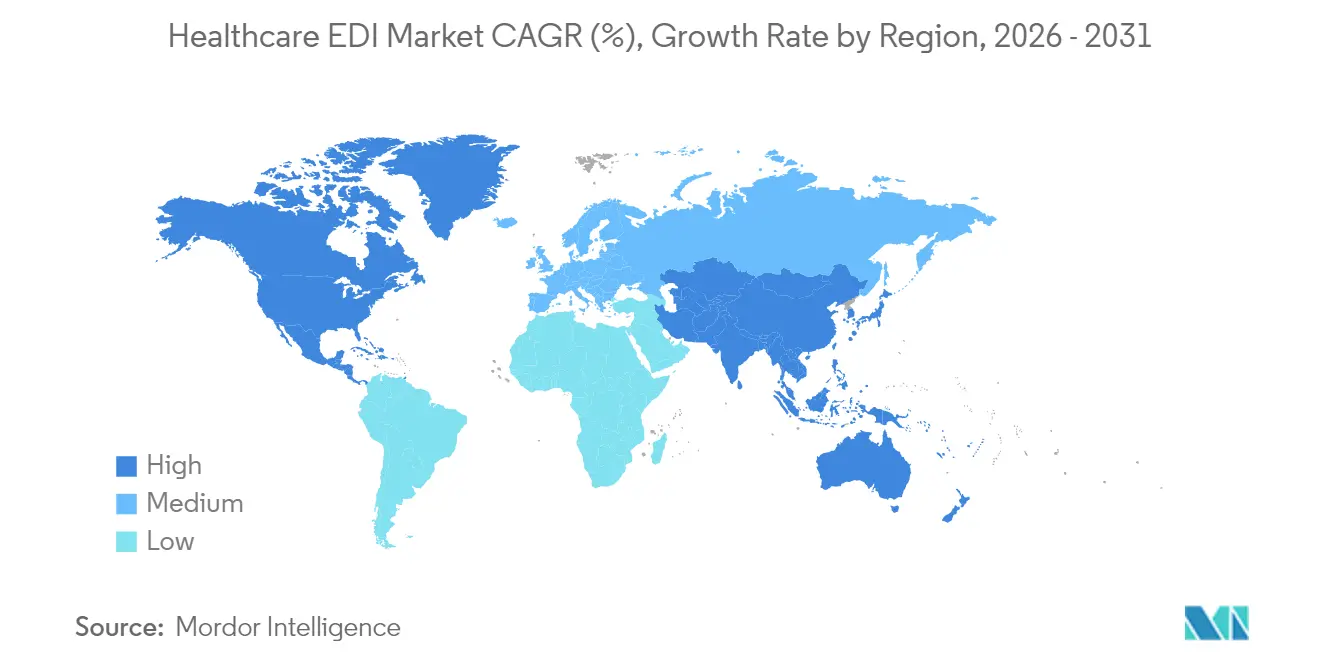
| Fastest Growing Market | Asia Pacific |
| Largest Market | North America |
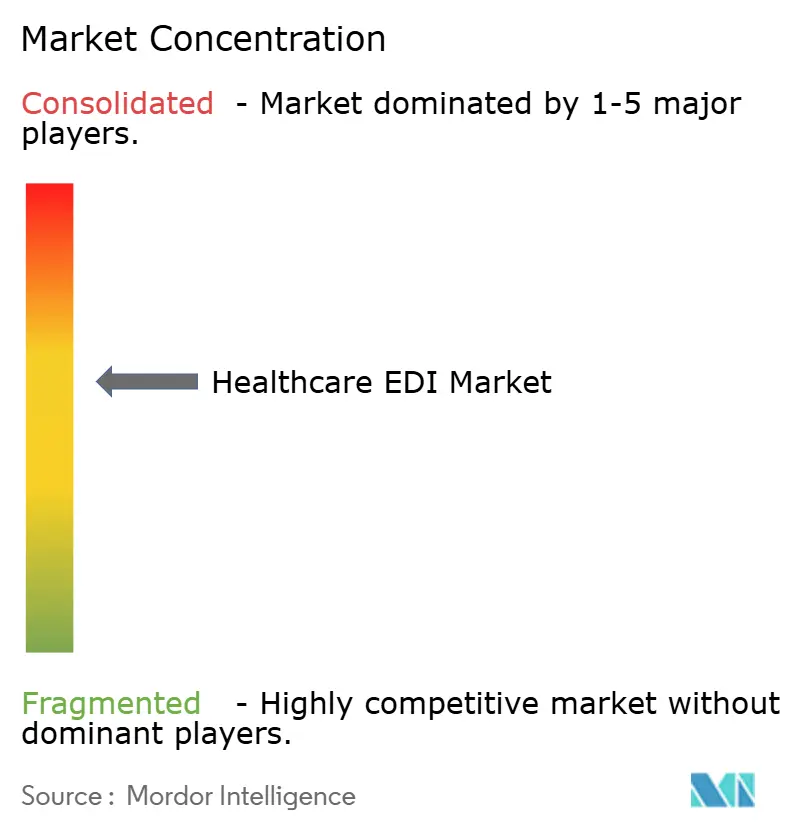
| Market Concentration | Medium |
Major Players *Disclaimer: Major Players sorted in no particular order Image © Mordor Intelligence. Reuse requires attribution under CC BY 4.0. | |
Healthcare EDI Market Analysis by Mordor Intelligence
The Healthcare EDI market size is expected to grow from USD 4.72 billion in 2025 to USD 5.2 billion in 2026 and is forecast to reach USD 8.44 billion by 2031 at 10.16% CAGR over 2026-2031. Growing digitization, cost-containment mandates, and stringent data-exchange regulations are reinforcing adoption across payers, providers, and life-science firms. Widespread cloud migration lowers implementation friction, while the accelerating shift to value-based care creates fresh demand for real-time, multi-party data flows. Heightened cybersecurity awareness following the 2025 Change Healthcare breach further elevates investment in secure, auditable transaction platforms. Vendors that combine interoperability, advanced analytics, and robust compliance tooling are capturing new white-space opportunities as healthcare entities retire fragmented, manual workflows.
Key Report Takeaways
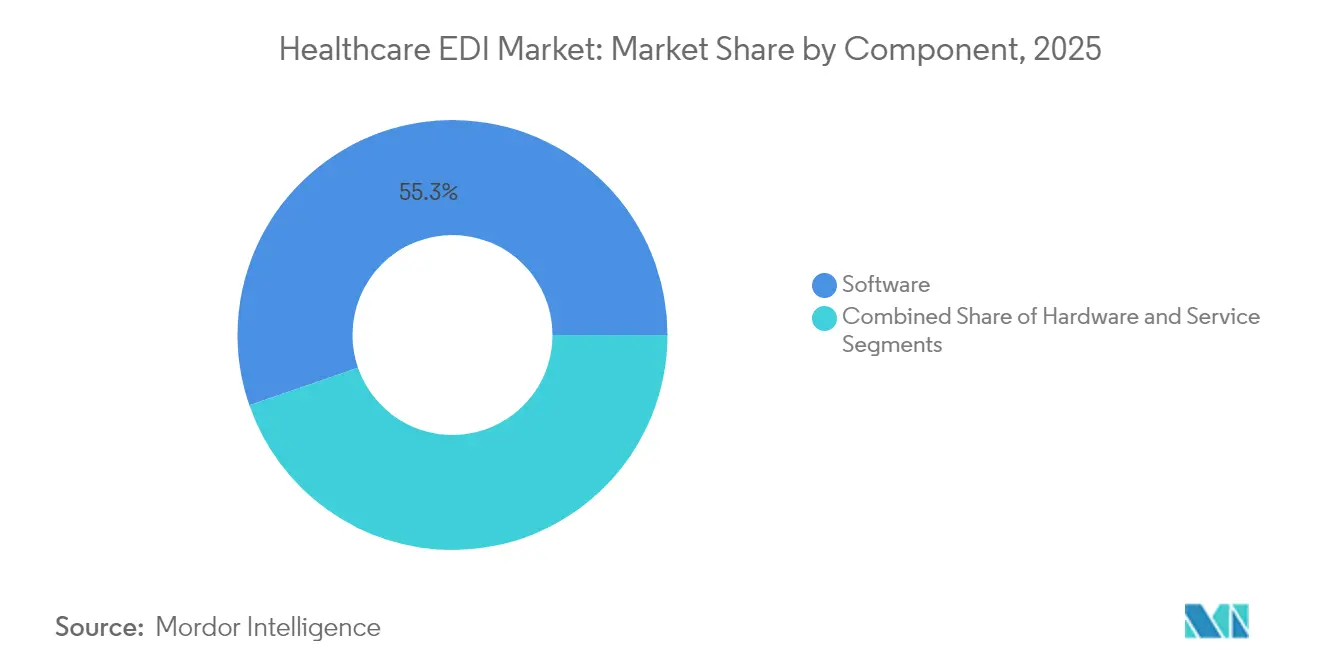
- By component, software retained 55.30% revenue share of the Healthcare EDI market in 2025; services are projected to rise at a 12.22% CAGR to 2031.
- By transaction type, claims management led with 47.60% of the Healthcare EDI market share in 2025, while supply-chain transactions are expected to expand at an 10.92% CAGR through 2031.
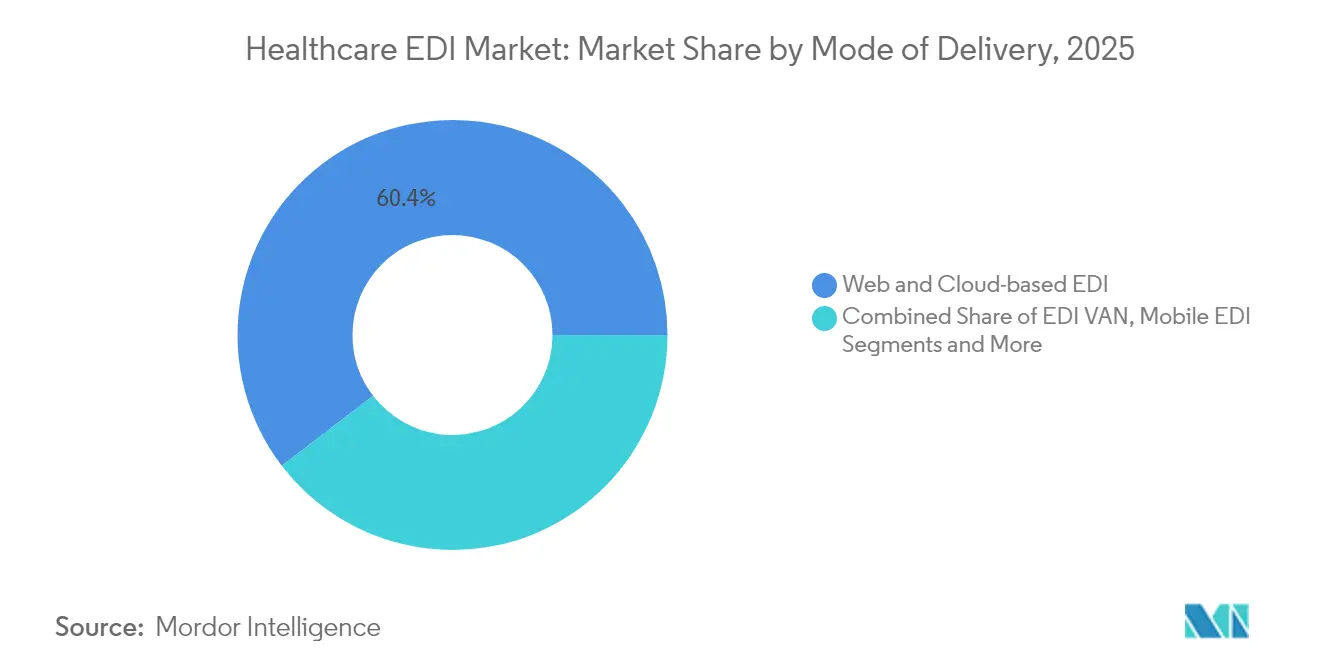
- By mode of delivery, cloud platforms commanded 60.40% share of the Healthcare EDI market size in 2025; mobile EDI is forecast to post a 16.98% CAGR between 2026-2031.
- By end user, providers accounted for 53.30% share of the Healthcare EDI market size in 2025, whereas payers are set to grow the fastest at 13.28% CAGR to 2031.
- By geography, North America dominated with 42.60% of the Healthcare EDI market in 2025; Asia-Pacific is poised for the highest regional CAGR of 11.74% during 2026-2031.
Note: Market size and forecast figures in this report are generated using Mordor Intelligence’s proprietary estimation framework, updated with the latest available data and insights as of 2026.
Global Healthcare EDI Market Trends and Insights
Drivers Impact Analysis*
| Driver | (~) % Impact on CAGR Forecast | Geographic Relevance | Impact Timeline |
|---|---|---|---|
| Mandated HIPAA and global regulatory push | +2.8% | North America, Europe, with growing influence in Asia-Pacific | Short term (≤ 2 years) |
| Rising healthcare cost-containment pressures | +2.1% | Global, with higher impact in mature markets | Medium term (2-4 years) |
| Cloud-enabled SaaS EDI adoption | +1.7% | Global, with early adoption in North America and Europe | Medium term (2-4 years) |
| Shift to value-based care revenue-cycle efficiency | +1.4% | North America, Europe, with gradual adoption in Asia-Pacific | Long term (≥ 4 years) |
| AI-driven auto-coding boosts EDI data integrity | +0.9% | North America, Europe, advanced Asian markets | Medium term (2-4 years) |
| Blockchain payer-provider pilots integrating EDI | +0.6% | North America, select European countries | Long term (≥ 4 years) |
| Source: Mordor Intelligence | |||
Mandated HIPAA and global regulatory push
HIPAA transactions remain obligatory in the United States, compelling providers and payers to exchange claims, remittances and eligibility data through standardized EDI formats. CMS deliberations on skipping directly to Version 8010 underscore the urgency of a modernized framework that removes legacy ambiguities[3]healthedge.com/resources/blog/regulatory-highlights-that-health-plans-should-know. Similar mandates in Europe and Asia are converging toward common syntaxes, compressing implementation timelines for multinationals and contributing roughly 2.8 percentage points to the Healthcare EDI market CAGR. Export-driven Asian health-tech vendors, particularly in South Korea and Taiwan, leverage this alignment to gain trading-partner acceptance in North America and the European Economic Area.
Rising healthcare cost-containment pressures
Healthcare organizations save an average of USD 2.7 per electronic transaction versus paper, trimming 82% of processing time. With reimbursement erosion squeezing margins, revenue-cycle managers increasingly view full-suite EDI as a non-negotiable operating requirement. Deployments that automate pre-authorization validation and auto-post remittance data deliver 15-30% cost reductions in administrative cost centers, reinforcing the Healthcare EDI market growth narrative.
Cloud-enabled SaaS EDI adoption
Eighty-seven percent of surveyed health enterprises now favor hybrid cloud. Pay-as-you-go subscription models eliminate large capital outlays, letting hospitals and ambulatory groups adopt the same compliance posture as large IDNs. Automated update cycles keep transaction sets aligned to regulatory changes without disruptive on-prem upgrades, adding 1.7 points to forecast expansion.
Shift to value-based care revenue-cycle efficiency
Bundled-payment contracts require data feeds that combine clinical and financial elements. Modern EDI platforms embed HL7 FHIR resource mapping next to X12 transactions, letting payers reconcile quality scores with financial withholds in a single pass. Early adopters report lower denial rates and faster settlement, securing a 1.4-point uplift to market momentum.
Restraints Impact Analysis*
| Restraint | (~)% Impact on CAGR Forecast | Geographic Relevance | Impact Timeline |
|---|---|---|---|
| Data security and privacy breaches | -1.2% | Global, with higher impact in North America and Europe | Medium term (2-4 years) |
| High implementation and integration cost | -0.9% | Global, with greater impact on emerging markets | Short term (≤ 2 years) |
| Skilled EDI workforce shortages | -0.7% | Global, particularly acute in rapidly growing markets | Medium term (2-4 years) |
| FHIR APIs eroding legacy EDI demand | -0.5% | North America, Europe, advanced Asian markets | Long term (≥ 4 years) |
| Source: Mordor Intelligence | |||
Data security and privacy breaches
The February 2025 Change Healthcare ransomware attack disrupted claims nationwide and forced UnitedHealth Group to advance USD 6.5 billion in relief payments[1]UnitedHealth Group, “Information on the Change Healthcare Cyber Response,” unitedhealthgroup.com. Fallout heightened scrutiny of transaction routing and encryption layers, denting EDI rollout velocity among risk-averse providers and shaving 1.2% points from potential CAGR.
High implementation and integration cost
Complex environments comprising practice-management, EMR and legacy clearinghouse links can drive integration budgets 30-50% above plan. Rural hospitals operating on slim margins frequently defer upgrades, slowing near-term Healthcare EDI market adoption by 0.9 points.
*Our forecasts treat driver/restraint impacts as directional, not additive. The impact forecasts reflect baseline growth, mix effects, and variable interactions.
Segment Analysis
By Component: Services Surge Amid Integration Complexity
Software remained the backbone of the Healthcare EDI market in 2025, generating 55.30% of total revenue as organizations standardized on cloud-ready clearinghouse engines. The services sub-segment, however, is expanding at a 12.22% CAGR through 2031, propelled by scarce in-house expertise and ever-evolving compliance mandates. Consultancies providing mapping, partner onboarding, and 24/7 transaction monitoring fill critical skill gaps for midsize systems pursuing aggressive digital agendas.
Growing reliance on managed services also reflects the rising sophistication of composite workflows that merge X12, HL7 FHIR, and proprietary APIs. Providers are turning to external specialists for data stewardship, exception handling, and continuous testing. The Healthcare EDI market size for service offerings is forecast to eclipse USD 3.25 billion by 2031, while the hardware footprint contracts as virtualized gateways replace rack-based modems.


By Transaction Type: Supply Chain Optimization Accelerates
Claims management held 47.60% revenue share of the Healthcare EDI market in 2025, underlining its centrality in cash-flow preservation. Nevertheless, supply-chain transactions are registering an 10.92% CAGR as health systems exploit EDI to rationalize inventory and tame rising device costs. Automated purchase orders, ASN feeds, and consignment stock alerts trim stock-outs and free working capital, positioning supply-chain EDI as a strategic lever for CFOs.
Interlacing IoT telemetry with EDI message sets offers real-time expiry tracking for temperature-sensitive biologics, reducing waste. This convergence is nudging procurement and biomedical engineering teams into joint governance councils, intensifying demand for integrated network-wide data visibility across the Healthcare EDI market.
By Mode of Delivery: Mobile EDI Disrupts Traditional Models
Cloud deployments captured a 60.40% share in 2025, affirming SaaS as the default onboarding route. Mobile EDI, though starting from a smaller base, is propelling segment growth at 16.98% CAGR. Physicians authorize claims corrections on smartphones while nurses query eligibility from bedside tablets. Flexible, native-app experiences remove the tether to on-prem terminals, aligning clinician workflow with modern mobility norms and reinforcing broader Healthcare EDI market expansion.
Hybrid delivery models now blend lightweight mobile interfaces with centralized cloud processing and established value-added networks for high-volume routing. Resulting architectures cut per-transaction costs yet uphold stringent HIPAA encryption thresholds.
By End User: Payers Accelerate Digital Transformation
Providers represented 53.30% revenue share of the Healthcare EDI market in 2025, relying on high-volume claim submission and remittance advice feeds. Payers, however, are projected to log a 13.28% CAGR as competitive pressures force automation of prior authorization, benefits coordination, and risk-score analytics. Next-generation payer hubs deploy configurable rules to pre-empt denials and feed value-based settlement engines.
Life-science manufacturers increasingly adopt EDI to synchronize production forecasts with distributor demand signals, enhancing lot traceability and shortening recall response windows. These dynamics expand the Healthcare EDI industry ecosystem into adjacent regulatory and pharmacovigilance arenas.
Geography Analysis
North America retained leadership with 42.60% of 2025 revenue, underpinned by HIPAA mandates and mature clearinghouse networks. Nearly all Medicare fee-for-service claims flow electronically, establishing a high baseline for the Healthcare EDI market. The Interoperability and Prior Authorization Final Rule intensifies digital requirements, nudging commercial payers toward automated exception handling and widening the addressable opportunity across smaller provider groups.
Asia-Pacific delivers the fastest growth at 11.74% CAGR, buoyed by rapid health-insurance expansion and extensive government cloud initiatives in China, India, and Indonesia. Mobile-first adoption allows clinics to bypass legacy modem infrastructure, accelerating penetration. Mandatory e-invoicing rules in economies such as South Korea cascade into accelerated healthcare data-exchange spending, lifting the regional Healthcare EDI market size toward USD 1.78 billion by 2031.
Europe showcases diverse adoption curves. Germany scales unified procurement exchanges within its DRG reimbursement framework, while the United Kingdom prioritizes cross-border EHR linkages that convert clinical events into billing-ready EDI stubs. Scandinavia benefits from nationwide electronic ID systems that streamline patient eligibility checks. Collectively, these initiatives maintain Europe’s role as the second-largest regional contributor to the Healthcare EDI market revenue.

Competitive Landscape
The competitive arena remains moderately consolidated. UnitedHealth Group’s 2022 purchase of Change Healthcare fused the largest clearinghouse with Optum’s analytics portfolio, giving the combined entity roughly three-quarters of first-pass claims-editing throughput. Edifecs counters through cloud-native EDI gateways that bundle AI-driven exception triage and blockchain-ready audit trails, while Experian Health leverages its credit-data roots to refine patient estimate workflows[2]Edifecs, “Edifecs Introduces Healthcare Interoperability Cloud,” edifecs.com.
Strategic alliances surface as a preferred scale pathway. Edifecs and HealthEdge integrate claims-adjudication engines with an eye on payer flexibilities. OpenText deepens reseller arrangements with major EMR platforms to embed secure messaging protocols. Start-ups focused on FHIR-over-EDI translation attract venture funding as interoperability rules converge.
Product roadmaps pivot hard toward cybersecurity, threat analytics, and zero-trust architectures. Vendors publicize SOC 2 Type II certifications and real-time anomaly detection modules, differentiators amplified by the Change Healthcare incident. Interoperability clouds that abstract transaction formats allow multinationals to harmonize claims flows across 20+ country codes without bespoke local stacks, shaping the next battleground in the Healthcare EDI market.
Healthcare EDI Industry Leaders
Change Healthcare
Optum Inc.
McKesson Corporation
Experian Health
Cognizant
- *Disclaimer: Major Players sorted in no particular order

Recent Industry Developments
- February 2025: Edifecs launched the Healthcare Interoperability Cloud, combining EDI gateway functions with FHIR translation and blockchain-anchored audit trails.
- February 2025: QualiZeal and GenRocket partnered to automate synthetic test-data generation for HIPAA-conformant EDI validation.
- December 2024: The Maryland Health Care Commission released a report on EDI adoption in healthcare, noting that most claims are now submitted electronically following HIPAA standards established in 2000. The report revealed high EDI adoption rates for medical claims (e.g., Medicare at 99.7% in 2023) but lower rates for dental claims due to documentation challenges
- July 2024: HealthEdge highlighted potential adoption of X12 Version 8010, signaling significant mapping updates for payers and providers healthedge.com.


Research Methodology Framework and Report Scope
Market Definitions and Key Coverage
Our study defines the healthcare electronic data interchange (EDI) market as the value generated from software licenses, cloud subscriptions, and managed services that enable structured, standards-based electronic transmission of clinical, administrative, and financial data among payers, providers, and supply-chain partners.
Scope exclusion: in-house custom integration tools that lack X12 or HL7 messaging compliance are outside our remit.
Segmentation Overview
- By Component
- Software
- Hardware
- Services
- By Transaction Type
- Claims Management (837/835)
- Healthcare Supply-Chain (810/856)
- Others (Referral, Authorization, and more)
- By Mode of Delivery
- Web and Cloud-based EDI
- EDI VAN
- Mobile EDI
- Other Modes of Delivery
- By End User
- Healthcare Providers
- Medical Devices and Pharmaceutical Industry
- Payers
- Other End Users
- By Geography
- North America
- United States
- Canada
- Mexico
- South America
- Brazil
- Argentina
- Rest of South America
- Europe
- United Kingdom
- Germany
- France
- Italy
- Spain
- Nordics
- Rest of Europe
- Middle East and Africa
- GCC
- Israel
- South Africa
- Rest of Middle East and Africa
- Asia-Pacific
- China
- India
- Japan
- South Korea
- ASEAN
- Australia
- New Zealand
- Rest of Asia-Pacific
- North America
Detailed Research Methodology and Data Validation
Primary Research
Our team interviewed claims-clearinghouse executives, hospital revenue-cycle heads, and regional regulator representatives across North America, Europe, and Asia-Pacific. Insights on shifting HIPAA compliance timelines, average claim digitization rates, and emerging FHIR pilots filled data gaps and validated desk findings.
Desk Research
Mordor analysts started with publicly available datasets from agencies such as the US Centers for Medicare & Medicaid Services, the Office of the National Coordinator for Health IT, Eurostat, and the Japanese MHLW, together with trade-group dashboards from WEDI and AHIP. Company 10-Ks, investor decks, and select releases from the Workgroup for Electronic Data Interchange enriched adoption statistics. Paid repositories, including D&B Hoovers for payer revenue splits and Dow Jones Factiva for transaction volume news, helped cross-check revenue pools. This list is illustrative; many further documents were consulted for verification and context.
Market-Sizing & Forecasting
Top-down modeling began with national claim counts and average EDI transaction fees, which were reconstructed from regulatory filings and payer disclosures, then aligned with adoption ratios by delivery mode. Select bottom-up checks, sampled vendor revenues and channel pricing, calibrated totals. Key variables include (i) annual medical claim volume, (ii) EHR adoption penetration, (iii) cloud migration share of EDI traffic, (iv) HIPAA-mandated transaction compliance rates, and (v) average service price per 837/835 file. A multivariate regression on these indicators, supplemented by ARIMA smoothing for short-term shocks, produced the 2025-2030 forecast.
Data Validation & Update Cycle
Outputs pass three-layer variance reviews; anomaly flags trigger re-contacts, and senior analysts sign off only after convergence within an accepted error band. Reports refresh yearly, with interim revisions if material events, such as a major cybersecurity breach, shift baseline assumptions.
Why Mordor's Healthcare Electronic Data Interchange Baseline Inspires Confidence
Published figures often diverge because providers differ in scope, input granularity, and currency treatment.
Key gap drivers include: some firms bundle pharmaceutical and device EDI revenues, others stop at claims transactions alone, and refresh cadences vary, which skews 2025 comparability. Mordor's study reports a balanced base case that mirrors real-world claim workflows and applies mid-year FX averages to curb volatility.
Benchmark comparison
| Market Size | Anonymized source | Primary gap driver |
|---|---|---|
| USD 4.72 B (2025) | Mordor Intelligence | - |
| USD 4.50 B (2024) | Global Consultancy A | Narrow scope excludes supply-chain EDI and uses earlier base year |
| USD 4.90 B (2024) | Industry Analyst B | Inflated total by adding pharma/device B2B EDI and projecting to 2034 without mid-cycle recalibration |
Taken together, the comparison shows that Mordor's disciplined variable selection, annual refresh, and dual-lens validation yield a dependable, decision-ready baseline.


Key Questions Answered in the Report
What is driving the double-digit growth of the Healthcare EDI market?
Cost-containment mandates, HIPAA and global regulatory pressures, cloud affordability and the shift to value-based care collectively underpin the 10.16% CAGR forecast to 2031.
Which component segment is expanding the fastest?
EDI services, covering implementation, integration and managed operations, are growing at 12.22% CAGR as organizations outsource complex technical tasks.
How large is the North American Healthcare EDI market relative to other regions?
North America holds 42.60% of total 2025 revenue, more than double the share of any other region due to long-standing regulatory mandates and mature clearinghouse networks.
Which is the fastest growing region in Healthcare EDI Market?
Asia Pacific is estimated to grow at the highest CAGR over the forecast period (2026-2031).
Why are payers increasing their EDI investment?
Heightened competition and the need to cut administrative overhead are pushing payers toward automated claims adjudication and real-time prior authorization, fueling a 13.28% CAGR.
How is the Change Healthcare cyberattack influencing vendor selection criteria?
The February 2025 breach sharpened focus on encryption, zero-trust architectures and independent failover pathways, prompting buyers to prioritize vendors with demonstrable security certification.
What role will mobile EDI play by 2031?
Mobile usage is forecast to rise at 16.98% CAGR, enabling clinicians to execute eligibility checks and claims corrections at the point of care, further broadening EDI ubiquity across care settings.
Page last updated on:


