Gene Expression Analysis Market Size and Share
Market Overview
| Study Period | 2019 - 2030 |
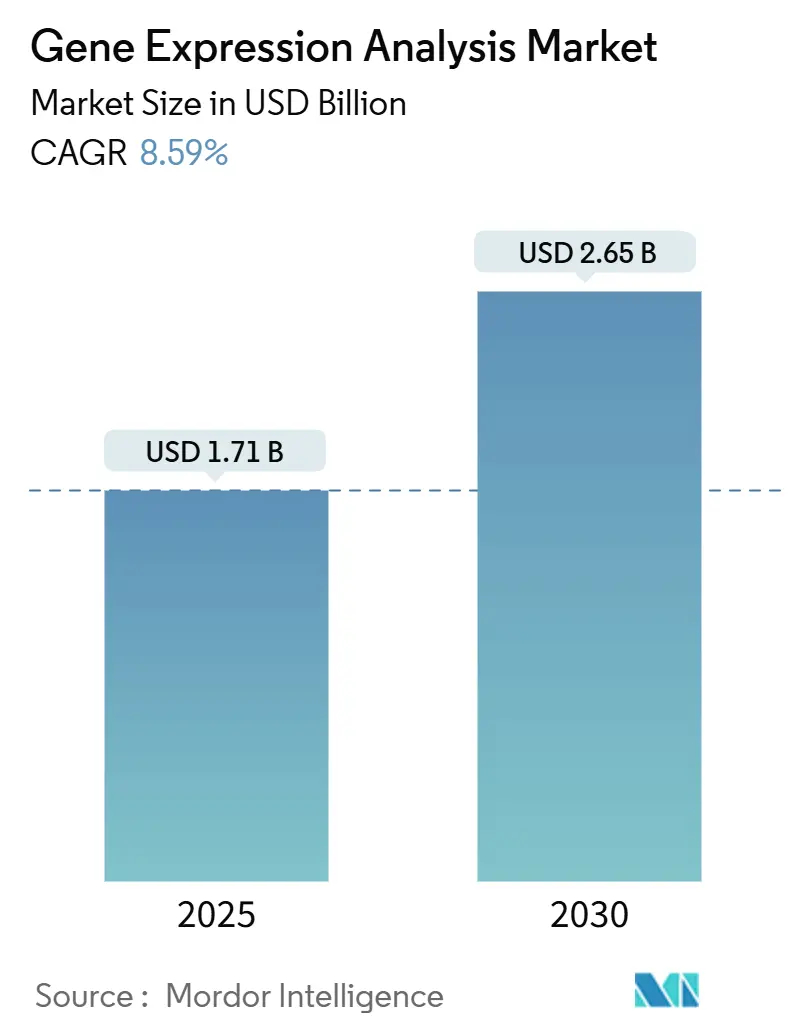
| Market Size (2025) | USD 1.71 Billion |
| Market Size (2030) | USD 2.65 Billion |
| Growth Rate (2025 - 2030) | 8.59% CAGR |
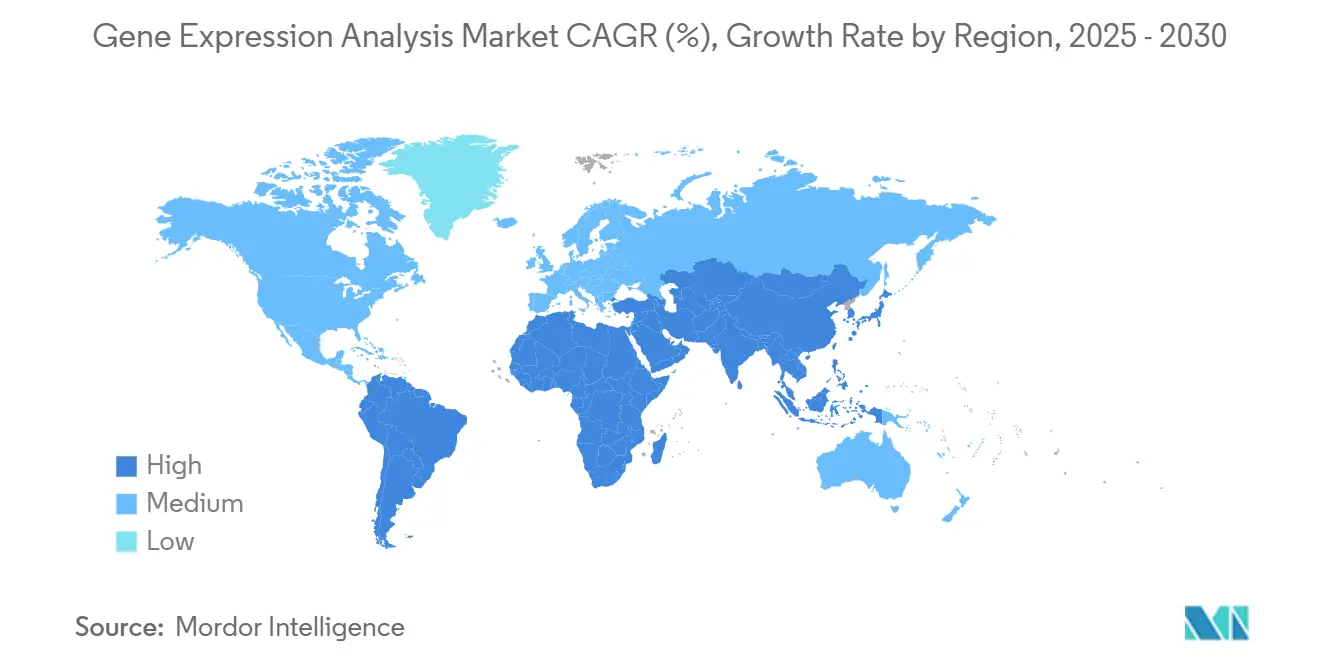
| Fastest Growing Market | Asia Pacific |
| Largest Market | North America |
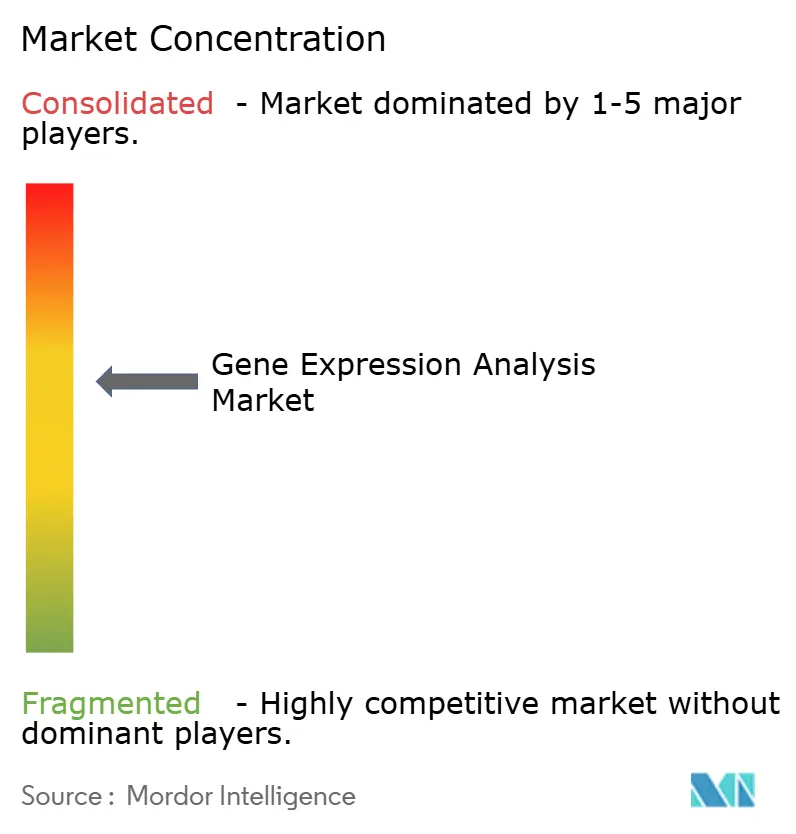
| Market Concentration | Medium |
Major Players
*Disclaimer: Major Players sorted in no particular order Image © Mordor Intelligence. Reuse requires attribution under CC BY 4.0. |
|
Gene Expression Analysis Market Analysis by Mordor Intelligence
The Gene Expression Analysis Market size is estimated at USD 1.71 billion in 2025, and is expected to reach USD 2.65 billion by 2030, at a CAGR of 8.59% during the forecast period (2025-2030).
This expansion reflects the steady integration of artificial intelligence into sequencing workflows, the widening clinical use of multi-omics profiling, and supportive reimbursement and regulatory frameworks. Demand accelerates as laboratories adopt spatial biology tools that map gene activity within intact tissue, and as governments channel funding toward genomic infrastructure that links research discoveries to routine patient care. Platform suppliers respond with faster, more accurate instruments, while service providers scale cloud-based bioinformatics that lessen the skills shortage. Consolidation among reagent vendors and instrument makers intensifies price competition, yet supply chain fragility for synthetic nucleotides and data-sovereignty rules remain persistent risks to growth.
Key Report Takeaways
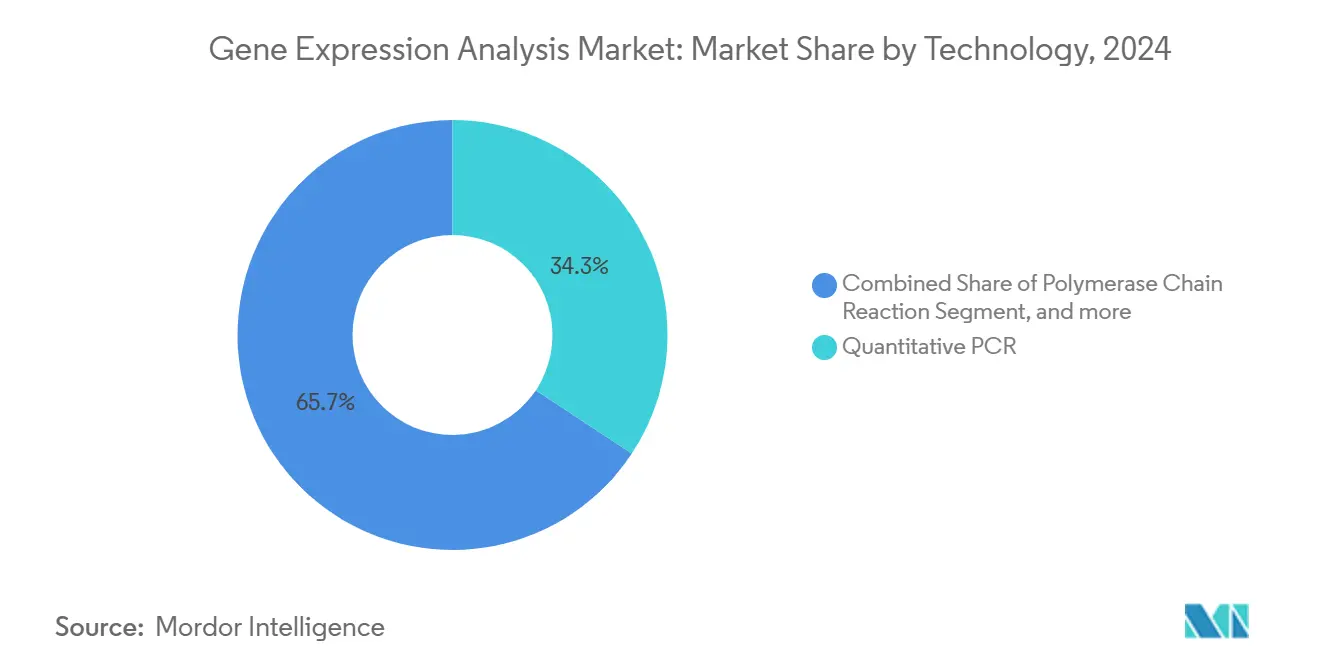
- By technology, quantitative PCR held 34.28% of gene expression analysis market share in 2024, whereas spatial transcriptomics is set to expand at a 15.23% CAGR to 2030.
- By product type, reagents and consumables commanded 48.65% of the gene expression analysis market size in 2024, while services show the fastest trajectory with a 13.23% CAGR through 2030.
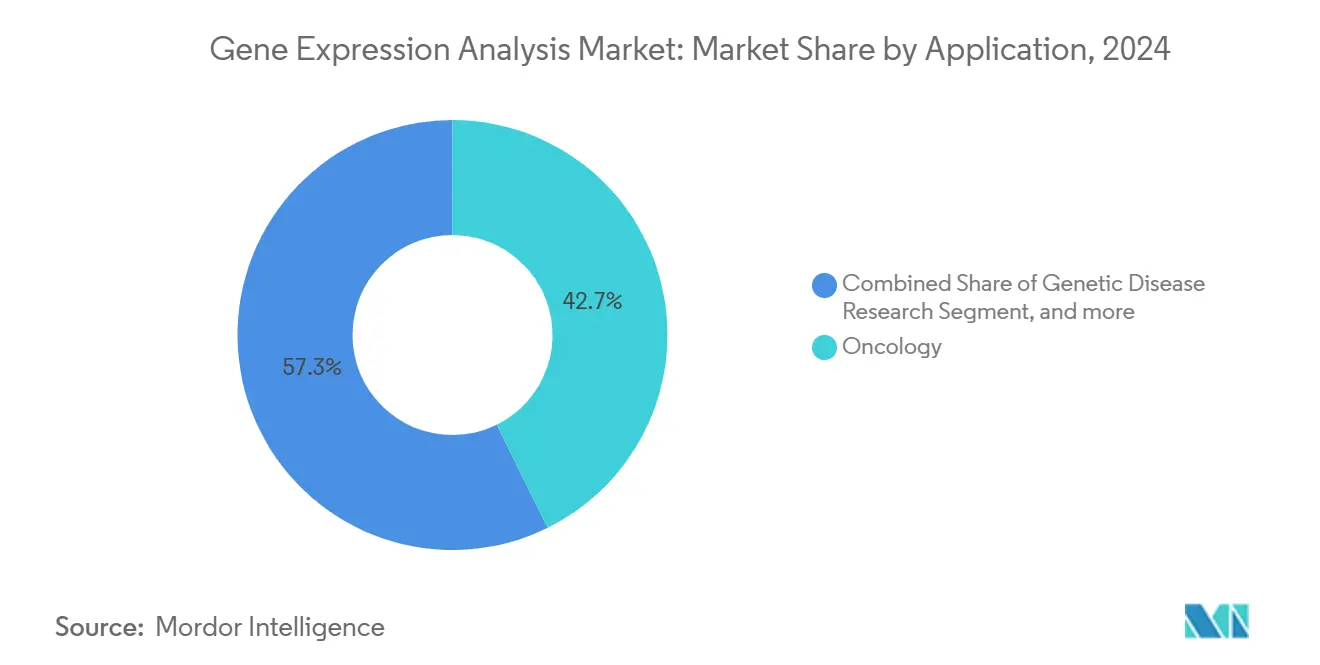
- By application, oncology generated 42.67% of 2024 revenue, whereas infectious disease diagnostics is expected to advance at a 16.89% CAGR until 2030.
- By end user, pharmaceutical and biotechnology companies accounted for 35.67% of revenue in 2024; diagnostic laboratories will rise the quickest with a 12.64% CAGR to 2030.
- By geography, North America led with 43.56% revenue share in 2024, while Asia-Pacific is forecast to grow at an 11.64% CAGR through 2030.
Global Gene Expression Analysis Market Trends and Insights
Drivers Impact Analysis
| Driver | (~) % Impact on CAGR Forecast | Geographic Relevance | Impact Timeline |
|---|---|---|---|
| Rapid Technological Advancement in NGS & qPCR Platforms | +2.1% | Global, with concentration in North America & Europe | Medium term (2-4 years) |
| Increased Government Funding for Genomics | +1.8% | Global, particularly strong in US, EU, China, India | Long term (≥ 4 years) |
| Growing Adoption of Precision Medicine | +1.6% | North America & EU leading, expanding to APAC | Medium term (2-4 years) |
| Integration of Spatial-Omics & Single-Cell Profiling | +1.4% | Global research hubs, clinical adoption in developed markets | Long term (≥ 4 years) |
| AI-Driven Bioinformatics Pipelines | +1.2% | Global, with early adoption in tech-advanced regions | Short term (≤ 2 years) |
| Cell & Gene-Therapy Manufacturing QC Demand | +0.9% | North America & EU, emerging in APAC | Medium term (2-4 years) |
Source: Mordor Intelligence
Rapid Technological Advancement in NGS & qPCR Platforms
Next-generation sequencing now reaches telomere-to-telomere assemblies that uncover structural variants and epigenetic marks missed by short-read systems. Oxford Nanopore’s long-read instruments deliver direct RNA data without amplification steps, while AI-enhanced base-calling lowers error rates and computing needs. Integration with quantitative PCR shortens confirmatory workflows and boosts total throughput. QIAGEN’s AI-powered Ingenuity Pathway Analysis converts raw reads into biological pathways that clinicians can interpret within hours. Collectively, these advances cut turnaround times and widen adoption in routine diagnostics.
Increased Government Funding for Genomics
National programs treat genomics as a competitiveness asset. The US National Institutes of Health assigned USD 27 million in 2024 to weave genomic data into learning health systems.[1]NIH Staff, “NIH Establishes Genomics-Enabled Learning Health Systems,” National Institutes of Health, nih.gov India finished sequencing 10,000 genomes in 2025 to create population-specific references.[2]Staff Writers, “Genome India Project Completes Sequencing of 10,000 Genomes,” The Scientist, the-scientist.com China’s Human Genome Project II proposal seeks to sequence 1% of the global population, while Australia’s Genomics Health Futures Mission earmarks AUD 500.1 million over ten years. Such funding shifts the focus from discovery science to clinical deployment and sustains long-term demand for sequencing capacity.
Growing Adoption of Precision Medicine
Fifteen US states now mandate insurance coverage for biomarker tests, lowering patient cost barriers and lifting test volumes. The FDA approved eight new cell and gene therapies in 2024, and regulators predict up to twenty approvals in 2025, anchoring genomic assays within drug-labeling requirements. Hospitals install robotic laboratories that double sequencing capacity and trim turnaround to under one day. Pharmaceutical firms design trials around pharmacogenomics, making companion diagnostics standard for approvals in oncology and neurology.
Integration of Spatial-Omics & Single-Cell Profiling
Spatial transcriptomics keeps cellular context intact, helping researchers visualize immune infiltration and tumor heterogeneity.[3]Staff Writers, “Telomere-to-Telomere Assembly With Nanopore Sequencing,” Nature, nature.com Platforms from 10x Genomics and Vizgen provide sub-cellular resolution, and AI tools map three-dimensional gene activity. Expansion microscopy boosts RNA detection without losing positional accuracy, thereby refining target discovery for immunotherapies. Drug developers exploit these insights to rank candidates by spatial gene signatures rather than bulk averages, improving trial success rates.
Restraints Impact Analysis
| Restraint | (~) % Impact on CAGR Forecast | Geographic Relevance | Impact Timeline |
|---|---|---|---|
| High Capital Costs of Advanced Sequencers | -1.8% | Global, particularly affecting emerging markets | Medium term (2-4 years) |
| Shortage of Skilled Bioinformaticians | -1.4% | Global, acute in APAC and developing regions | Long term (≥ 4 years) |
| Data-Sovereignty Regulations on Genomic Data | -1.1% | EU leading, expanding to US and APAC | Medium term (2-4 years) |
| Reagent Supply-Chain Fragility (Synthetic Nucleotides) | -0.8% | Global, with concentration risk in Asia manufacturing | Short term (≤ 2 years) |
Source: Mordor Intelligence
High Capital Costs of Advanced Sequencers
Top-tier spatial biology platforms often exceed USD 1 million per unit and require extra imaging modules and high-performance computing. Smaller laboratories in Latin America, Africa, and parts of Asia delay purchases or rely on service providers, which concentrates volume among well-funded hubs. Illumina’s target of USD 200 per genome remains distant, reinforcing cost barriers. Leasing agreements spread payments but increase total outlay and reduce user control over data pipelines.
Shortage of Skilled Bioinformaticians
Training programs lag behind the rapid evolution of multi-omics analytics. Spatial data demand expertise in image processing and statistical modeling that few graduates possess. Salary inflation places bioinformaticians out of reach for mid-sized hospitals, pushing institutions toward outsourced analysis. Emerging markets feel the pinch most, as local universities struggle to add genomics curricula and retain talent.
Segment Analysis
By Technology: Spatial Biology Drives Innovation
The gene expression analysis market size for technology segments with quantitative PCR retaining 34.28% revenue while spatial transcriptomics registers an unmatched 15.23% CAGR. Spatial tools preserve tissue context and reveal cell-cell interactions that bulk assays mask. Next-generation sequencing remains essential in diagnostics but now integrates long-read chemistry that resolves structural variants. Digital PCR gains users who need absolute quantification, and microarrays decline yet stay relevant for targeted panels.
Spatial methods reshape discovery pipelines. Oxford Nanopore’s Mk1D MinION provides bedside sequencing for infectious disease outbreaks, and its ElysION robot automates library prep. Comparative benchmarks show 10x Genomics’ Chromium Fixed RNA Profiling kit outperforming peers on sensitivity, while Becton Dickinson’s Rhapsody kit offers budget options. Artificial intelligence reduces run-time error correction, broadening usability. Together these trends elevate spatial biology’s profile and sustain high growth inside the gene expression analysis market.
Note: Segment shares of all individual segments available upon report purchase
By Product Type: Services Accelerate Growth
Services posted a 13.23% CAGR, the fastest within the gene expression analysis industry, as labs outsource multi-omics analytics that exceed internal capacity. Reagents and consumables still delivered 48.65% of 2024 revenue, confirming their anchoring role in daily workflows. Cloud-hosted bioinformatics attracts hospitals and pharmaceutical sponsors seeking quick turnaround without hiring data scientists. Contract research organizations expand menu offerings, including single-cell analytics, to tap this demand.
Firms pivot toward higher-margin software and services. QIAGEN expanded its Digital Insights portfolio with five planned launches while BD partnered with Biosero to link flow cytometry and robotics. Instrument growth decelerates since platform life spans now exceed five years, yet upgrades remain necessary for spatial imaging add-ons. Robotic handling lowers contamination risk and keeps batch quality consistent, which appeals to diagnostic labs scaling test volumes.
By Application: Infectious Disease Diagnostics Surge
Infectious disease diagnostics is set to climb at a 16.89% CAGR, narrowing the gap with oncology’s 42.67% share. Pandemic response funding and antimicrobial resistance monitoring sustain government spending on sequencing capacity. Genomic surveillance tracks variants and guides vaccine decisions, demonstrating real-time public health value.
Oncology remains the anchor application, expanding into liquid biopsy and minimal residual disease tests. The FDA and Thermo Fisher collaborate on the myeloMATCH precision medicine trial, embedding genomic stratification into therapy selection. Rare disease initiatives support steady genetic disease research, while the agriculture sector adopts expression profiling to enhance crop resilience. Environmental scientists combine transcriptomics with biodiversity surveys to monitor ecosystem change.
Note: Segment shares of all individual segments available upon report purchase
By End User: Diagnostic Laboratories Lead Growth
Diagnostic laboratories will record a 12.64% CAGR through 2030, outpacing pharmaceutical and biotechnology companies that held 35.67% of 2024 revenue. Clinical labs invest in automation that enables same-day results, crucial for oncology treatment paths and infection control. Academic centers slow spending after initial infrastructure buildout, yet remain innovation hubs.
Pharmaceutical firms integrate companion diagnostics in almost every late-phase study, fueling reagent demand. Contract research organizations bridge capacity gaps by offering turnkey genomics. Hospitals test decentralized sequencing, but uptake is gradual because cost and compliance hurdles persist. QIAGEN’s QuantiFERON TB and QIAstat-Dx lines underscore how syndromic panels propel routine testing volumes.
Geography Analysis
North America generated 43.56% of 2024 revenue and benefits from insurance mandates that compel coverage of biomarker tests. The National Institutes of Health investment in genomics-enabled health systems steers data into clinical workflows. FDA approvals of eight cell and gene therapies in 2024 confirm regulatory acceptance and stimulate test utilization. Canada expands precision medicine programs, while Mexico channels funds toward infectious disease sequencing; yet growth moderates as the market approaches maturity.
Asia-Pacific exhibits the fastest trajectory at 11.64% CAGR, and its share of the gene expression analysis market is rising quickly. India completed the 10,000-genome project that yields a culturally relevant reference set. China’s Human Genome Project II proposal underlines ambitions to sequence 1% of the global population, and Japan’s Omics Browser tailors multi-omics tools to East Asian genomes. Australia’s Genomics Health Futures Mission funds 88 projects despite coordination challenges. South Korea backs start-ups that combine AI and long-read sequencing.
Europe maintains steady expansion through Horizon research calls and national healthcare budgets. Robotic genomic testing at the UK’s Royal Marsden hospital doubles throughput and lowers errors. Germany and France streamline reimbursement for NGS tumor panels. The Middle East and Africa explore public-private genomics centers, with Saudi Arabia signing memoranda with QIAGEN. South America records slower gains; however, Brazil and Argentina join international collaborations that give laboratories affordable access to sequencing reagents.
Competitive Landscape
The gene expression analysis market features moderate consolidation. Leaders such as Thermo Fisher Scientific, Illumina, and QIAGEN bundle instruments, reagents, and software into integrated ecosystems. Thermo Fisher’s USD 3.1 billion Olink acquisition adds high-plex proteomics, reinforcing its spatial biology lineup. Bruker’s USD 392.6 million purchase of NanoString extends into spatial transcriptomics, targeting break-even by 2026. These deals signal that incumbents use M&A to secure differentiated capability rather than rely solely on internal R&D.
Mid-sized challengers exploit white-space niches. Oxford Nanopore leads portable long-read sequencing, while 10x Genomics dominates single-cell assays. BD’s partnership with Biosero links robotics to flow cytometry for automated sample prep. Software-centric entrants supply AI pipelines that trim interpretation times, easing the bioinformatics bottleneck. As barriers to instrument design drop, new firms compete on application specificity, yet scaling manufacturing and customer support remains arduous.
Price pressure persists as consumables revenue subsidizes affordable instrument placement. Raw material inflation and supply-chain disruptions add cost volatility, encouraging multi-sourcing strategies. Companies cultivate government relationships for large-scale sequencing programs that offer stable volumes. Branding now hinges on end-to-end workflow efficiency and data security assurances, not simply raw throughput specifications.
Gene Expression Analysis Industry Leaders
-
Quest Diagnostics Incorporated
-
PerkinElmer Inc.
-
Agilent Technologies
-
Promega Corporation
-
Illumina Inc.
- *Disclaimer: Major Players sorted in no particular order
Recent Industry Developments
- April 2025: Thermo Fisher Scientific reported Q1 2025 revenue of USD 10.36 billion with 15% growth, launching Olink Reveal proteomics kits for inflammation and immune response analysis while establishing a Technology Alliance Agreement with the Chan Zuckerberg Institute for Advanced Biological Imaging. The company also announced plans to acquire Solventum's Purification & Filtration Business for USD 4.1 billion, demonstrating continued aggressive expansion strategy.
- April 2025: QIAGEN delivered strong preliminary Q1 2025 results with net sales rising approximately 5% to USD 483 million, driven by 15% growth in QuantiFERON latent TB testing and over 35% growth in QIAstat-Dx syndromic testing systems. The company raised its full-year adjusted diluted EPS outlook to USD 2.35, reflecting operational improvements and market expansion.
- February 2025: India completed its Genome India Project, sequencing 10,000 genomes from 83 communities to create population-specific reference datasets addressing underrepresentation in global genomics databases. The project identified millions of genetic variants including rare disease-associated mutations, enhancing pharmacogenomics applications for precision medicine in South Asian populations.
- November 2024: QIAGEN announced collaboration with McGill University to advance microbiome research through three-year partnership focusing on DNA extraction from low microbial biomass samples and anaerobic culturing protocols, targeting the USD 1.8 billion microbiome market.
Global Gene Expression Analysis Market Report Scope
As per the scope of this report, gene expression makes an analysis of the study of the activity or occurrence of the making of a gene product from its coding gene. This process is considered a delicate indicator of biological activity in which a change in the gene expression pattern leads to a change in the biological process. The gene expression analysis typically involves the isolation or capture of transcribed RNA within a sample, followed by amplification and subsequent detection and quantitation. The Gene Expression Analysis Market is segmented by Technology (Polymerase Chain Reaction (PCR), Next Generation Sequencing (NGS), Microarrays, and Others), Product (Instruments, Reagents and Consumables, and Services), End-user (Drug Discovery, Diagnostic Laboratories, and Academic Research Centers), and Geography (North America, Europe, Asia-Pacific, Middle East & Africa, and South America). The market report also covers the estimated market sizes and trends for 17 different countries across major regions globally. The report offers the value (in USD million) for the above segments.
| By Technology | Polymerase Chain Reaction (PCR) | ||
| Quantitative PCR (qPCR) | |||
| Digital PCR (dPCR) | |||
| Next-Generation Sequencing (NGS) | |||
| Microarrays | |||
| Spatial Transcriptomics | |||
| Others | |||
| By Product Type | Instruments | ||
| Reagents & Consumables | |||
| Services | |||
| By Application | Oncology | ||
| Genetic Disease Research | |||
| Infectious Disease Diagnostics | |||
| Agriculture & Plant Genomics | |||
| Other Applications | |||
| By End-user | Pharmaceutical and Biotechnology Companies | ||
| Diagnostic Laboratories | |||
| Academic & Research Centers | |||
| Contract Research Organizations (CROs) | |||
| Hospitals & Clinics | |||
| By Geography | North America | United States | |
| Canada | |||
| Mexico | |||
| Europe | Germany | ||
| United Kingdom | |||
| France | |||
| Italy | |||
| Spain | |||
| Rest of Europe | |||
| Asia-Pacific | China | ||
| Japan | |||
| India | |||
| Australia | |||
| South Korea | |||
| Rest of Asia-Pacific | |||
| Middle East & Africa | GCC | ||
| South Africa | |||
| Rest of Middle East & Africa | |||
| South America | Brazil | ||
| Argentina | |||
| Rest of South America | |||
| Polymerase Chain Reaction (PCR) |
| Quantitative PCR (qPCR) |
| Digital PCR (dPCR) |
| Next-Generation Sequencing (NGS) |
| Microarrays |
| Spatial Transcriptomics |
| Others |
| Instruments |
| Reagents & Consumables |
| Services |
| Oncology |
| Genetic Disease Research |
| Infectious Disease Diagnostics |
| Agriculture & Plant Genomics |
| Other Applications |
| Pharmaceutical and Biotechnology Companies |
| Diagnostic Laboratories |
| Academic & Research Centers |
| Contract Research Organizations (CROs) |
| Hospitals & Clinics |
| North America | United States |
| Canada | |
| Mexico | |
| Europe | Germany |
| United Kingdom | |
| France | |
| Italy | |
| Spain | |
| Rest of Europe | |
| Asia-Pacific | China |
| Japan | |
| India | |
| Australia | |
| South Korea | |
| Rest of Asia-Pacific | |
| Middle East & Africa | GCC |
| South Africa | |
| Rest of Middle East & Africa | |
| South America | Brazil |
| Argentina | |
| Rest of South America |
Key Questions Answered in the Report
What is the current value of the gene expression analysis market?
The gene expression analysis market is valued at USD 1.71 billion in 2025 and is projected to reach USD 2.65 billion by 2030.
Which technology segment is growing the fastest?
Spatial transcriptomics is expanding at a 15.23% CAGR through 2030 as it reveals spatial context that traditional bulk methods miss.
Why are diagnostic laboratories the fastest-growing end users?
Insurance mandates, automation, and the shift toward clinical genomics allow diagnostic labs to scale testing volumes at a 12.64% CAGR.
Which region offers the highest growth potential?
Asia-Pacific shows the highest regional CAGR at 11.64% because of large-scale government genomics initiatives in India, China, and Australia.
What are the main barriers to market growth?
High capital costs for advanced sequencers, a shortage of skilled bioinformaticians, data-sovereignty regulations, and reagent supply-chain fragility limit expansion.
How will consolidation shape competitive dynamics?
Strategic acquisitions such as Thermo Fisher’s purchase of Olink and Bruker’s acquisition of NanoString signal closer integration of spatial biology and AI analytics among leading vendors.
Page last updated on: June 17, 2025

