Market Overview
| Study Period | 2019 - 2030 |
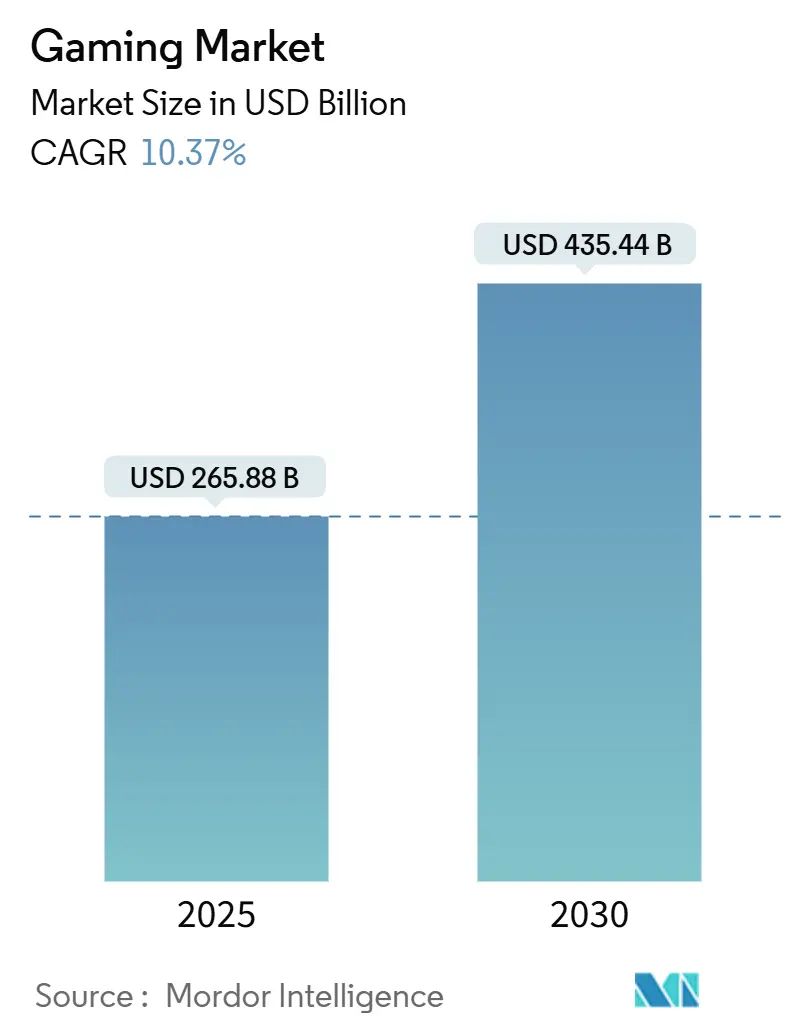
| Market Size (2025) | USD 265.88 Billion |
| Market Size (2030) | USD 435.44 Billion |
| Growth Rate (2025 - 2030) | 10.37% CAGR |
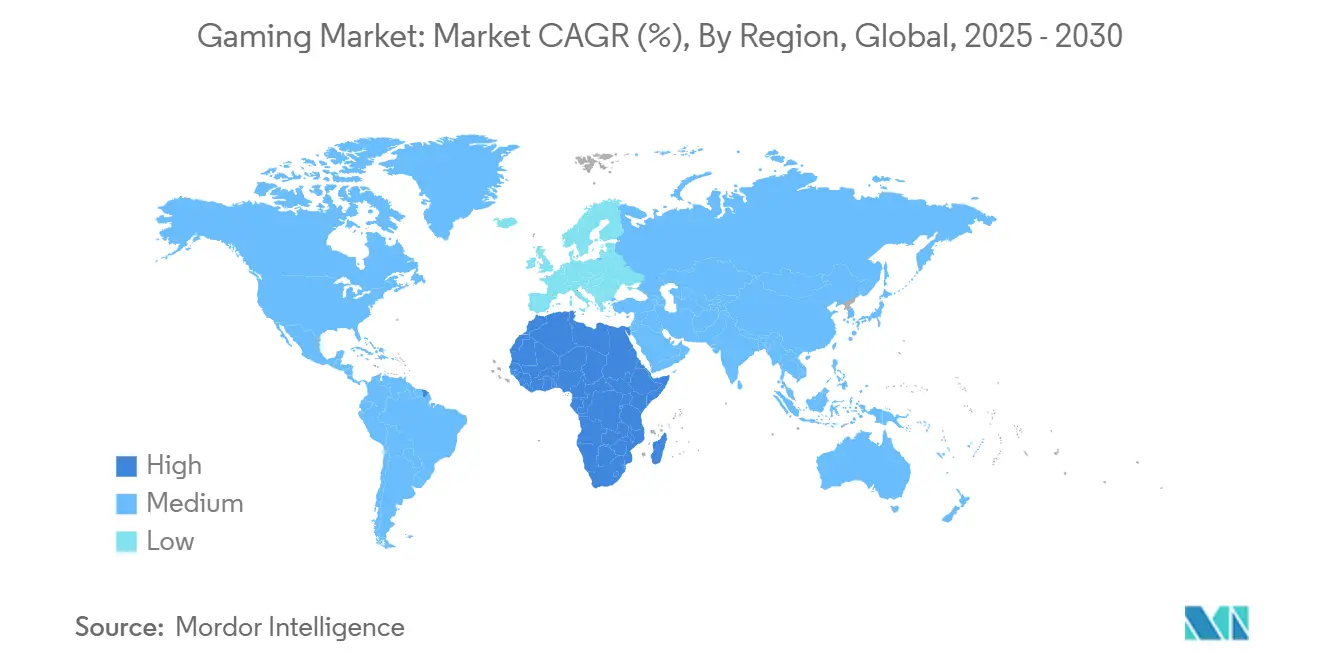
| Fastest Growing Market | Asia Pacific |
| Largest Market | Middle East and Africa |
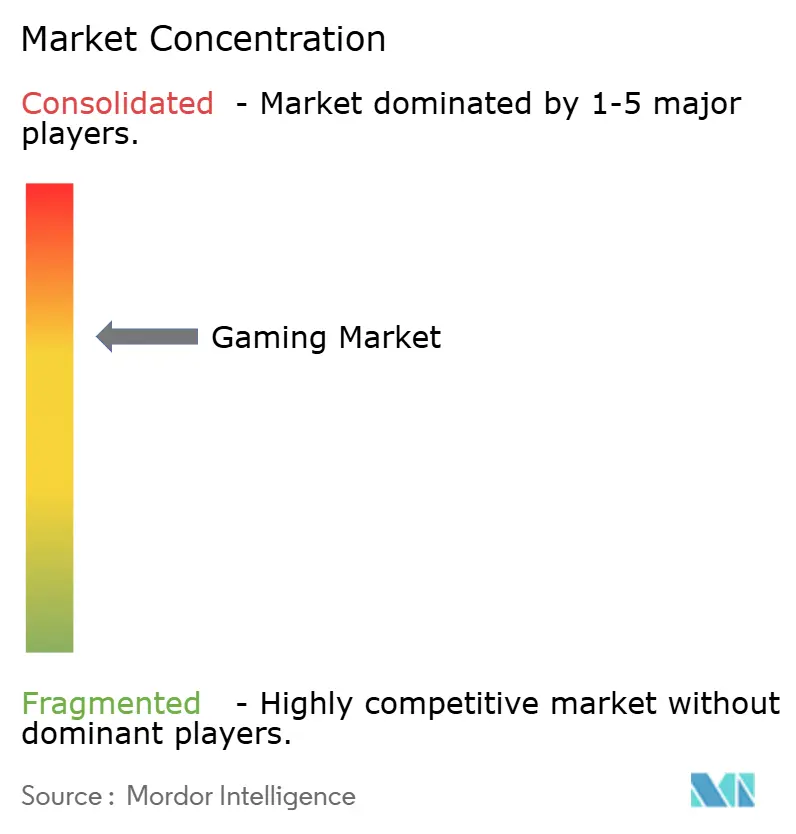
| Market Concentration | Medium |
Major Players
*Disclaimer: Major Players sorted in no particular order Image © Mordor Intelligence. Reuse requires attribution under CC BY 4.0. |
|
Gaming Market Analysis by Mordor Intelligence
The gaming market size stands at USD 265.88 billion in 2025 and is projected to reach USD 435.44 billion by 2030, reflecting a brisk 10.37% CAGR during the forecast period. Rapid mobile adoption, the spread of 5G, and cloud streaming are drawing new participants into every part of the value chain, accelerating revenue diversification and platform convergence. Publishers are deepening live-service features to extend product lifecycles while device makers position gaming as a showcase for next-generation silicon. Subscription catalogues, cloud delivery, and cross-play are broadening access, reinforcing a “play anywhere” mindset that pulls casual and core audiences into the same content universe. At the same time, stricter privacy rules and regional licensing hurdles are forcing companies to refine data strategies and localisation pipelines to protect margins.
Key Report Takeaways
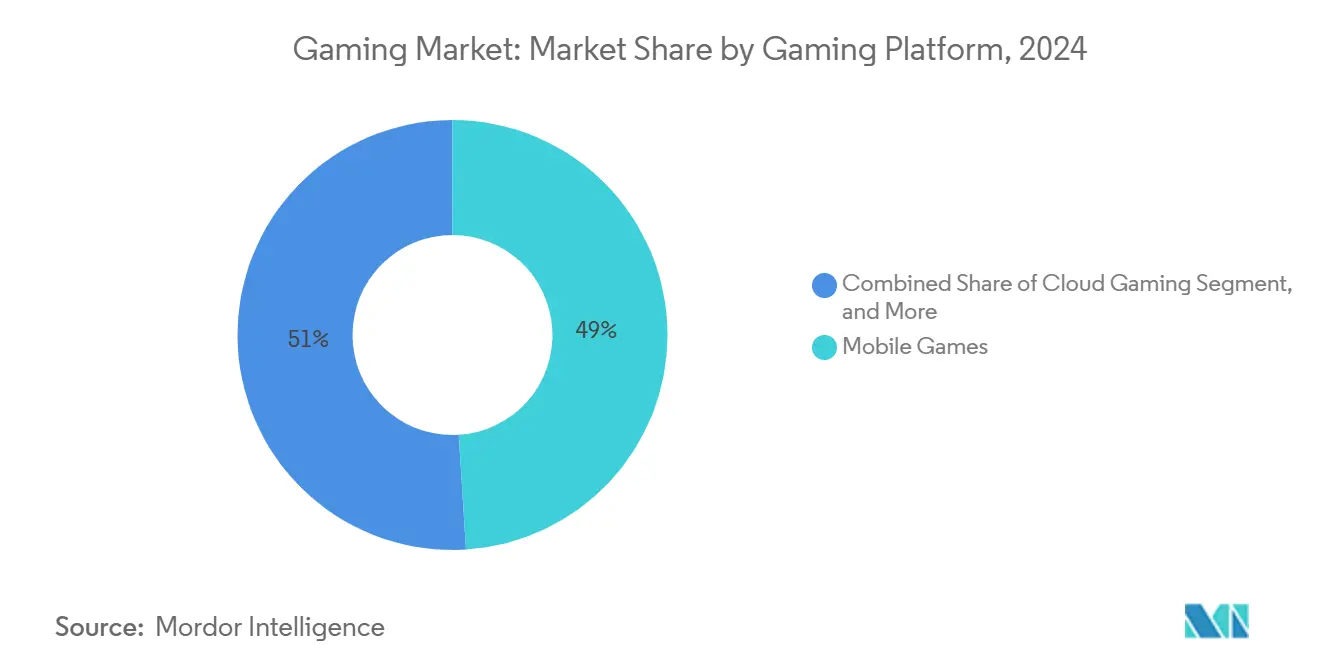
- By gaming platform, mobile accounted for 49% of the gaming market share in 2024, while cloud gaming is forecast to expand at a 34% CAGR to 2030
- By revenue model, free-to-play held 52% of the gaming market size in 2024; subscriptions are advancing at an 18.2% CAGR through 2030.
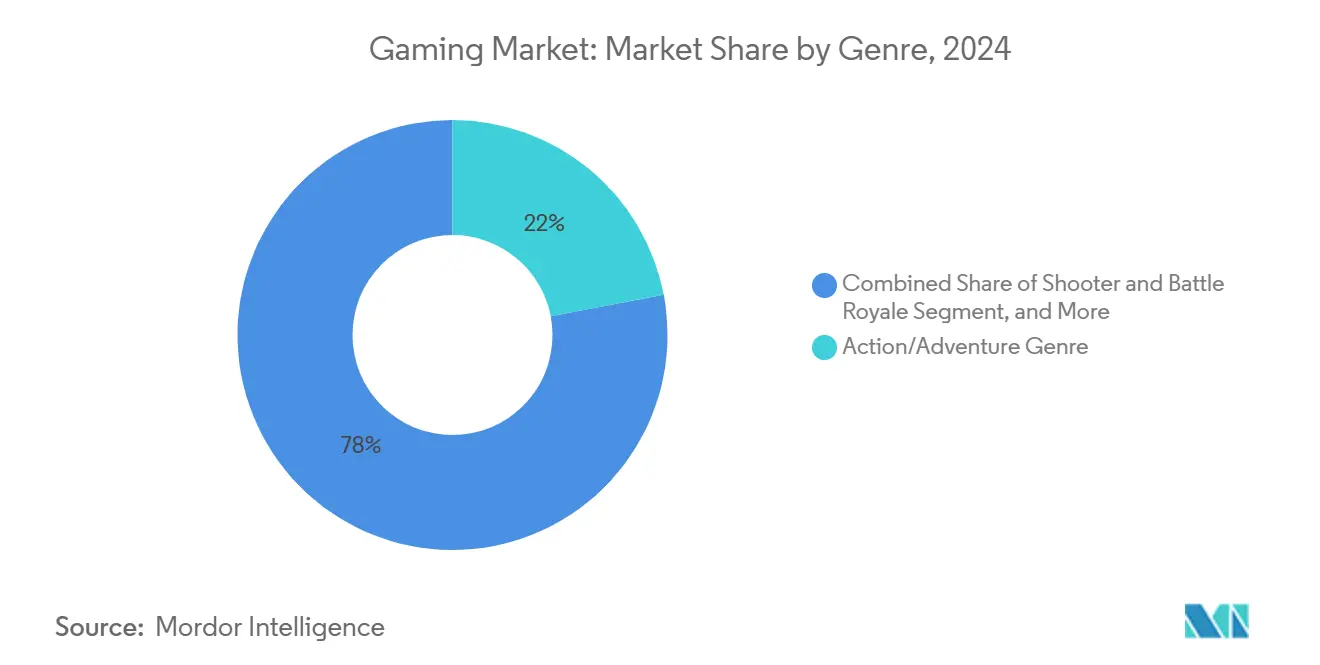
- By genre, action/adventure led with 22% of gaming market share in 2024, whereas battle-royale titles are growing at 12.4% CAGR to 2030
- By player age, the 18-35 cohort commanded 54% share of the gaming market size in 2024; the over-50 segment is expanding at 6.7% CAGR.
- By geography, Asia-Pacific contributed 46% revenue in 2024, and the Middle East and Africa region is on track for a 7.8% CAGR between 2025-2030.
- Microsoft, Sony, Tencent, Nintendo, and NetEase together controlled 43% of 2024 revenues, underscoring a moderately.
Global Gaming Market Trends and Insights
Drivers Impact Analysis
| Driver | (~) % Impact on CAGR Forecast | Geographic Relevance | Impact Timeline |
|---|---|---|---|
| Mobile-first monetisation surge | +3.2% | Global (strongest in Asia-Pacific) | Medium term (2-4 years) |
| 5G-enabled cloud gaming uptake | +2.8% | North America, Europe, developed Asia-Pacific | Medium term (2-4 years) |
| AAA IP trans-media expansion | +1.5% | North America, Europe, Japan | Long term (≥ 4 years) |
| Live-service and in-game advertising growth | +2.1% | Global | Short term (≤ 2 years) |
Source: Mordor Intelligence
Mobile-first monetisation surge
Developers are pivoting from pure in-app purchases toward hybrid models that weave in rewarded ads, season passes, and lightweight subscriptions, allowing higher ARPU without raising friction. Apple’s AdAttributionKit is forcing heavier reliance on first-party datasets, pushing studios to invest in community tools, on-device analytics, and contextual targeting. Tier-1 publishers now release discounted “battle-pass lite” tiers in price-sensitive markets to match local spending power. The shift is most visible in Asia-Pacific, where high-volume free-to-play audiences make even modest ARPU gains meaningful to the gaming market. As gameplay hours intertwine with social feeds, rewarded formats that trade viewing time for in-game currency continue to reduce churn.
5G-enabled cloud gaming uptake
Latency approaching 1 ms and consistent 100 Mbps bandwidth remove the hardware bottleneck that once kept premium titles off thin clients. Operators from Seoul to Paris bundle cloud libraries with 5G data plans, lowering churn and showcasing network [1]Intel Network Builders, “Accelerate 5G Adoption with Cloud Gaming Service,” Intel, intel.com . Edge nodes push frames closer to players, enabling 4K60 streams on mid-range phones and even smart TVs without consoles. Publishers embrace the model to widen reach in Latin America and Africa where console penetration is low yet mobile broadband is rising. This movement underpins momentum for the gaming market as it blends convenience with AAA experiences.
AAA IP trans-media expansion boosting console & PC revenues
Entertainment giants extend franchises such as Tomb Raider and Lord of the Rings into new titles, leveraging film audiences to lift attach rates. Reciprocal deals see popular games feeding shows on streaming services, keeping fans engaged between seasons. Ageing player bases—average gamer age climbed from 33 to 36 in ten years—welcome deeper narrative arcs and cross-platform continuity. Despite Netflix shuttering a high-budget studio, its USD 1 billion mobile push emphasises scalable IP that reinforces subscriber loyalty. This ecosystem thinking improves lifetime value and cushions cyclicality in box-office revenue.
Live-service and in-game advertising revenues
Dynamic content drops, seasonal events, and algorithmic matchmaking are lengthening title lifespans and multiplying microtransaction occasions. Brands integrate interactive billboards and virtual fashion within persistent worlds, creating fresh CPM inventory without pausing gameplay. Unity reports a 40% rise in games shipped with live-ops toolkits, signalling a structural revenue shift. Advertisers value the guaranteed viewability and demographic precision that gaming delivers, helping them offset social-media signal loss after privacy reforms. The outcome is a higher revenue stack for the gaming market while subsidising free access for late-adopter regions.
Restraints Impact Analysis
| Restraint | (~) % Impact on CAGR Forecast | Geographic Relevance | Impact Timeline |
|---|---|---|---|
| China’s strict approval & play-time quotas | −1.2% | China (with global spillover) | Medium term (2-4 years) |
| iOS ATT and privacy rules | −0.9% | Global (strongest in North America, Europe) | Short term (≤ 2 years) |
| Global AAA talent shortage | −0.7% | Worldwide (notably North America, Europe) | Medium term (2-4 years) |
Source: Mordor Intelligence
China’s tight game-approval and play-time quota regime
The National Press and Publication Administration vets every title, and only a few hundred licences clear annually, compressing launch calendars and hurting exposure. Minors remain limited to three hours of play on weekends, capping audience growth rates. A 2024 draft seeking to curb loot boxes triggered a 10.3% Tencent share slide and an abrupt policy rethink, showing how regulatory volatility ripples abroad. Global studios reliant on Chinese spend must hedge with Western releases, localisation tweaks, and state-owned partnerships. Uncertainty continues to weigh on the gaming market outlook in Asia.
iOS ATT and privacy rules inflating user-acquisition costs
Apple’s App Tracking Transparency prompted CPM inflation and reduced install-to-payer precision, forcing publishers toward costlier contextual buys and influencer campaigns. A Georgetown study finds app counts rebounded after an initial dip, yet the mix skews toward brands with deeper wallets. Smaller studios struggle to scale UA efficiently, leading some to refocus on PC storefronts. AdAttributionKit promises richer creative insights but keeps user-level data off-limits, anchoring higher CAC norms. This drag subtracts incremental points from the gaming market CAGR until alternative attribution matures.
Segment Analysis
By Gaming Platform: Cloud access resets distribution models
Cloud services are expanding at a 34% CAGR, making them the fastest-rising slice of the gaming market. Operators stream 4K assets from edge servers, enabling blockbuster sessions on mid-priced phones and Chromebooks. Mobile still contributes the largest revenue at 49% of the gaming market share in 2024, thanks to near-universal smartphone reach across Asia and Latin America.[3]Nadiia Marchynska, “Mobile Gaming in APAC: Opportunities and Challenges,” Global Games Forum, globalgamesforum.com PC and console remain relevant for premium visual quality, but GPU shortages and high upfront costs steer late-adopters toward cloud catalogues bundled with data plans.
The interplay between 5G, cloud rendering, and cross-play makes platform boundaries porous, fostering a single content pipeline that feeds every screen size. Microsoft recorded 150 million hours of Xbox cloud play in one quarter, underscoring adoption momentum. Edge compute costs drop 15% annually, widening margins for hyperscalers that license turnkey solutions to publishers. For the next decade, analysts expect handheld devices powered by streamed compute to anchor subscription uptake, sustaining structural demand for the gaming market.
Note: Segment shares of all individual segments available upon report purchase
By Revenue Model: Subscriptions recalibrate spending habits
Free-to-play formats dominated 2024 with 52% of gaming market size, pairing zero entry fees with cosmetic microtransactions that remain culturally acceptable in most regions. Subscriptions are scaling fastest at 18.2% CAGR as players trade ownership for access to curated catalogues. Xbox Game Pass generated record revenues and lifted PC subscriptions by over 30%, evidencing demand depth. The coexistence of both models highlights consumer segmentation rather than cannibalisation.
Publishers now test tiered passes offering day-one AAA releases, retro libraries, and cloud streaming extras. ScienceDirect research confirms console subs lift lifetime hardware and software spending, extending ecosystem value. Hybridisation emerges as a hedge: hits launch with an upfront premium on PC or console, then pivot to live-service passes after the initial sales curve flattens. This flexibility anchors predictable cash flows for investors tracking the gaming market.
By Genre: Battle-royale ignites multiplayer engagement
Action/adventure titles led 2024 revenue with 22% gaming market share, fuelled by evergreen IP and cross-media marketing. Meanwhile battle-royale continues its breakneck 12.4% CAGR run, as low barrier-to-entry gameplay and spectator-friendly dynamics lock in esports viewers. Multiplayer modes now dominate Steam charts, emphasising social persistence over linear campaigns.
RPG/MMORPG communities maintain durable monetisation via cosmetic drops and seasonal passes that refresh class builds. Sports franchises pivot toward live-rosters and Ultimate Team-style card economies that monetise fandom year-round. Development toolchains allow genre mash-ups; survival elements blend with city-builders to produce fresh loops. This constant experimentation ensures genre diversity, enriching the gaming market and insulating publishers against fatigue cycles.
Note: Segment shares of all individual segments available upon report purchase
By Player Age Group: Silver gamers spur inclusive design
Players aged 18-35 supply 54% spending power yet juggle multiple entertainment choices, nudging studios to add quick-match formats and cross-save features. Under-18s face stricter session caps in China, limiting paid conversions. As a result, teen-centric monetisation leans on cosmetics instead of randomised loot boxes to comply with youth safeguards.
Gamers over 50 represent the swiftest-growing slice at 6.7% CAGR as studies cite cognitive and social benefits from digital play. Interface tweaks—larger fonts, simplified control schemes, adjustable difficulty curves—ease onboarding. Puzzle, simulation, and narrative adventures rank high among this cohort. Dedicated design wins brand affinity and opens healthcare-adjacent revenue opportunities that further enlarge the gaming market.
Geography Analysis
Asia-Pacific generated 46% of 2024 revenue, making it the principal engine for the gaming market. China anchors volumes, Japan and Korea set monetisation benchmarks, and India’s smartphone boom fuels first-time spenders. Regional publishers leverage manga, K-pop, and local payment wallets to deepen engagement.
North America ranks second, combining high ARPU with early cloud-gaming uptake. Microsoft disclosed USD 5.721 billion in quarterly gaming sales, 94% of which stemmed from content and services rather than consoles, underscoring a pivot to recurring revenue [2] Derek Strickland, “PC Game Pass Revenue Up 45%, Xbox Games Now Reach 500 Million MAUs,” TweakTown, tweaktown.com . Esports arenas and collegiate leagues institutionalise competitive pathways, raising sponsorship inflows.
Europe mirrors North American patterns but places sharper scrutiny on data privacy and loot-box mechanics, prompting self-regulation. High-speed fibre coverage and niche hardware PC culture sustain premium price points.
The Middle East and Africa post the fastest regional expansion at 7.8% CAGR. Sovereign wealth funds in Saudi Arabia and the United Arab Emirates invest in esports parks and publishing hubs to diversify beyond hydrocarbons. Localisation teams ensure Arabic voice-overs and culturally resonant skins, driving retention. Latin America edges up, with Brazil as a springboard for Spanish-language rollouts that broaden the gaming market footprint in emerging economies.
Competitive Landscape
Industry powerhouses continue to consolidate IP. Microsoft’s USD 69 billion acquisition of Activision Blizzard thrust it to the top of publisher rankings, adding Call of Duty and King mobile titles to Game Pass. Sony counters by porting first-party hits like The Last of Us to PC, boosting reach without sacrificing hardware loyalty.
NetEase and Tencent extend overseas by investing in European studios and securing minority stakes in console-focused teams, a hedge against domestic regulatory churn. Nintendo maintains premium hardware margins through evergreen IP and successful hybrid console design. Emerging firms exploit AI pipelines to cut environment-art costs by 30%, accelerating indie schedules and injecting fresh creativity into the gaming market.
Privacy reforms and skyrocketing user-acquisition costs tilt the advantage toward companies with strong brands and first-party channels. Apple’s services revenue bump after AT&T illustrates how platform owners monetise policy control, compelling advertisers to rebound on contextual signals. Meanwhile, location-based XR outfits strike licensing pacts with Hollywood to transform vacant retail space into experiential playgrounds, diversifying competitive narratives.
Gaming Industry Leaders
-
Tencent Holdings Ltd.
-
Sony Group Corp.
-
Apple Inc. (App Store gaming)
-
Microsoft Corp.
-
NetEase Inc.
- *Disclaimer: Major Players sorted in no particular order
Need More Details on Market Players and Competitors?
Download PDF
Recent Industry Developments
- May 2025: LEXRA launched to standardise and scale out-of-home XR operations, signalling rising institutional support for location-based gaming .
- May 2025: Microsoft’s PC Game Pass revenue climbed 45% YoY, helping the firm post its strongest Q3 at USD 5.721 billion in gaming .
- March 2025: Netflix shuttered its Southern California AAA studio and shifted resources toward mobile-first development aligned with its streaming.
- January 2025: Xbox Game Pass posted record revenue in fiscal Q2, with PC memberships up more than 30%.
Global Gaming Market Report Scope
The gaming industry is defined based on the revenues generated from the gaming types used across the world. The analysis is based on the market insights captured through primary and secondary. The market also covers the major factors impacting gaming industry growth in terms of drivers and restraints.
The gaming market is segmented by gaming type (mobile games, console games, downloaded/box PC, and e-sports) and key geographies (North America [United States and Canada], Europe [Germany, the United Kingdom, France, Russia, Spain, Italy, and the Rest of Europe], Asia-Pacific [China, Japan, South Korea, India, Taiwan, Indonesia, Australia, and the Rest of Asia-Pacific], Latin America [Brazil, Argentina, Mexico, and the Rest of Latin America], and the Middle East and Africa [the United Arab Emirates, Saudi Arabia, Iran, Egypt, Turkey, Israel, and the Rest of the Middle East and Africa]). The gaming market share, spending and forecasts are provided in terms of value (USD), in addition to gamer demographics such as gender, gamer population, and genre.
| By Gaming Platform | Mobile Games | ||
| PC Games (Downloaded/Box and Browser) | |||
| Console Games | |||
| Cloud Gaming | |||
| VR/AR Gaming | |||
| By Revenue Model | Free-to-Play (F2P) | ||
| Pay-to-Play / Premium | |||
| Subscription and Game-Pass | |||
| By Genre | Action/Adventure | ||
| Shooter and Battle Royale | |||
| Role-Playing (RPG/MMORPG) | |||
| Sports and Racing | |||
| Others | |||
| By Player Age Group | <18 Years | ||
| 18-35 Years | |||
| 36-50 Years | |||
| >50 Years | |||
| By Geography | North America | United States | |
| Canada | |||
| Mexico | |||
| South America | Brazil | ||
| Argentina | |||
| Rest of South America | |||
| Europe | Germany | ||
| United Kingdom | |||
| France | |||
| Italy | |||
| Spain | |||
| Rest of Europe | |||
| Asia-Pacific | China | ||
| Japan | |||
| South Korea | |||
| India | |||
| Australia | |||
| New Zealand | |||
| Rest of Asia-Pacific | |||
| Middle East and Africa | United Arab Emirates | ||
| Saudi Arabia | |||
| South Africa | |||
| Rest of Middle East and Africa | |||
By Gaming Platform
| Mobile Games |
| PC Games (Downloaded/Box and Browser) |
| Console Games |
| Cloud Gaming |
| VR/AR Gaming |
By Revenue Model
| Free-to-Play (F2P) |
| Pay-to-Play / Premium |
| Subscription and Game-Pass |
By Genre
| Action/Adventure |
| Shooter and Battle Royale |
| Role-Playing (RPG/MMORPG) |
| Sports and Racing |
| Others |
By Player Age Group
| <18 Years |
| 18-35 Years |
| 36-50 Years |
| >50 Years |
By Geography
| North America | United States |
| Canada | |
| Mexico | |
| South America | Brazil |
| Argentina | |
| Rest of South America | |
| Europe | Germany |
| United Kingdom | |
| France | |
| Italy | |
| Spain | |
| Rest of Europe | |
| Asia-Pacific | China |
| Japan | |
| South Korea | |
| India | |
| Australia | |
| New Zealand | |
| Rest of Asia-Pacific | |
| Middle East and Africa | United Arab Emirates |
| Saudi Arabia | |
| South Africa | |
| Rest of Middle East and Africa |
Need A Different Region or Segment?
Customize Now
Key Questions Answered in the Report
What is the current Gaming Market size?
In 2025, the Gaming Market size is expected to reach USD 269.06 billion.
Who are the key players in Gaming Market?
Sony Corporation, Microsoft Corporation, Apple Inc., Realnetworks LLC (Gamehouse) and Bandai Namco Holdings Inc are the major companies operating in the Gaming Market.
Which is the fastest growing region in Gaming Market?
Asia Pacific is estimated to grow at the highest CAGR over the forecast period (2025-2030).
Which region has the biggest share in Gaming Market?
In 2025, the Middle East and Africa accounts for the largest market share in Gaming Market.
What years does this Gaming Market cover, and what was the market size in 2024?
In 2024, the Gaming Market size was estimated at USD 241.70 billion. The report covers the Gaming Market historical market size for years: 2019, 2020, 2021, 2022, 2023 and 2024. The report also forecasts the Gaming Market size for years: 2025, 2026, 2027, 2028, 2029 and 2030.

