Flow Cytometry Market Size and Share
Market Overview
| Study Period | 2020 - 2031 |
|---|---|
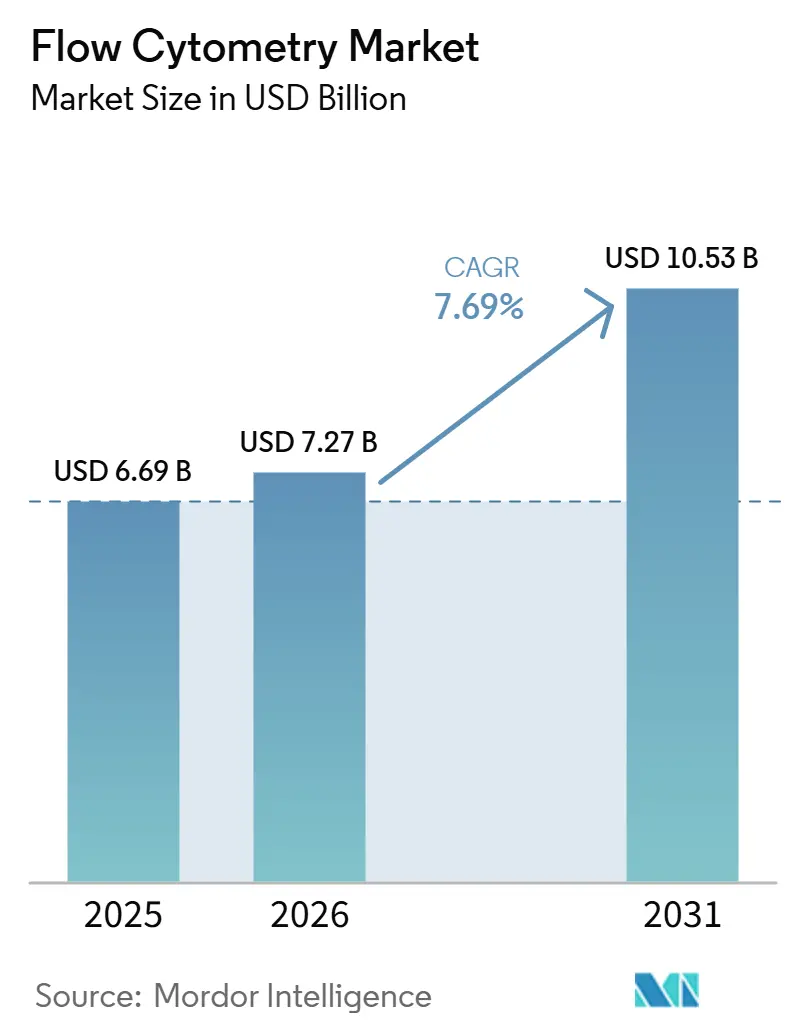
| Market Size (2026) | USD 7.27 Billion |
| Market Size (2031) | USD 10.53 Billion |
| Growth Rate (2026 - 2031) | 7.69% CAGR |
| Fastest Growing Market | Asia-Pacific |
| Largest Market | North America |
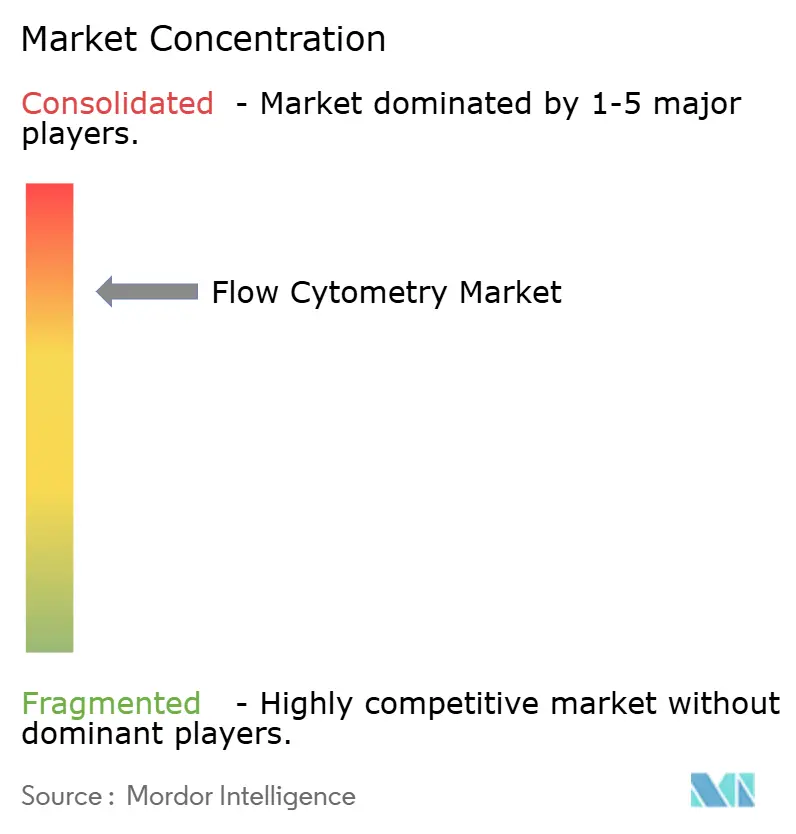
| Market Concentration | High |
Major Players*Disclaimer: Major Players sorted in no particular order Image © Mordor Intelligence. Reuse requires attribution under CC BY 4.0. | |
Flow Cytometry Market Analysis by Mordor Intelligence
The Flow Cytometry Market size is projected to be USD 6.69 billion in 2025, USD 7.27 billion in 2026, and reach USD 10.53 billion by 2031, growing at a CAGR of 7.69% from 2026 to 2031.
High-parameter spectral platforms, cloud-native analytics that comply with General Data Protection Regulation requirements, and closed-system sorters for cell-therapy manufacturing are the primary forces widening clinical and research adoption. Artificial-intelligence-guided spectral unmixing now compresses minimal residual disease (MRD) turnaround from 48 hours to less than 12 hours, a productivity leap that reshapes core-laboratory economics. Closed-system sorters eliminate open-air exposure during CAR-T production and cut batch-failure rates by 40% in Good Manufacturing Practice (GMP) suites. Meanwhile, Europe’s In Vitro Diagnostic Regulation (IVDR) re-registration backlog restricts antibody catalog breadth, shifting procurement toward vendors with larger compliance budgets.
Key Report Takeaways
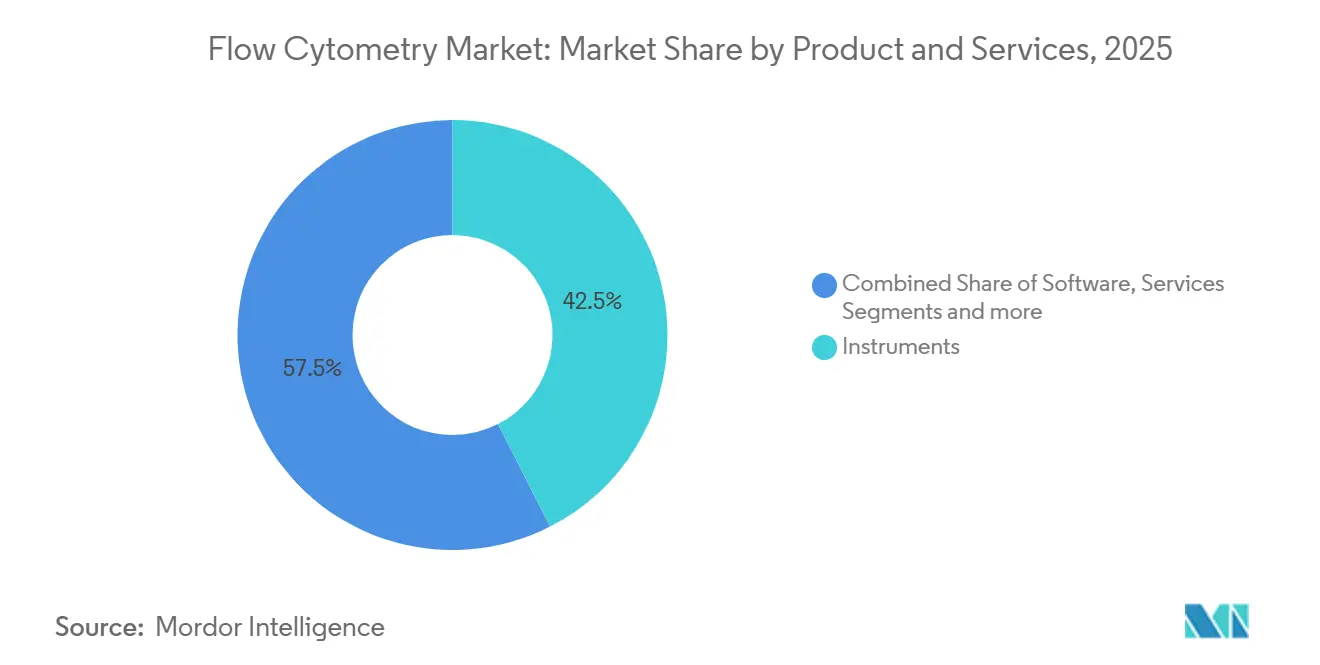
- By product & service, instruments led with 42.55% revenue share in 2025, while software posted the fastest 13.25% CAGR through 2031.
- By technology, cell-based platforms captured 65.53% of the flow cytometry market share in 2025, and imaging flow cytometry is forecast to expand at a 15.85% CAGR to 2031.
- By application, clinical diagnostics accounted for 30.63% of the flow cytometry market size in 2025, whereas stem-cell therapy advances at a 12.87% CAGR to 2031.
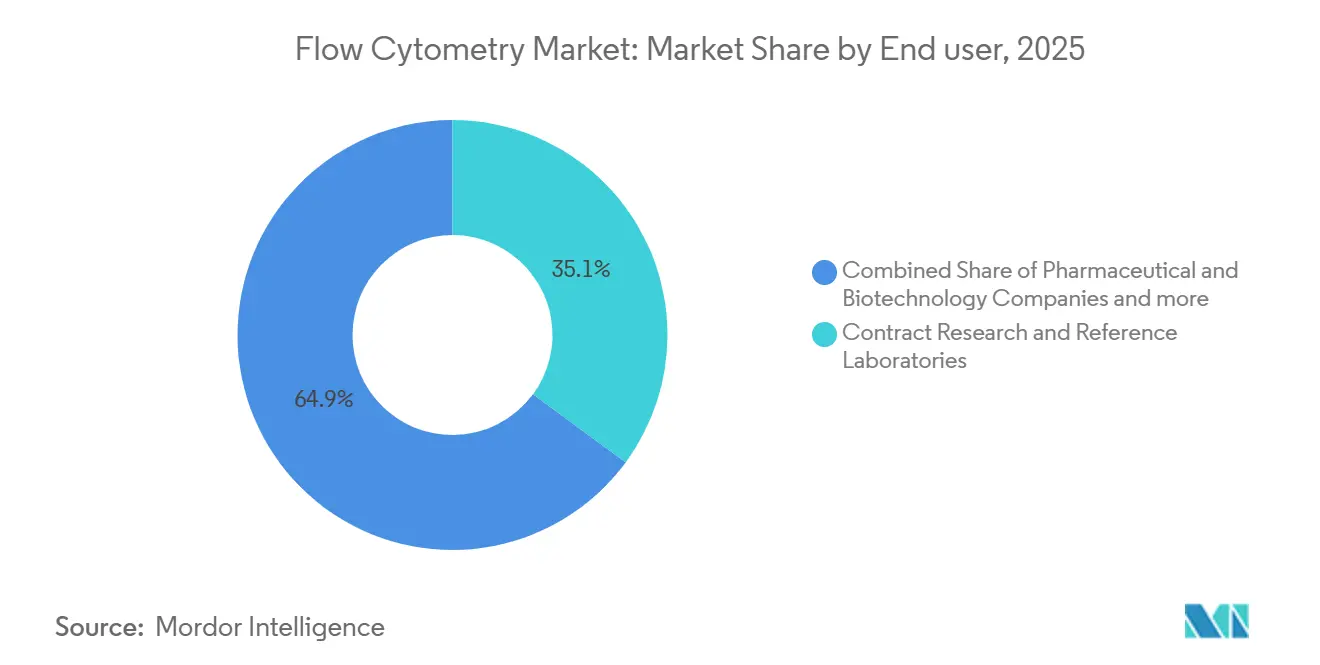
- By end user, contract research and reference laboratories held 35.13% share in 2025, and pharmaceutical & biotechnology companies record the highest 14.7% CAGR through 2031.
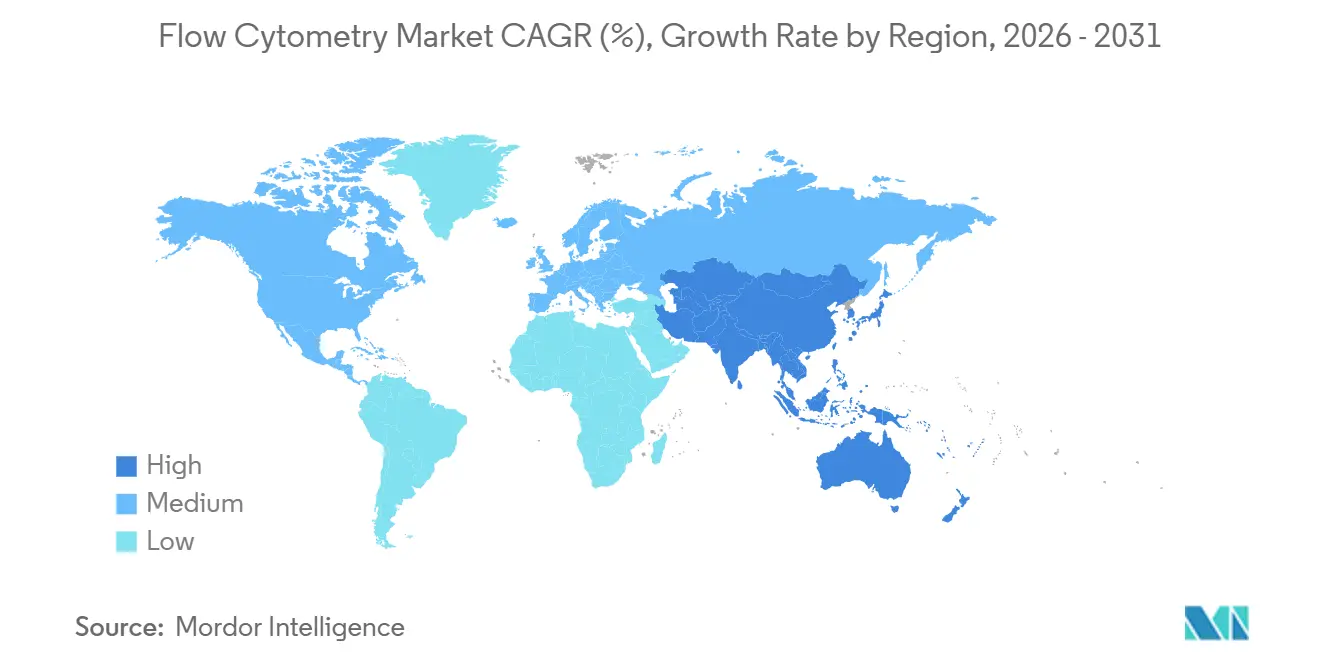
- By geography, North America commanded 41.13% of revenue in 2025; Asia-Pacific is projected to be the fastest-growing region at a 12.51% CAGR to 2031.
Note: Market size and forecast figures in this report are generated using Mordor Intelligence’s proprietary estimation framework, updated with the latest available data and insights as of January 2026.
Global Flow Cytometry Market Trends and Insights
Driver Impact Analysis*
| Driver | (~) % Impact on CAGR Forecast | Geographic Relevance | Peak Impact |
|---|---|---|---|
| Stem-cell & regenerative-medicine workflows adopt closed-system cytometers | +1.8% | Global, with concentration in North America & Europe | Medium term (2-4 years) |
| Clinical diagnostics adoption of spectral cytometers for minimal residual disease | +2.1% | North America, Europe, Asia-Pacific (Japan, South Korea) | Short term (≤ 2 years) |
| AI-guided spectral unmixing & auto-gating shortens core-lab turnaround | +1.5% | Global, early adoption in North America & Western Europe | Short term (≤ 2 years) |
| Point-of-care microfluidic cytometers penetrate emerging markets | +0.9% | Asia-Pacific (India, Southeast Asia), Middle East & Africa | Long term (≥ 4 years) |
| Multi-parametric immuno-oncology panels spur high-parameter purchases | +1.6% | North America, Europe, Asia-Pacific (China, Japan) | Medium term (2-4 years) |
| GDPR/IVDR-ready cloud analytics platforms expand across Europe | +1.2% | Europe, with spillover to Middle East & select APAC markets | Medium term (2-4 years) |
| Source: Mordor Intelligence | |||
Stem-Cell & Regenerative-Medicine Workflows Adopt Closed-System Cytometers
Allogeneic developers now mandate closed-system sorters, such as the MACSQuant Tyto and AQUIOS STEM, to isolate CD34+ cells without ambient exposure, following FDA guidance linking open-air sorting to contamination in clinical-grade batches. Contract development organizations report 40% fewer failed lots, cutting autologous CAR-T manufacturing from 21 days to 16 days, a time saving that directly affects patient backlog. Regenerative-medicine projects, including osteoarthritis trials employing mesenchymal stromal cells, now account for 18% of new sorter placements, up from 11% in 2023. Vendors able to retrofit legacy jet-in-air systems with disposable fluidics gain an advantage, while smaller firms struggle to finance the redesign needed for GMP compliance. In regions where reimbursement lags, hospitals consider reagent-rental contracts to offset cap-ex outlays for closed-system upgrades.
Clinical Diagnostics Adoption of Spectral Cytometers for Minimal Residual Disease
Spectral analyzers detect one leukemic cell among 1 million healthy cells, a sensitivity conventional instruments cannot match without multiple tubes. Thermo Fisher introduced the Attune Xenith in 2025, resolving 24-color panels in a single run and eliminating sequential staining that once consumed two working days. U.S. reimbursement now covers 19-color MRD panels at USD 487, making spectral instruments economic for community oncology centers. Cytek’s Aurora Evo doubles acquisition speed to 70,000 events per second, enabling reference labs to process 120 MRD samples per 8-hour shift. As guidelines from the European Society for Medical Oncology endorsed spectral flow for MRD in acute lymphoblastic leukemia, procurement cycles accelerated across Germany, France, and the United Kingdom.
AI-Guided Spectral Unmixing & Auto-Gating Shorten Core-Lab Turnaround
Machine-learning models trained on 500,000 annotated files now auto-gate with 97.3% concordance to expert cytometrists, validated in a multi-center trial. BD’s FACSuite integrated convolutional neural networks in 2024, allowing 96-well drug-screening plates to be processed in 18 hours rather than 72. Beckman Coulter’s CytExpert AI corrects autofluorescence in primary cells, a task once requiring manual fine-tuning, and cuts per-sample analysis cost by 35%, enabling contract research organizations to underbid academic cores for pharma projects. Draft FDA software-as-a-medical-device guidance in 2024 raises the regulatory bar, but established vendors see it as a moat protecting market share.
Multi-Parametric Immuno-Oncology Panels Spur High-Parameter Purchases
Immuno-oncology trials now profile 28 surface markers plus six cytokines per tube to assess tumor-infiltrating lymphocytes, driving demand for 40-parameter instruments such as Sony’s ID7000, which captured 22% of 1H 2025 R&D placements. The American Association for Cancer Research recommends 24-color minimal panels for CAR-T persistence, standardizing requirements and shortening vendor sales cycles. High-parameter reagent kits bundling 20+ antibodies represent 31% of consumables today, up from 19% in 2023, reflecting laboratories’ preference for validated panels that compress development timelines. Pharmaceutical sponsors increasingly include high-parameter pharmacodynamic readouts in Phase I submissions, prompting early instrument procurement during preclinical scale-up. The trend is global, with China’s domestic manufacturers undercutting imported systems by up to 40% on capital cost.
Restraint Impact Analysis*
| Restraint | (~) % Impact on CAGR Forecast | Geographic Relevance | Peak Impact |
|---|---|---|---|
| Shortage of skilled cytometrists shifts testing to reference labs | -1.3% | North America, Europe | Short term (≤ 2 years) |
| EU MDR / IVDR reagent registration delays | -0.9% | Europe, with indirect effects on global supply chains | Short term (≤ 2 years) |
| Capital cost of image-enabled spectral sorters | -0.7% | Global, most acute in emerging markets and mid-tier institutions | Medium term (2-4 years) |
| Cyber-security & data-sovereignty concerns in government hospitals | -0.5% | Europe (GDPR), Asia-Pacific (China, India), Middle East | Medium term (2-4 years) |
| Source: Mordor Intelligence | |||
Shortage of Skilled Cytometrists Shifts Testing to Reference Labs
Certified cytometrist vacancies reached 23% across North America and Europe in 2024, forcing many community hospitals to outsource immunophenotyping to regional reference laboratories. Training requires up to 24 months, a lag that cannot keep pace with post-pandemic testing surges. Quest Diagnostics and LabCorp added 40% more spectral capacity across their networks during 2024-2025, absorbing routine CD4 counts and leukemia panels formerly done in-house. Median salaries for experienced technologists rose to USD 98,000 in 2025, yet retirements outpaced new certifications, keeping vacancy rates high. Vendors now bundle remote-support contracts, but these add USD 25,000–40,000 in annual fees that smaller hospitals struggle to justify.
EU MDR / IVDR Reagent Registration Delays
The May 2025 IVDR deadline forced antibody makers to submit rigorous technical files, a burden that smaller firms could not meet, leaving 18% of catalogs unavailable in the EU. Bio-Rad reported EUR 12 million (USD 13 million) in lost half-year revenue from backlogs, while BD and Beckman Coulter maintained supplies but raised prices by up to 12% to recoup compliance costs[1]Bio-Rad Laboratories, “Q2 2025 Earnings Call Transcript,” bio-rad.com . Some academic labs switched to research-use-only reagents, complicating clinical validation and delaying publications. The European Medicines Agency requires CE-IVDR marks for companion diagnostic panels in oncology trials, forcing three sponsors to re-source mid-trial and extend timelines by six months. Laboratories in Italy and Spain now stage reagent inventories four months ahead to buffer against future certification bottlenecks.
*Our forecasts treat driver/restraint impacts as directional, not additive. The impact forecasts reflect baseline growth, mix effects, and variable interactions.
Segment Analysis
By Product & Service: Instruments Lead While Software Surges
Instruments held the largest 42.55% revenue share in 2025, reflecting budget cycles favoring spectral sorters with imaging modules and acoustic-focusing chambers. Reagents and consumables provide recurring revenue, with high-parameter immuno-oncology kits now accounting for 31% of consumables, stabilizing vendor cash flow even as capital spending fluctuates. Software is the fastest-growing element, advancing at a 13.25% CAGR to 2031 as cloud-native analytics with auto-gating engines and GDPR-compliant data residency penetrate multi-site trials JIM. Installation and remote-support contracts offset local cytometrist shortages, cutting downtime by 60% but adding notable annual operating fees.
Cell analyzer shipments dominate clinical diagnostics because regulatory clearance and throughput are paramount, while sorters dominate R&D budgets that require rare-cell isolation for downstream omics. Antibody supply disruptions such as the 2024 European conjugation-facility fire highlight the value of diversified supply chains and validated substitute clones. Dyes, beads, and compensation controls certified under ISO 17034 accelerate quality-control workflows in GMP environments. Pre-optimized MRD or CAR-T characterization panels now cut assay development from six months to four weeks, supporting aggressive clinical timelines.


By Technology: Cell-Based Dominates, Imaging Accelerates
Cell-based assays constituted 65.53% of revenue in 2025, anchored by immunophenotyping and apoptosis applications across diagnostics and research. Imaging flow cytometry, though smaller, grows at a 15.85% CAGR, propelled by pharmaceutical demand for morphology-based rare-cell detection in antibody-drug conjugate internalization studies. Bead-based multiplex flow remains important in high-plex immunoassays but faces competition from planar arrays offering higher throughput at lower cost. Acoustic-focusing cytometers reduce sheath-fluid consumption by 70%, appealing to laboratories in regions with water constraints.
Japan’s fast-track pathway for imaging platforms used in circulating tumor-cell enumeration provides domestic vendors a nine-month time-to-market lead over Western competitors. Imaging cytometry’s USD 400,000–600,000 capital cost limits broader adoption, creating a two-tier market between research-intensive centers and mid-tier hospitals. The flow cytometry market size for imaging platforms is forecast to exceed USD 1.6 billion by 2031, reflecting the modality’s rapid expansion into oncology and gene-therapy workflows.
By Application: Clinical Diagnostics Anchors While Stem-Cell Therapy Surges
Clinical diagnostics maintained a 30.63% share in 2025, largely driven by MRD testing reimbursed at USD 487 per panel in the United States, and sustained CD4/CD8 monitoring in HIV care. Oncology accounted for 42% of diagnostic revenue, hematology for 28%, and infectious disease monitoring for 18%. Stem-cell therapy and regenerative medicine, however, will post the fastest 12.87% CAGR, owing to allogeneic pipelines that require high-purity CD34+ enrichment using closed-system sorters. Organ-transplant monitoring rebounded as kidney and liver procedures surpassed pre-pandemic levels, driving 11% segment growth in 2025.
Drug-discovery groups leverage 40-parameter panels to evaluate bispecific antibody engagement on CD8+ cells, a pharmacodynamic readout now routinely requested by regulators. Immunology labs benefit from expanded detector arrays that dissect regulatory T-cell subsets, improving resolution of complex autoimmune phenotypes. Niche applications such as phytoplankton enumeration and transgenic plant sorting collectively held 7% of revenue in 2025, showing the technology’s versatility.
By End User: Contract Labs Lead While Pharma Accelerates
Contract research and reference laboratories captured 35.13% revenue in 2025, buoyed by hospital outsourcing driven by cytometrist shortages. Pharmaceutical and biotechnology firms represent the fastest-growing cohort, expanding at a 14.7% CAGR as antibody-discovery and CAR-T manufacturing migrate in-house. Hospitals and clinics, accounting for 22% of 2025 revenue, face competing capital priorities and increasingly sign five-year leasing pacts that include technology refresh options. Government institutes and environmental agencies make up the balance, favoring rugged, field-deployable analyzers that operate in non-traditional laboratory spaces.
The flow cytometry market size for pharmaceutical and biotechnology users is projected to reach USD 3.4 billion by 2031, reflecting aggressive internalization of high-parameter assays in oncology and gene-therapy pipelines. Conversely, the flow cytometry market share of contract labs will erode slightly as new hospital hires gradually ease skill shortages, though outsourcing remains a structural feature in rural regions.
Geography Analysis
North America led with 41.13% revenue in 2025, underpinned by Medicare’s 19-color MRD reimbursement code and multibillion-dollar pharmaceutical R&D spend that favors high-parameter cytometry[2]Centers for Medicare & Medicaid Services, “Clinical Laboratory Fee Schedule 2025,” cms.gov. The United States alone invested USD 102 billion in drug discovery during 2024, creating strong demand for spectral analyzers in early-stage oncology trials. Canada’s provincial systems centralized MRD testing by installing 12 spectral instruments in Ontario and British Columbia, improving access in remote communities. Mexico’s INCAN upgraded to imaging platforms to support domestic CAR-T trials, positioning itself as a regional cell-therapy hub.
Asia-Pacific is the fastest-growing region, with a 12.51% CAGR, driven by China’s approvals for locally built spectral systems priced 30% below imports. Mindray captured 9% of Chinese placements in 2025 through reagent-rental bundles that lock per-test costs for three years. India’s government oncology centers added 14 high-parameter analyzers to execute 2 million planned leukemia screens annually by 2027. Japan fast-tracked the development of imaging cytometry for circulating tumor cells, giving domestic firms a head start across Asia.
Europe, in IVDR transition, faces catalog backlogs but remains a premium instrument market. German university hospitals spent EUR 18 million upgrading spectral sorters for CAR-T studies. The United Kingdom consolidated flow services into seven hubs, trimming MRD cost per test by 22%. France approved six new spectral platforms, intensifying competition and sinking average selling prices by 8%. Italy and Spain prioritize reagent cost containment, delaying high-parameter upgrades unless tied to transplant programs.
Middle East & Africa installed 22 spectral analyzers across Saudi Arabia and the United Arab Emirates to bolster national cancer registries. South America faces currency headwinds; Brazil’s public laboratories shift toward reagent-rental to offset cap-ex. Overall, regional policy support and local manufacturing capacity increasingly define adoption trajectories, creating differentiated growth curves across continents.

Competitive Landscape
The market is moderately consolidated. BD’s planned USD 17.5 billion divestiture of its Biosciences unit to Waters, announced in April 2025, exemplifies portfolio rationalization among incumbents. Cytek’s Aurora Evo seized 22% of newly installed spectral analyzers in pharma R&D during 1H 2025, demonstrating that performance gains can quickly shift share even in a capital-intensive segment. Patent filings for AI-based gating grew 34% in 2024, with Beckman Coulter, Thermo Fisher, and Sony submitting 47 applications combined, underscoring software differentiation.
Niche entrants pursue microfluidic point-of-care devices for low-resource settings. NanoCellect’s WOLF sorter runs on disposable chips at one-tenth operating cost, attracting interest from academic vaccine centers. Standard BioTools pivoted toward spatial proteomics, integrating flow data with tissue imaging to create multi-omic dashboards for oncology drug development. Vendors with ISO 13485 accreditation win GMP cell-therapy contracts, as smaller firms struggle with USD 2–5 million quality-system investments. Cyberattacks in 2024 prompted FDA cybersecurity guidance that now factors heavily in hospital tenders, adding another barrier for newcomers.
White-space opportunities persist in microfluidic HIV CD4 testing across sub-Saharan Africa, yet regulatory clarity remains elusive, slowing venture funding. Overall, competition centers on detector channel count, AI accuracy, and service coverage, with pricing pressures most acute in Europe where IVDR compliance raises costs yet buyers face tight budgets.
Flow Cytometry Industry Leaders
Sysmex Corporation
Becton, Dickinson and Company
DANAHER corporation (Beckman Coulter, Inc.)
Bio-Rad Laboratories Inc.
Luminex Corporation
- *Disclaimer: Major Players sorted in no particular order

Recent Industry Developments
- December 2025: BD and the University of Pennsylvania’s Institute for Immunology and Immune Health partnered to co-develop a high-parameter whole-blood panel incorporating phosphorylation markers for drug-response profiling.
- May 2025: Thermo Fisher launched the spectral Invitrogen Attune Xenith cytometer, automating 24-color workflows for immunology and immuno-oncology researchers.


Research Methodology Framework and Report Scope
Market Definitions and Key Coverage
Our study defines the global flow cytometry market as all laser, impedance, or acoustic-focused instruments, reagents, software, and paid services that enable single-cell analysis and sorting across research, clinical, and industrial workflows. According to Mordor Intelligence, accessories bundled at installation or sold for workflow optimization are counted within the revenue pool.
We exclude purely image-based cytometers that never use a hydrodynamic flow stream.
Segmentation Overview
- By Product & Service
- Instruments
- Cell Analyzers
- Cell Sorters
- Reagents & Consumables
- Antibodies
- Dyes & Beads
- Kits & Panels
- Software
- Services
- Instruments
- By Technology
- Cell-Based Flow Cytometry
- Bead-Based Flow Cytometry
- Imaging Flow Cytometry
- Acoustic-Focusing Flow Cytometry
- By Application
- Clinical Diagnostics
- Oncology
- Hematology
- Infectious Diseases
- Organ Transplantation
- Drug Discovery & Development
- Stem-Cell Therapy & Regenerative Medicine
- Immunology
- Other Applications
- Clinical Diagnostics
- By End-User
- Hospitals & Clinics
- Pharmaceutical & Biotechnology Companies
- Contract Research & Reference Laboratories
- Other End-Users
- By Geography
- North America
- United States
- Canada
- Mexico
- Europe
- Germany
- United Kingdom
- France
- Italy
- Spain
- Rest of Europe
- Asia-Pacific
- China
- Japan
- India
- South Korea
- Australia
- Rest of Asia-Pacific
- Middle East & Africa
- GCC
- South Africa
- Rest of Middle East & Africa
- South America
- Brazil
- Argentina
- Rest of South America
- North America
Detailed Research Methodology and Data Validation
Primary Research
Mordor analysts interviewed laboratory directors, hematopathologists, reagent product managers, and procurement leads across North America, Europe, and Asia-Pacific. These talks confirmed installed analyzer counts, reagent pull-through rates, and upcoming capital budgets, letting us refine assumptions and validate early findings.
Desk Research
We began with structured desk work that pulled data from the World Health Organization's GLOBOCAN cancer series, the Centers for Medicare and Medicaid Services procedure files, Eurostat trade codes, and the International Society for Advancement of Cytometry. Regulatory filings in the U.S. FDA 510(k) database and peer-reviewed papers on PubMed mapped technology adoption. Company 10-K reports, investor decks, and curated news feeds from Dow Jones Factiva and D&B Hoovers enriched price bands and shipment clues.
In a second pass, our team retrieved import-export lines from Volza, patent families from Questel, and contract notices in Tenders Info, and then reconciled overlaps before modeling. This list is not exhaustive; many other sources supported data checks and clarification.
Market-Sizing & Forecasting
We applied an integrated top-down and selective bottom-up approach. Starting with production, trade, and installed-base statistics, we rebuilt the global analyzer stock and attached average selling prices and yearly reagent usage to reach the 2025 revenue baseline. Supplier roll-ups and distributor checks validated totals. Core variables include new analyzer shipments, reagent pull-through per test, oncology testing prevalence, stem-cell therapy trial starts, and laboratory capital spending. Multivariate regression, guided by primary-research consensus, projects growth to 2030, while scenario analysis captures reimbursement or regulatory shocks. Gaps in granular shipments were bridged with regional average price-volume proxies gathered during interviews.
Data Validation & Update Cycle
We ensure each draft output passes variance screening, peer review, and senior analyst sign-off. Analysts compare model signals with independent metrics, revisit sources when anomalies surface, and refresh the report annually, issuing interim updates after material events so clients always receive a current view.
Why Mordor's Flow Cytometry Baseline Commands Confidence
Published numbers often differ because firms slice the market in unique ways and refresh at varied cadences, a reality we flag early for clients.
Key gap drivers include competitors omitting imaging or acoustic-focused systems, locking exchange rates to the prior year, or assuming flat reagent usage. This is where Mordor's methodology stands apart; our cadence ties every refresh to new incidence data, real-time ASP shifts, and interview-verified utilization patterns.
Benchmark comparison
| Market Size | Anonymized source | Primary gap driver |
|---|---|---|
| USD 6.75 B (2025) | Mordor Intelligence | None |
| USD 4.68 B (2024) | Global Consultancy A | Narrower product set; imaging and acoustic platforms excluded |
| USD 6.16 B (2024) | Industry Association B | Single-scenario forecast and fixed 2023 currency rates |
| USD 5.71 B (2024) | Trade Journal C | Relies on voluntary disclosures with no reagent pull-through adjustment |
In sum, because we triangulate multiple variables, validate them with frontline practitioners, and refresh swiftly, Mordor's flow cytometry baseline delivers a balanced, transparent, and repeatable reference for decision-makers.


Key Questions Answered in the Report
What was the flow cytometry market size in 2026 and how fast is it growing?
The flow cytometry market size reached USD 7.27 billion in 2026 and is projected to grow at a 7.69% CAGR to 2031.
Which product category is expanding the fastest?
Software is the fastest-growing category, advancing at a 13.25% CAGR through 2031 as cloud-native analytics with AI-based auto-gating gain adoption.
Why are spectral cytometers preferred for minimal residual disease testing?
Spectral instruments detect one leukemic cell among 1 million normal cells, enabling highly sensitive 19-color MRD panels now reimbursed in the United States.
Which region will add the most future demand?
Asia-Pacific is forecast to grow at a 12.51% CAGR as China and India invest in high-parameter cytometry for oncology programs.
How are staffing shortages affecting test volumes?
A 23% vacancy rate for certified cytometrists is pushing community hospitals to outsource immunophenotyping to reference laboratories with larger talent pools.
What hurdle does the EU IVDR pose to vendors?
Antibody makers must file extensive technical documentation, and backlogs have already left about 18% of catalogs temporarily unavailable in Europe.
Page last updated on:


