Market Overview
| Study Period | 2018 - 2031 |
|---|---|
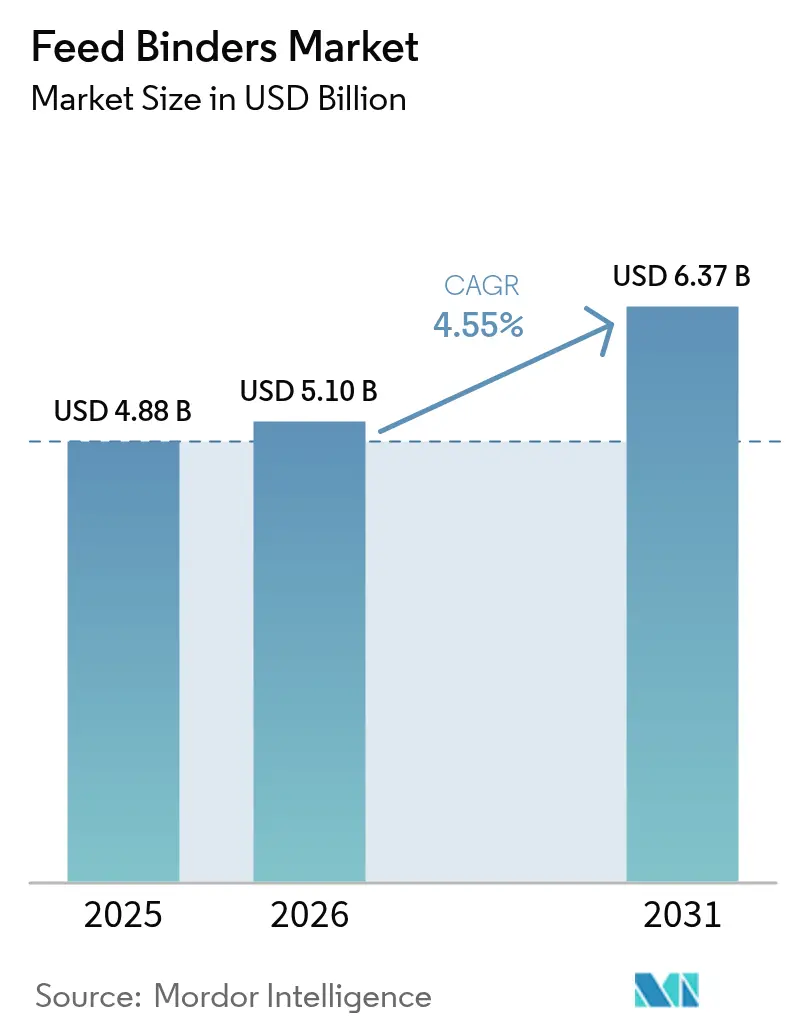
| Market Size (2026) | USD 5.1 Billion |
| Market Size (2031) | USD 6.37 Billion |
| Growth Rate (2026 - 2031) | 4.55% CAGR |
| Fastest Growing Market | Asia Pacific |
| Largest Market | Asia Pacific |
| Market Concentration | Low |
Major Players *Disclaimer: Major Players sorted in no particular order Image © Mordor Intelligence. Reuse requires attribution under CC BY 4.0. | |
Feed Binders Market Analysis by Mordor Intelligence
The feed binders market size in 2026 is estimated at USD 5.1 billion, growing from 2025 value of USD 4.88 billion with 2031 projections showing USD 6.37 billion, growing at 4.55% CAGR over 2026-2031. Rising protein consumption in emerging economies, a shift toward industrial animal farming, and stricter feed quality norms have positioned pellet durability as a critical performance metric. Major compound feed mills are scaling to more than 30 metric tons per hour, and this industrial scale favors premium natural binders that withstand higher temperature and pressure settings. At the same time, water-stable formulations command premiums in aquaculture, and sustainability concerns are steadily redirecting demand toward bio-based solutions.
Key Report Takeaways
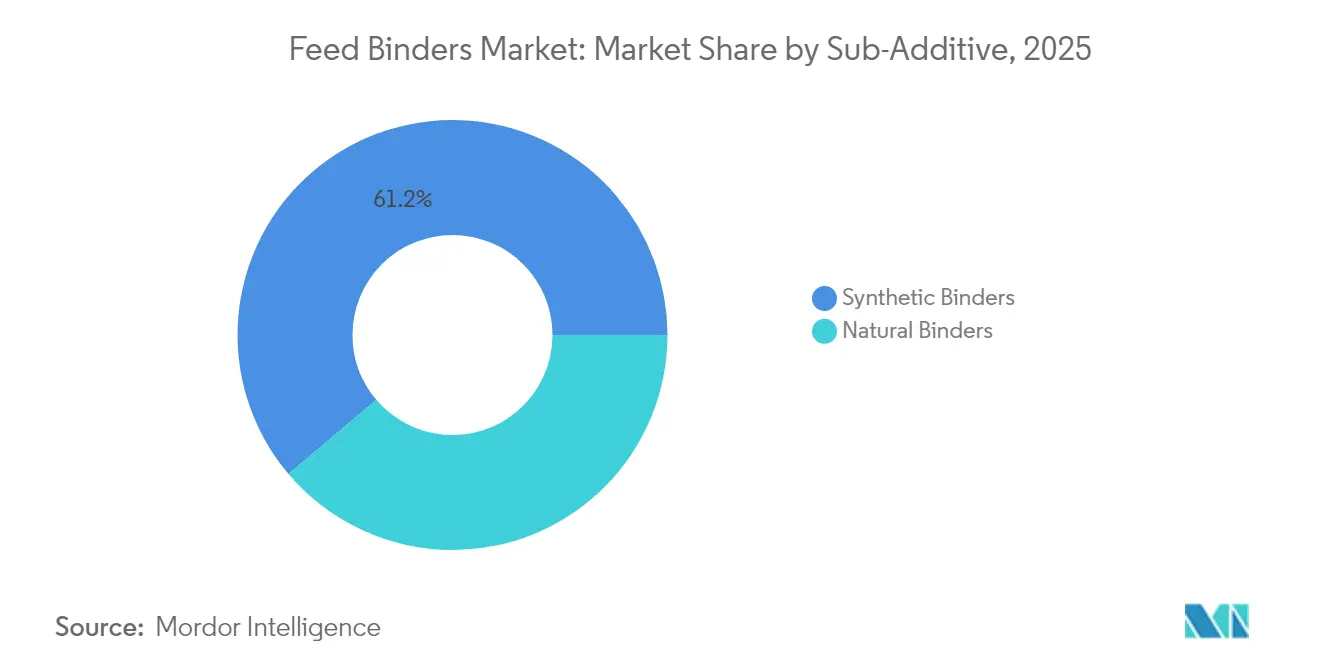
- By sub-additive, synthetic binders captured 61.20% of the feed binders market share in 2025, while natural binders are projected to expand at a 4.48% CAGR through 2031.
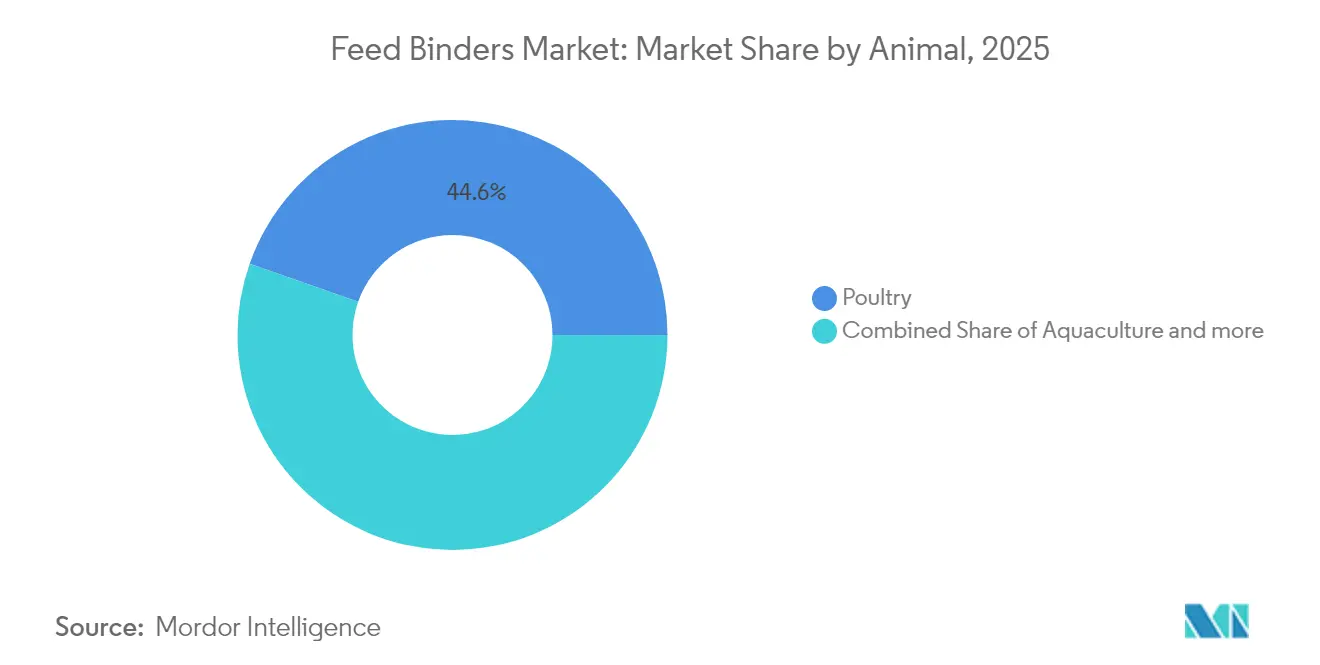
- By animal, poultry commanded a 44.62% share of the feed binders market size in 2025, while aquaculture accounted for a 5.02% CAGR through 2031.
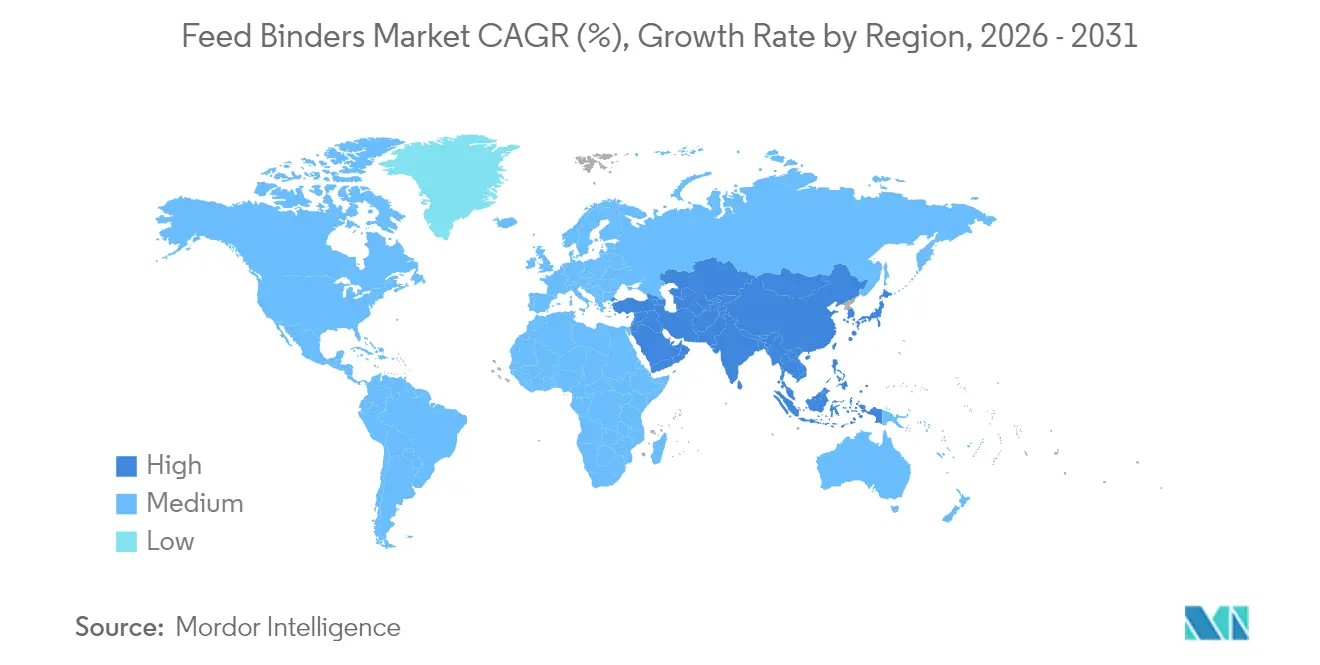
- By geography, Asia-Pacific accounted for 30.40% of global demand in 2025 and is the fastest-growing region at 4.77% CAGR through 2031.
Note: Market size and forecast figures in this report are generated using Mordor Intelligence’s proprietary estimation framework, updated with the latest available data and insights as of 2026.
Global Feed Binders Market Trends and Insights
Drivers Impact Analysis*
| Driver | (~) % Impact on CAGR Forecast | Geographic Relevance | Impact Timeline |
|---|---|---|---|
| Expansion of compound feed mills | +1.8% | Global, with the highest impact in Asia-Pacific and South America | Medium term (2-4 years) |
| Higher inclusion rates of functional feed additives | +1.2% | Global, particularly North America and Europe | Short term (≤ 2 years) |
| Ban on antibiotic growth promoters in major economies | +1.0% | Europe, North America, with spillover to Asia-Pacific | Long term (≥ 4 years) |
| Rising aqua-feed volumes in Asia-Pacific | +1.5% | Asia-Pacific core, spillover to the Middle East and Africa | Medium term (2-4 years) |
| Commercialization of insect-based binder proteins | +0.3% | Europe and North America leading, Asia-Pacific following | Long term (≥ 4 years) |
| Integration of precision pelleting sensors | +0.2% | North America and Europe, a gradual adoption in the Asia-Pacific region | Long term (≥ 4 years) |
| Source: Mordor Intelligence | |||


Expansion of Compound Feed Mills
The global proliferation of mega-scale compound feed mills targeting 30+ metric tons per hour pelleting capacity fundamentally reshapes binder demand dynamics. These facilities require consistent pellet durability across extended production runs, driving adoption of premium natural binders that maintain binding efficacy under high-temperature, high-pressure pelleting conditions. Saudi Arabia's compound feed market exemplifies this trend, with local mills increasingly adopting pelleted feed formats to improve livestock productivity and reduce waste in desert environments. The shift toward industrial-scale operations creates economies of scale for binder suppliers while demanding more sophisticated quality control systems to ensure batch-to-batch consistency. Feed mills investing in automated pelleting systems simultaneously drive demand for binders compatible with precision dosing equipment and inline quality monitoring technologies.
Higher Inclusion Rates of Functional Feed Additives
Modern feed formulations increasingly combine multiple functional additives, creating complex interactions that demand specialized binding solutions to maintain pellet integrity. The integration of enzyme-binder premixes demonstrates this trend, where proteases and phytases require protective matrices during pelleting to preserve enzymatic activity post-processing. BASF's Natuphos E granulate formulations exemplify this approach, offering heat-stable enzyme delivery systems that withstand pelleting temperatures up to 95°C while maintaining binding functionality [1]Source: BASF, “Natuphos E,” nutrition.basf.com. This convergence drives premium pricing for multifunctional binders that serve dual roles as processing aids and active ingredient carriers. Feed formulators increasingly value binders that enhance nutrient bioavailability while maintaining mechanical pellet properties, creating differentiation opportunities for suppliers with advanced encapsulation technologies.
Ban on Antibiotic Growth Promoters in Major Economies
Regulatory restrictions on antibiotic growth promoters across Europe, North America, and select Asian markets indirectly boost binder demand by elevating the importance of feed physical quality in animal performance. Without pharmaceutical growth enhancement, producers rely more heavily on optimized pellet durability to maximize feed conversion ratios and minimize waste-related pathogen exposure. The European Union's continued enforcement of antibiotic restrictions under Regulation 2019/6 creates sustained demand for natural binding solutions that support gut health through improved feed presentation [2]Source: U.S. Food and Drug Administration, “FDA Letter to Industry,” fda.gov . This regulatory environment particularly benefits lignin sulfonate suppliers, whose products offer binding functionality while potentially providing prebiotic effects that support beneficial gut microbiota. The trend accelerates the adoption of functional binders that combine mechanical properties with health-promoting characteristics, positioning the market for sustained growth as antibiotic restrictions expand globally.
Rising Aqua-Feed Volumes in Asia-Pacific
Aquaculture expansion across China, Thailand, Vietnam, and Indonesia drives specialized demand for water-stable binders that maintain pellet integrity in aquatic environments without compromising water quality parameters. Shrimp farming intensification particularly demands binders that prevent nutrient leaching while supporting optimal feeding behavior and growth performance. The sector's growth creates technical challenges that favor advanced natural binders over synthetic alternatives, as aquaculture operations prioritize environmental sustainability and regulatory compliance. The market dynamic rewards suppliers offering specialized aqua-feed binding solutions with demonstrated performance in high-moisture, temperature-variable environments typical of intensive aquaculture systems.
Restraints Impact Analysis*
| Restraint | (~) % Impact on CAGR Forecast | Geographic Relevance | Impact Timeline |
|---|---|---|---|
| Volatile raw material prices of plant gums | -0.8% | Global, particularly Asia-Pacific and Africa | Short term (≤ 2 years) |
| Stringent approval timelines for novel ingredients | -0.5% | Europe and North America primarily | Medium term (2-4 years) |
| Competition from extruded single-pellet technologies | -0.3% | Global, with a higher impact in developed markets | Long term (≥ 4 years) |
| Carbon-footprint labeling pressures on synthetic binders | -0.2% | Europe and North America, expanding globally | Long term (≥ 4 years) |
| Source: Mordor Intelligence | |||
Volatile Raw Material Prices of Plant Gums
Guar and xanthan gum price volatility creates significant margin pressure for binder manufacturers, with costs fluctuating 15-20% annually due to monsoon dependency and concentrated cultivation regions. This volatility particularly impacts natural binder suppliers who lack vertical integration or long-term supply contracts, forcing frequent price adjustments that strain customer relationships and competitive positioning. The concentration of guar production in India and Pakistan creates supply chain vulnerabilities that amplify during adverse weather events or geopolitical tensions. Feed producers increasingly seek price-stable alternatives or demand risk-sharing mechanisms from binder suppliers, driving consolidation toward vertically integrated players with supply chain control. The volatility challenge intensifies as climate change increases weather unpredictability in key cultivation regions, potentially reshaping supplier strategies toward synthetic alternatives or diversified natural sources.
Stringent Approval Timelines for Novel Ingredients
European Food Safety Authority dossier requirements extend novel binder approval timelines to 24 months, creating barriers for innovation-driven market entry and favoring established products with grandfathered regulatory status. The Food and Drug Administration (FDA) transitioned away from the Association of American Feed Control Officials memorandum of understanding, further complicated approval pathways, with new Animal Food Ingredient Consultation processes requiring extensive safety documentation and an extended review period. These regulatory bottlenecks particularly disadvantage smaller innovators lacking resources for comprehensive safety studies, consolidating market advantages toward established players with regulatory expertise and financial capacity. The approval complexity creates first-mover disadvantages for novel binder technologies, as regulatory uncertainty delays commercialization and increases development costs beyond viable thresholds for many potential entrants.
*Our forecasts treat driver/restraint impacts as directional, not additive. The impact forecasts reflect baseline growth, mix effects, and variable interactions.
Segment Analysis
By Sub-Additive: Natural Dominance Drives Innovation
Synthetic segment command 61.20% market share in 2025, as carbon footprint labeling requirements and Scope 3 emissions reporting create procurement preferences for natural alternatives. Synthetic products excel in applications requiring precise binding strength control and compatibility with automated dosing systems, particularly in large-scale poultry and swine operations where consistency and cost optimization drive purchasing decisions. The FDA's recent approval of ethyl cellulose as a feed binder demonstrates continued innovation in synthetic formulations, with applications as vitamin preparation binders and tracer matrix scaffolding expanding addressable markets.
Natural binders growth lags at 4.48% CAGR through 2031, reflecting regulatory preferences and consumer demand for clean-label animal products, as sustainability pressures intensify across global feed markets. This segment benefits from established regulatory approval pathways and growing restrictions on synthetic alternatives, particularly in European markets where environmental regulations favor bio-based solutions. Lignin sulfonates represent the largest natural binder category, with Borregaard AS leveraging its Norwegian wood processing expertise to maintain premium market positioning through specialized aquaculture applications.


By Animal: Aquaculture Leads Growth Trajectory
Poultry maintains the largest market share at 44.62% in 2025, driven by global protein consumption growth and industrialized production systems that prioritize feed conversion efficiency and pellet durability. Broiler applications dominate this segment, with high-volume operations demanding consistent pellet quality across extended production runs and automated feeding systems. Layer operations require specialized binder formulations that support calcium incorporation and maintain pellet stability during extended storage periods typical of egg production facilities. Other poultry applications, including turkey and duck farming, create niche opportunities for specialized binder solutions tailored to species-specific nutritional and handling requirements.
Aquaculture applications drive the fastest segment growth at 5.02% CAGR through 2031, reflecting intensive farming expansion across Asia-Pacific markets where water-stable pellet formulations command premium pricing and specialized performance requirements. Fish farming represents the largest aquaculture subsegment, with tilapia and salmon operations demanding binders that maintain pellet integrity while minimizing water quality impacts through reduced nutrient leaching. Shrimp farming creates particularly demanding technical requirements, as pellets must remain stable in high-salinity environments while supporting optimal feeding behavior and growth performance.
Geography Analysis
Asia-Pacific dominates the global feed binders market with the largest market share, 30.40%, highest growth rate of 4.77% CAGR through 2031, driven by aquaculture intensification across China, Thailand, Vietnam, and Indonesia, where specialized water-stable formulations command premium pricing. India emerges as a key growth driver through expanding poultry and aquaculture sectors, while Southeast Asian markets benefit from rising protein consumption and industrialized farming adoption. Japan and South Korea represent mature markets with sophisticated technical requirements and regulatory frameworks that favor established natural binder suppliers with proven performance credentials.
Europe exhibits moderate growth, constrained by mature livestock sectors but benefiting from regulatory frameworks that favor natural binder solutions and sustainability-driven procurement practices. The European Food Safety Authority's continued evaluation of novel feed ingredients creates opportunities for innovative binder technologies while maintaining barriers for synthetic alternatives lacking comprehensive safety documentation. Germany and France lead regional demand through intensive poultry and swine operations, while the Netherlands and Denmark drive aquaculture-specific applications through advanced fish farming technologies.
The North America feed binder market grows, with the United States markets driving demand through large-scale livestock operations and advanced pelleting technologies that require consistent binder performance across automated production systems. The FDA's transition away from AAFCO ingredient definition processes creates both challenges and opportunities, as new Animal Food Ingredient Consultation pathways favor established suppliers with regulatory expertise while potentially opening markets for innovative binder technologies. Canada and Mexico contribute steady growth through expanding livestock sectors and increasing adoption of pelleted feed formats in traditional grain-feeding regions.

Competitive Landscape
The global feed binders market is fragmented, with Cargill Inc., Adisseo, Arvesta (Palital Feed Additives B.V), Alltech, Inc., and Borregaard AS as the major players. The market structure creates opportunities for regional specialists and technology innovators to establish competitive positions through differentiated products and supply chain advantages. The fragmentation stems from diverse binder applications across species, processing conditions, and regional preferences, where specialized expertise drives customer loyalty and premium pricing.
Market leaders pursue vertical integration strategies to control raw material costs and ensure supply chain reliability, while smaller players focus on niche applications and regional market penetration through technical service capabilities and customized formulations. Strategic patterns reveal increasing emphasis on sustainability credentials and multifunctional product development, as feed producers seek binders that deliver both mechanical performance and functional benefits such as gut health support or nutrient bioavailability enhancement.
Technology adoption accelerates competitive differentiation, with precision pelleting sensor integration and AI-powered quality control systems creating advantages for suppliers offering compatible binder formulations and technical support services. The FDA's recent approval of ethyl cellulose for specific feed applications demonstrates continued innovation potential in synthetic formulations, while EFSA's (The European Food Safety Authority ) ongoing evaluation of natural gum alternatives creates opportunities for suppliers with comprehensive safety documentation and technical expertise [3]Source: Food and Drug Administration, “Food Additives Permitted in Feed and Drinking Water of Animals; Ethyl Cellulose,” federalregister.gov .
Feed Binders Industry Leaders
Cargill Inc.
Adisseo
Arvesta (Palital Feed Additives B.V)
Alltech, Inc.
Borregaard AS
- *Disclaimer: Major Players sorted in no particular order


Recent Industry Developments
- September 2024: The European Union approved DSM-Firmenich's next-generation phytase, HiPhorius. The new HiPhorius phytase has a state-of-the-art formulation technology designed to protect the enzyme's activity during high-temperature feed processing, including pelleting at temperatures up to 95°C. The specialized granulate binder formulation is integral to this heat stability.
- May 2022: Kemin Industries has opened new offices and a distribution center in Mexico to serve Kemin Animal Nutrition by providing the highest-quality services and customized solutions.
- April 2022: Cargill expanded its Global Animal Nutrition Center in the United States with an investment of USD 50 million to develop a new dairy innovation unit and a Research and Development (R&D) center.


Global Feed Binders Market Report Scope
Natural Binders, Synthetic Binders are covered as segments by Sub Additive. Aquaculture, Poultry, Ruminants, Swine are covered as segments by Animal. Africa, Asia-Pacific, Europe, Middle East, North America, South America are covered as segments by Region.Sub Additive
| Natural Binders |
| Synthetic Binders |
By Animal
| Aquaculture | By Sub Animal | Fish |
| Shrimp | ||
| Other Aquaculture Species | ||
| Poultry | By Sub Animal | Broiler |
| Layer | ||
| Other Poultry Birds | ||
| Ruminants | By Sub Animal | Beef Cattle |
| Dairy Cattle | ||
| Other Ruminants | ||
| Swine | ||
| Other Animals |
By Geography
| Africa | By Country | Egypt |
| Kenya | ||
| South Africa | ||
| Rest of Africa | ||
| Asia-Pacific | By Country | Australia |
| China | ||
| India | ||
| Indonesia | ||
| Japan | ||
| Philippines | ||
| South Korea | ||
| Thailand | ||
| Vietnam | ||
| Rest of Asia-Pacific | ||
| Europe | By Country | France |
| Germany | ||
| Italy | ||
| Netherlands | ||
| Russia | ||
| Spain | ||
| Turkey | ||
| United Kingdom | ||
| Rest of Europe | ||
| Middle East | By Country | Iran |
| Saudi Arabia | ||
| Rest of Middle East | ||
| North America | By Country | Canada |
| Mexico | ||
| United States | ||
| Rest of North America | ||
| South America | By Country | Argentina |
| Brazil | ||
| Chile | ||
| Rest of South America |
| Sub Additive | Natural Binders | ||
| Synthetic Binders | |||
| By Animal | Aquaculture | By Sub Animal | Fish |
| Shrimp | |||
| Other Aquaculture Species | |||
| Poultry | By Sub Animal | Broiler | |
| Layer | |||
| Other Poultry Birds | |||
| Ruminants | By Sub Animal | Beef Cattle | |
| Dairy Cattle | |||
| Other Ruminants | |||
| Swine | |||
| Other Animals | |||
| By Geography | Africa | By Country | Egypt |
| Kenya | |||
| South Africa | |||
| Rest of Africa | |||
| Asia-Pacific | By Country | Australia | |
| China | |||
| India | |||
| Indonesia | |||
| Japan | |||
| Philippines | |||
| South Korea | |||
| Thailand | |||
| Vietnam | |||
| Rest of Asia-Pacific | |||
| Europe | By Country | France | |
| Germany | |||
| Italy | |||
| Netherlands | |||
| Russia | |||
| Spain | |||
| Turkey | |||
| United Kingdom | |||
| Rest of Europe | |||
| Middle East | By Country | Iran | |
| Saudi Arabia | |||
| Rest of Middle East | |||
| North America | By Country | Canada | |
| Mexico | |||
| United States | |||
| Rest of North America | |||
| South America | By Country | Argentina | |
| Brazil | |||
| Chile | |||
| Rest of South America | |||


Market Definition
- FUNCTIONS - For the study, feed additives are considered to be commercially manufactured products that are used to enhance characteristics such as weight gain, feed conversion ratio, and feed intake when fed in appropriate proportions.
- RESELLERS - Companies engaged in reselling feed additives without value addition have been excluded from the market scope, to avoid double counting.
- END CONSUMERS - Compound feed manufacturers are considered to be end-consumers in the market studied. The scope excludes farmers buying feed additives to be used directly as supplements or premixes.
- INTERNAL COMPANY CONSUMPTION - Companies engaged in the production of compound feed as well as the manufacturing of feed additives are part of the study. However, while estimating the market sizes, the internal consumption of feed additives by such companies has been excluded.
| Keyword | Definition |
|---|---|
| Feed additives | Feed additives are products used in animal nutrition for purposes of improving the quality of feed and the quality of food from animal origin, or to improve the animals’ performance and health. |
| Probiotics | Probiotics are microorganisms introduced into the body for their beneficial qualities. (It maintains or restores beneficial bacteria to the gut). |
| Antibiotics | Antibiotic is a drug that is specifically used to inhibit the growth of bacteria. |
| Prebiotics | A non-digestible food ingredient that promotes the growth of beneficial microorganisms in the intestines. |
| Antioxidants | Antioxidants are compounds that inhibit oxidation, a chemical reaction that produces free radicals. |
| Phytogenics | Phytogenics are a group of natural and non-antibiotic growth promoters derived from herbs, spices, essential oils, and oleoresins. |
| Vitamins | Vitamins are organic compounds, which are required for normal growth and maintenance of the body. |
| Metabolism | A chemical process that occurs within a living organism in order to maintain life. |
| Amino acids | Amino acids are the building blocks of proteins and play an important role in metabolic pathways. |
| Enzymes | Enzyme is a substance that acts as a catalyst to bring about a specific biochemical reaction. |
| Anti-microbial resistance | The ability of a microorganism to resist the effects of an antimicrobial agent. |
| Anti-microbial | Destroying or inhibiting the growth of microorganisms. |
| Osmotic balance | It is a process of maintaining salt and water balance across membranes within the body's fluids. |
| Bacteriocin | Bacteriocins are the toxins produced by bacteria to inhibit the growth of similar or closely related bacterial strains. |
| Biohydrogenation | It is a process that occurs in the rumen of an animal in which bacteria convert unsaturated fatty acids (USFA) to saturated fatty acids (SFA). |
| Oxidative rancidity | It is a reaction of fatty acids with oxygen, which generally causes unpleasant odors in animals. To prevent these, antioxidants were added. |
| Mycotoxicosis | Any condition or disease caused by fungal toxins, mainly due to contamination of animal feed with mycotoxins. |
| Mycotoxins | Mycotoxins are toxin compounds that are naturally produced by certain types of molds (fungi). |
| Feed Probiotics | Microbial feed supplements positively affect gastrointestinal microbial balance. |
| Probiotic yeast | Feed yeast (single-cell fungi) and other fungi used as probiotics. |
| Feed enzymes | They are used to supplement digestive enzymes in an animal’s stomach to break down food. Enzymes also ensure that meat and egg production is improved. |
| Mycotoxin detoxifiers | They are used to prevent fungal growth and to stop any harmful mold from being absorbed in the gut and blood. |
| Feed antibiotics | They are used both for the prevention and treatment of diseases but also for rapid growth and development. |
| Feed antioxidants | They are used to protect the deterioration of other feed nutrients in the feed such as fats, vitamins, pigments, and flavoring agents, thus providing nutrient security to the animals. |
| Feed phytogenics | Phytogenics are natural substances, added to livestock feed to promote growth, aid in digestion, and act as anti-microbial agents. |
| Feed vitamins | They are used to maintain the normal physiological function and normal growth and development of animals. |
| Feed flavors and sweetners | These flavors and sweeteners help to mask tastes and odors during changes in additives or medications and make them ideal for animal diets undergoing transition. |
| Feed acidifiers | Animal feed acidifiers are organic acids incorporated into the feed for nutritional or preservative purposes. Acidifiers enhance congestion and microbiological balance in the alimentary and digestive tracts of livestock. |
| Feed minerals | Feed minerals play an important role in the regular dietary requirements of animal feed. |
| Feed binders | Feed binders are the binding agents used in the manufacture of safe animal feed products. It enhances the taste of food and prolongs the storage period of the feed. |
| Key Terms | Abbreviation |
| LSDV | Lumpy Skin Disease Virus |
| ASF | African Swine Fever |
| GPA | Growth Promoter Antibiotics |
| NSP | Non-Starch Polysaccharides |
| PUFA | Polyunsaturated Fatty Acid |
| Afs | Aflatoxins |
| AGP | Antibiotic Growth Promoters |
| FAO | The Food And Agriculture Organization of the United Nations |
| USDA | The United States Department of Agriculture |


Research Methodology
Mordor Intelligence follows a four-step methodology in all our reports.
- Step-1: IDENTIFY KEY VARIABLES: In order to build a robust forecasting methodology, the variables and factors identified in Step-1 are tested against available historical market numbers. Through an iterative process, the variables required for market forecast are set and the model is built on the basis of these variables.
- Step-2: Build a Market Model: Market-size estimations for the forecast years are in nominal terms. Inflation is not a part of the pricing, and the average selling price (ASP) is kept constant throughout the forecast period.
- Step-3: Validate and Finalize: In this important step, all market numbers, variables and analyst calls are validated through an extensive network of primary research experts from the market studied. The respondents are selected across levels and functions to generate a holistic picture of the market studied.
- Step-4: Research Outputs: Syndicated Reports, Custom Consulting Assignments, Databases & Subscription Platforms


