Market Overview
| Study Period | 2020 - 2031 |
|---|---|
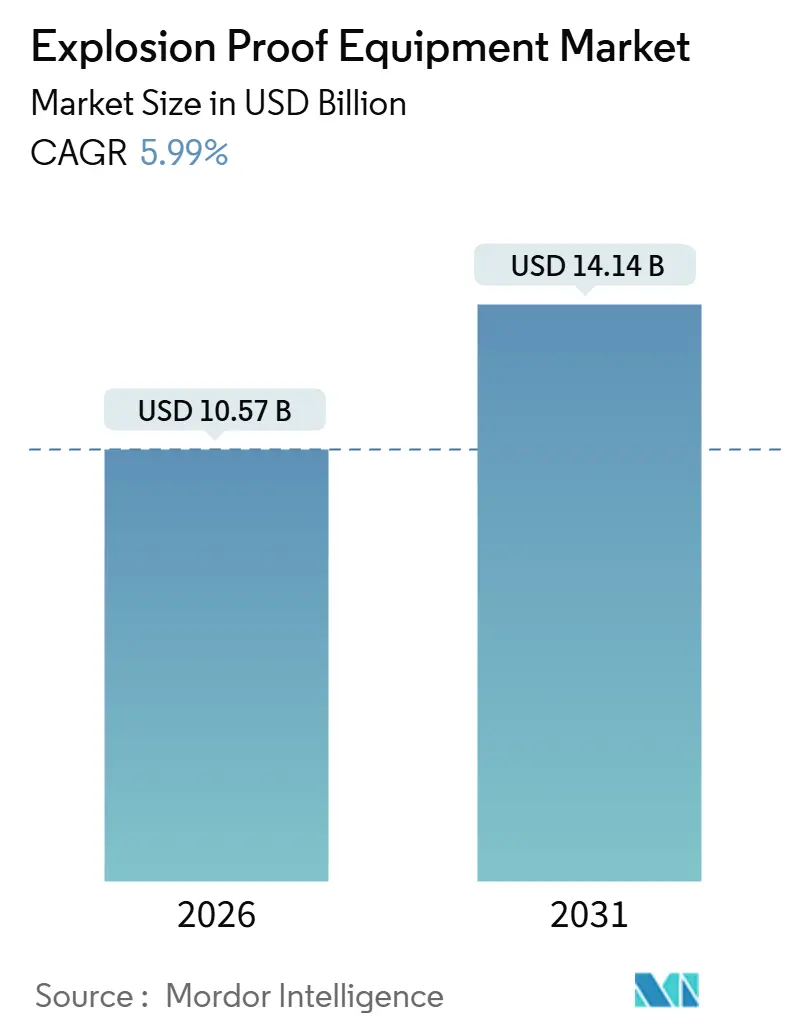
| Market Size (2026) | USD 10.57 Billion |
| Market Size (2031) | USD 14.14 Billion |
| Growth Rate (2026 - 2031) | 5.99% CAGR |
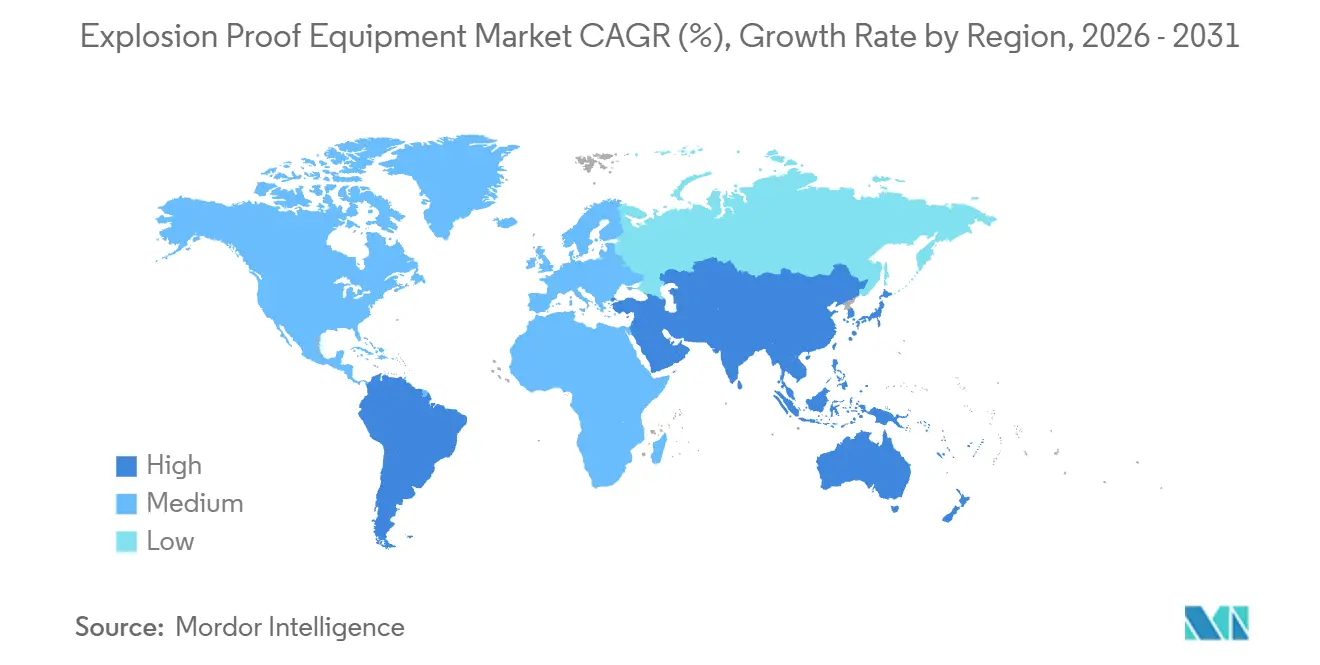
| Fastest Growing Market | Middle East |
| Largest Market | Asia Pacific |
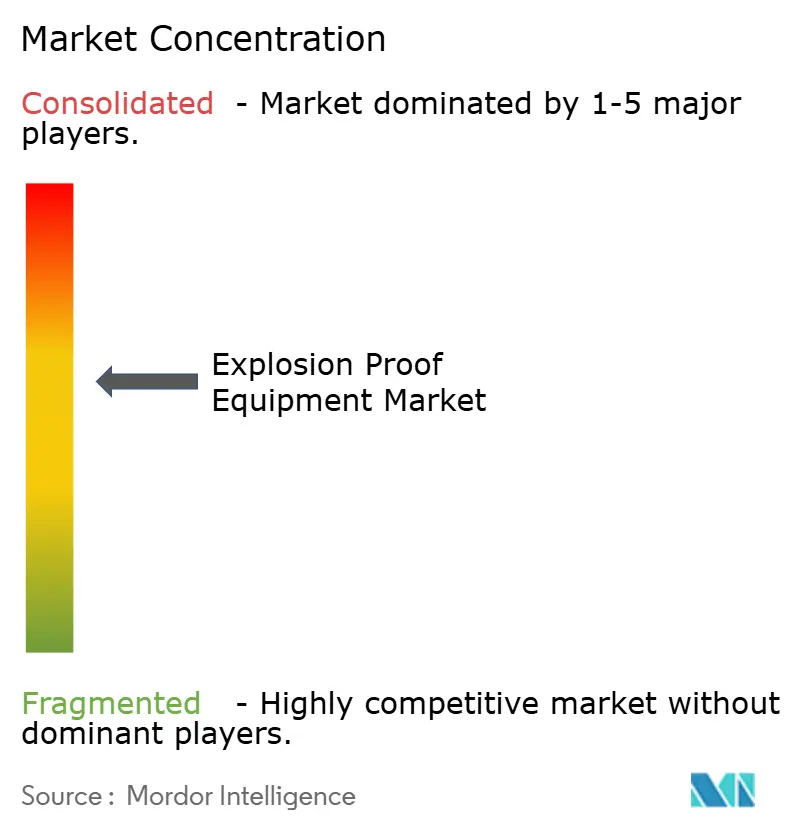
| Market Concentration | Medium |
Major Players *Disclaimer: Major Players sorted in no particular order Image © Mordor Intelligence. Reuse requires attribution under CC BY 4.0. | |
Explosion Proof Equipment Market Analysis by Mordor Intelligence
The explosion proof equipment market size reached USD 10.57 billion in 2026 and is forecast to climb to USD 14.14 billion by 2031, reflecting a 5.99% CAGR across the period. Operators are accelerating replacements as tighter ATEX and IECEx enforcement removes legacy gear from service, while mega-projects in hydrogen, ammonia and battery production create a wave of brand-new hazardous locations. Retrofit demand is dominated by intrinsically safe electronics that simplify installation and shorten recertification cycles, whereas flame-proof containment remains critical for high-power machinery. Digitalization is sweeping through Class I and Zone 1 facilities, and vendors that bundle cyber-secure automation with certified enclosures are winning multi-plant framework agreements. At the same time, the rapid conversion to LED luminaires continues to compress operating costs and reduce ambient heat loads in confined spaces.
Key Report Takeaways
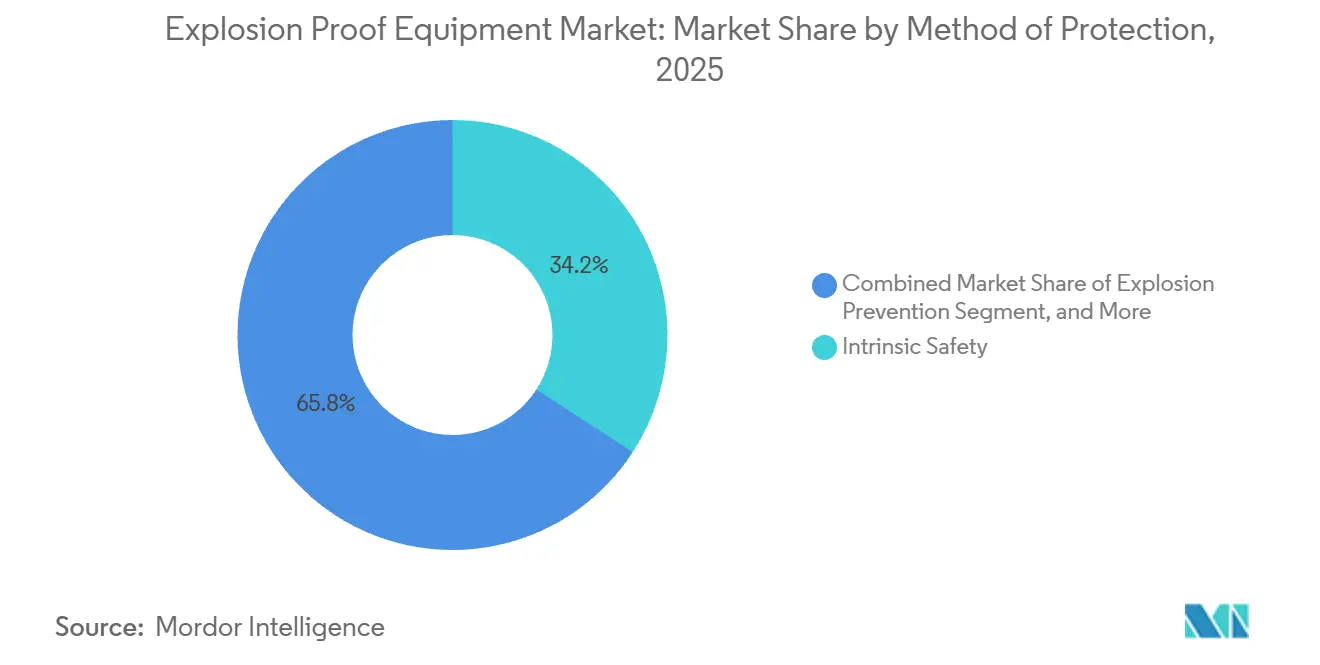
- By method of protection, intrinsic safety captured 34.17% of the explosion proof equipment market share in 2025 and is projected to expand at a 6.19% CAGR through 2031.
- By zone, Zone 20 dust installations commanded a 7.01% CAGR during the same horizon, outpacing the larger Zone 1 segment that led with 41.53% of deployments in 2025.
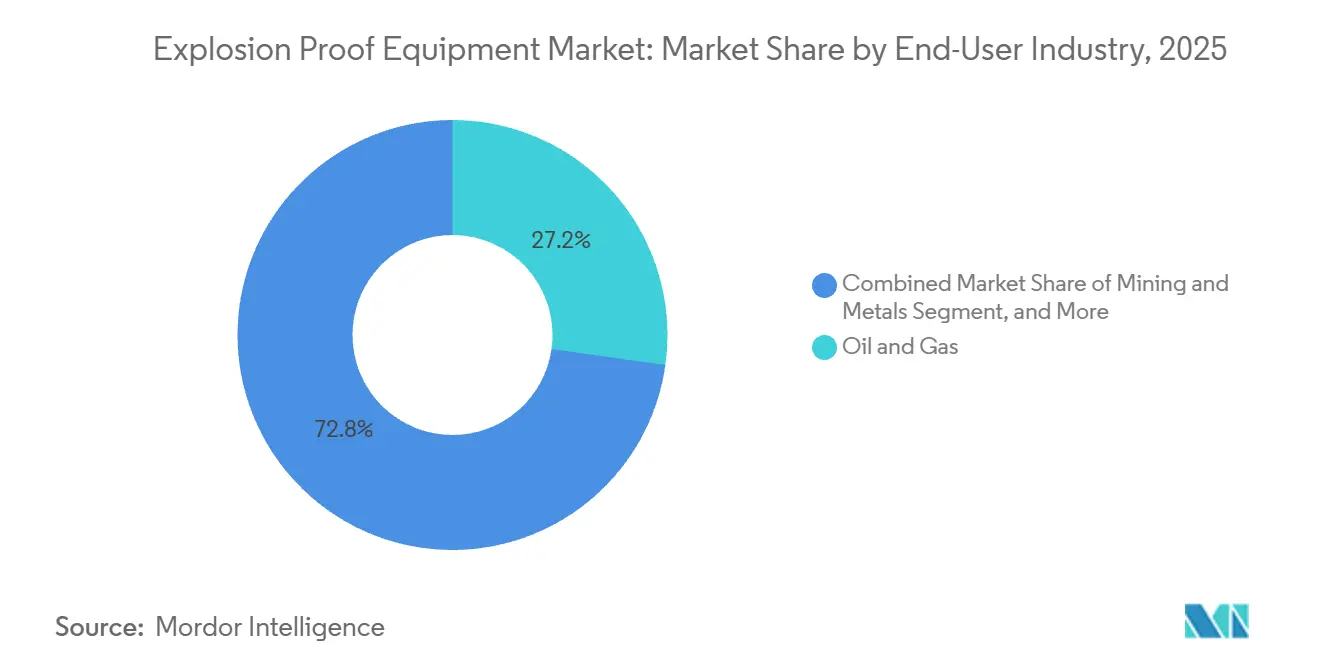
- By end-user, oil and gas accounted for 27.23% of revenue in 2025, while hydrogen production is set to record the fastest 8.12% CAGR through 2031.
- By system, automation and control solutions advanced at a segment-leading 6.37% CAGR, whereas lighting retained 18.96% of revenue in 2025.
- By geography, Asia Pacific dominated with a 32.71% share in 2025, but the Middle East is projected to register the highest CAGR of 8.27% through 2031.
Note: Market size and forecast figures in this report are generated using Mordor Intelligence’s proprietary estimation framework, updated with the latest available data and insights as of January 2026.
Global Explosion Proof Equipment Market Trends and Insights
Drivers Impact Analysis*
| Driver | (~) % Impact on CAGR Forecast | Geographic Relevance | Impact Timeline |
|---|---|---|---|
| Stricter Global ATEX/IECEx Enforcement | +0.9% | Europe, Middle East, Asia Pacific | Medium term (2-4 years) |
| Rising Green-Hydrogen Projects Needing Class I Equipment | +1.2% | Middle East, Europe, North America | Long term (≥4 years) |
| IIoT-Ready Explosion-Proof Retrofits | +0.8% | Global | Short term (≤2 years) |
| Rapid LED Migration in Hazardous Lighting | +0.7% | Global | Short term (≤2 years) |
| Lithium-Ion Gigafactories Demand for Dust-Zone Gear | +1.0% | Asia Pacific, Europe, North America | Medium term (2-4 years) |
| Space-Industry Test Stands Requiring Ex-Rated Systems | +0.3% | North America | Long term (≥4 years) |
| Source: Mordor Intelligence | |||
Stricter Global ATEX/IECEx Enforcement
Mutual recognition of IECEx test reports rose from 28 to 38 member states between 2024 and 2026, cutting duplicate type-testing times by roughly 50% and forcing non-compliant legacy gear out of service. The European Union closed a self-certification loophole in the revised ATEX Directive, obliging third-party audits for all Group II assemblies, and fines above EUR 500,000 (USD 565,000) were issued in Germany and France during 2025.[1]European Commission, “ATEX Directive 2014/34/EU Revision,” ec.europa.eu TUV Süd and Intertek logged a 22% surge in audit requests as OEMs scrambled to comply before customs blocks took effect. Gulf-region operators aligned procurement with IECEx to avoid port delays, pushing certified demand far beyond historical oil and gas orders. Collectively, these moves lift the baseline CAGR by an estimated 0.9 percentage points.
Rising Green-Hydrogen Projects Needing Class I Equipment
Cumulative electrolyzer capacity reached 3.2 GW by 2025, with another 12 GW under execution, and each stack requires Class I, Division 1 junction boxes, compressors and gas detection loops. California’s Hydrogen Safety Panel capped allowable hydrogen concentration at 1%, effectively mandating SIL 2 trip logic and intrinsically safe signal loops. Jafurah Phase 2 alone allocated roughly USD 1 billion for Ex-rated electrical scope in 2024 procurement rounds. TÜV-certified turbines capable of 100% hydrogen now ship with flame-proof ignition systems, broadening adoption in peaker plants and chemical off-gas recovery lines. As export-scale hydrogen terminals start in 2028, the driver is expected to add 1.2 percentage points to the forecast CAGR.
IIoT-Ready Explosion-Proof Retrofits
Wireless vibration, temperature and gas sensors entered Zone 1 production service after Pepperl+Fuchs embedded IO-Link Wireless in stainless enclosures, eliminating conduit runs and slashing installation labor by roughly 30%. BARTEC released Zone 1 tablets that merge video, LTE and thermal imaging, replacing paper-based permits and reducing turnaround times in refineries. Eaton shipped 15,000 Bluetooth intrinsic-safety barriers in 2025, each gateway supporting eight devices and publishing condition data to cloud historians. R. STAHL’s OPC UA gateways aggregate up to 64 intrinsic channels, letting operators feed analytics engines without breaching Ex boundaries. Shortage of skilled electricians in North America and Western Europe amplifies uptake, contributing 0.8 percentage points to growth.
Rapid LED Migration in Hazardous Lighting
LED luminaires certified for Zone 1 and Zone 21 deliver 60%-70% power savings and extend service life to 50,000-70,000 hours. IDEC signal towers add multicolor indications that withstand high-pressure washdowns in food lines. Nemalux fixtures withstand corrosive cleaning agents in meat-processing plants while maintaining CSA Class I, Division 2 ratings. BARTEC algorithms throttle output above 85 °C, avoiding self-heating ignition in dusty environments. Utility rebates across Asia Pacific and North America offset retrofit costs, driving a 0.7 percentage-point lift to the CAGR.
Restraints Impact Analysis*
| Restraint | (~) % Impact on CAGR Forecast | Geographic Relevance | Impact Timeline |
|---|---|---|---|
| High Certification and Recertification Cost | -0.6% | Global | Short term (≤2 years) |
| Divergent Regional Zoning Standards | -0.5% | Global, with acute friction in North America vs Europe | Medium term (2-4 years) |
| Supply-Chain Delays for Flame-Proof Castings | -0.4% | Global, concentrated in Europe and North America | Short term (≤2 years) |
| Anti-Dumping Tariffs on Chinese Ex Enclosures | -0.3% | North America, Europe | Medium term (2-4 years) |
| Source: Mordor Intelligence | |||
High Certification and Recertification Cost
Obtaining Ex certificates typically costs USD 50,000-150,000 per product family, and any design tweak triggers an additional USD 20,000-40,000 plus a 3-6 month delay. Intertek’s 2024 report notes project durations lengthened to 19 weeks as IIoT devices required cybersecurity evidence under IEC 62443-4-2. Niche suppliers therefore skip secondary markets, fragmenting the explosion proof equipment market and depressing economies of scale. End-users see higher spares prices because OEMs must amortize compliance cost across thin volumes, subtracting roughly 0.6 percentage points from growth.
Divergent Regional Zoning Standards
The NEC Class and Division system remains mandatory in the United States and parts of Canada, while IEC 60079 Zones dominate Europe and most of Asia, forcing dual part numbers and parallel inventory.[2]National Fire Protection Association, “NEC Article 500 Hazardous Locations,” nfpa.org A Zone 1 starter fails to meet Class I, Division 1 without UL 1203 re-testing, creating re-engineering loopbacks for multinational projects. Eaton reports that its North American line accounts for 35% of sales but consumes half of compliance spend. Continued deadlock on harmonization drags 0.5 percentage points from the CAGR.
*Our forecasts treat driver/restraint impacts as directional, not additive. The impact forecasts reflect baseline growth, mix effects, and variable interactions.
Segment Analysis
By Method of Protection: Intrinsic Safety Gains Sustainable Momentum
Intrinsic safety claimed 34.17% of the explosion proof equipment market in 2025 and is projected to grow at 6.19% through 2031, outpacing pressurization, explosion containment and other legacy approaches. The shift lowers enclosure mass and eliminates machined flame paths, reducing both upfront material and lifecycle maintenance costs. ABB’s AC500-S PLC family embeds intrinsic outputs that negate separate barrier racks, freeing 25% of cabinet footprint. Emerson’s SIL 3 safety controller connects directly to HART loops in Zone 1 areas, preserving wiring and enabling hot-cutovers without production downtime.[3]Emerson, “Acquisition of AspenTech Completed,” emerson.com Variable-frequency drives continue to require flame-proof housings, yet semiconductor advances that distribute heat are narrowing the power levels where containment is essential. Pressurization systems remain the method of choice in analyzer shelters, although purge-air loss alarms and interlocks add complexity. Explosion proof equipment market size for intrinsic safety reached USD 3.6 billion in 2026 and is foreseen to exceed USD 4.9 billion by 2031. Smaller machine builders appreciate the ability to certify once and roll platforms across voltages and regions, reinforcing long-term preference for energy-limiting protection.
While containment retains relevance for 600 V switchgear and 250 kW motors, its share continues to erode. OEMs now cast modular flame-proof housings that accept drive, starter or disconnect inserts to amortize testing fees, but even these platforms face stiff competition from intrinsic fieldbus architectures. Sand-filled and oil-immersed techniques find support in underground mining transformers, yet high oil prices make double-walled tanks expensive, steering miners toward compact intrinsic telemetry. Explosion proof equipment market share for pressurization is forecast to dip below 12% by 2031 as predictive-maintenance programs value the safer live-work privileges intrinsic circuits provide. The transition is already visible in procurement specifications that rank intrinsic safety ahead of containment whenever loop power stays below 30 V.


By Zone: Dust-Classified Assets Step Into the Spotlight
Zone 1 still dominates in absolute terms, representing 41.53% of installed devices in 2025, yet combustible-dust areas are expanding faster due to giga-factory and pharmaceutical powder lines. Explosion proof equipment market size for Zone 20 and Zone 21 combined crossed USD 1.8 billion in 2026 and is projected to reach USD 2.7 billion by 2031. Lithium-ion cathode mixing, graphite anode processing and solvent recovery systems present hybrid dust-and-vapor risks that demand IP6X enclosures with elevated temperature codes. Regulators in the United States cited 47 facilities in 2025 for dust violations, prompting immediate retrofits of conveyors and bucket elevators.
OEMs respond with dual-certified products that serve both gas and dust hazards, reducing inventory burden for distributors. Eaton’s CEAG switches and BARTEC’s Zone 20 luminaires exemplify this trend, each carrying IP66/IP67 ingress ratings to resist cleaning fluids while blocking fine powders. Municipal wastewater plants, long considered moderate-risk, are upgrading blower rooms to Zone 1 to accommodate rising methane concentrations from co-digestion. Meanwhile, Zone 0 remains niche outside electrolyzer cathode chambers and storage tank sumps, but unit values are high because only intrinsically safe apparatus is admissible. The explosion proof equipment market maintains a cost premium of 30%-50% in Zone 0 compared with Zone 2, contributing outsized revenue from a limited installed base.
By End-User Industry: Hydrogen Edges Past Traditional Oil and Gas Growth
Oil and gas kept a 27.23% revenue share in 2025, anchored by brownfield maintenance in refineries and offshore rigs. Nevertheless, the explosion-proof equipment market size tied to hydrogen production is scaling quickly, projected to triple between 2026 and 2031 as policy incentives and carbon contracts push electrolyzer parks, ammonia crackers, and fueling corridors. Each 100 MW alkaline site consumes roughly USD 25 million in Ex instrumentation, contributing to an 8.12% CAGR for the segment.
Chemical and petrochemical complexes rank second by spend, with ethylene and aromatics units integrating tens of thousands of Ex valves, analyzers, and lights during every expansion cycle. Battery manufacturing is another high-growth pocket as fire incidents heighten scrutiny over powdered metals. Food and beverage processors are adopting Zone 21 robotics to meet insurance mandates, while pharmaceutical plants lean on low-heat LED luminaires that avoid solvent vapor ignition. Collectively, these shifts diversify the explosion-proof equipment industry and cushion cyclical swings in fossil fuels.
By System: Automation and Control Overtake Lighting in Growth Momentum
Lighting accounted for 18.96% of 2025 revenue thanks to mass LED retrofits, while automation and control systems posted the highest CAGR at 6.37%. Explosion proof equipment market size for safety PLCs, SIL gateways, and edge servers reached USD 2.9 billion in 2026 and is set to top USD 4.2 billion by 2031 as predictive analytics extend into Zone 1 skids. Vendors now integrate OPC UA pub-sub, secure boot, and deep-packet inspection directly inside certified enclosures, merging process control and safety interlocks.
Motors, drives, and transformers remain backbone items, yet efficiency mandates and harmonic limits favor smart VFDs like Eaton’s ACE10, which recover braking energy. Gas and flame detection sees resilient demand as new hydrogen standards tighten trip thresholds. Surveillance cameras and 5G access points certified for Zone 1 broaden situational awareness, while material-handling cranes gain variable-speed drives to ease heavy-lift precision. The convergence of control, safety, and data logging narrows cabinet counts per skid, but raises the average selling price of each certified node, supporting vendor margins.
Geography Analysis
Asia Pacific retained the largest share at 32.71% in 2025 owing to refinery and petrochemical build-outs across China, India, and Southeast Asia. China commissioned eight ethylene crackers in 2024, each ordering up to 3,000 Ex devices, while India’s coastal investment zones are committing more than USD 100 billion to integrated complexes. Japan’s ammonia co-firing retrofits require Class I equipment to manage the 15%-28% flammability window of ammonia, and South Korea is adding blue-hydrogen loops in existing refineries.
North America accounted for roughly 28% of 2025 revenue, as U.S. Gulf Coast steam crackers, LNG terminals, and hydrogen hubs secured orders following the DOE's USD 7 billion in grants.[4]U.S. Department of Energy, “Hydrogen Hubs Funding Awards,” energy.gov Canadian oil-sands operators continue to replace aging Class I motors with higher-efficiency Ex e units featuring corrosion-resistant coatings for saline tailings ponds. Mexico benefits indirectly by assembling flameproof enclosures to bypass anti-dumping tariffs on Chinese castings and by shipping finished goods duty-free into the United States.
The Middle East is forecast to post the fastest 8.27% CAGR through 2031, powered by Jafurah, Ruwais and Yasref mega-projects that bundle Ex electrical packages into multi-billion-dollar EPC contracts. Hydrogen, ammonia and methanol export terminals along the Persian Gulf demand SIL 3 shutdown systems, fiber-optic marshaling panels and thousands of Zone 0 gas detectors. Europe holds roughly 24% share, yet growth is constrained by energy-price uncertainty; still, BASF, Shell and TotalEnergies are digitizing historic complexes with intrinsic wireless sensors. Latin America and Africa remain smaller, but pre-salt fields and new refineries in Brazil, Nigeria and Angola offer episodic upside when financing aligns.

Competitive Landscape
Five diversified automation majors - ABB, Siemens, Eaton, Honeywell, and Emerson - controlled an estimated 40% of global revenue in 2025, underscoring a moderately concentrated structure. These firms deploy platform strategies in which one certified housing accommodates different voltage, horsepower or communication options, diluting certification cost per SKU. Emerson’s purchase of AspenTech in 2024 illustrates the push to pair Ex hardware with optimization software, enabling clients to cut their energy footprint and emissions in tandem.
Niche specialists, including R. STAHL, Pepperl+Fuchs, BARTEC, and Rockwell Automation, punch above their size in intrinsic barriers, mobile devices, and cyber-secure gateways. R. STAHL’s IS1+ smartphone introduced remote-wipe functions that satisfy plant IT teams concerned about ransomware traveling through Bluetooth or Wi-Fi links. Pepperl+Fuchs capitalizes on Sensorik4.0 to migrate analog loops into cloud historians without opening cabinets, ideal for sites with aging labor forces.
White-space growth appears in hydrogen refueling, battery recycling, and space-propellant test stands, where enclosure footprints must shrink, and materials must withstand cryogenic or oxygen-rich conditions. Small fabricators leverage quick-turn machining in Vietnam and Poland to win low-volume, high-spec orders that multinationals decline. IEC 62443-4-2 cybersecurity audits now rank beside ATEX files in bid evaluations, forcing even legacy lighting vendors to embed secure firmware, a hurdle that keeps the market’s entry barrier high.
Explosion Proof Equipment Industry Leaders
ABB Ltd
Eaton Corporation plc
Siemens AG
Honeywell International Inc.
R. STAHL AG
- *Disclaimer: Major Players sorted in no particular order

Recent Industry Developments
- November 2025: ABB introduced System 800xA High Integrity R7.1, a SIL 3-rated DCS with OPC UA pub-sub for deterministic links to Zone 1 devices.
- October 2025: Honeywell acquired Safety Manager SC, adding automated SIL verification to its Forge platform.
- September 2025: Eaton unveiled the ACE10 Class I, Division 1 VFD, integrating active harmonic filtering and regenerative braking.
- July 2025: Rockwell Automation released GuardLogix 5580 controllers supporting intrinsically safe remote I/O over EtherNet/IP.


Research Methodology Framework and Report Scope
Market Definitions and Key Coverage
Our study defines the global explosion-proof equipment market as every certified electrical or electromechanical device, including lighting, motors, automation hardware, junction boxes, cable glands, and surveillance units, engineered to isolate, contain, or limit an internal ignition so surrounding flammable gases, vapors, dust, or fibers are not ignited in Zones 0/1/2 and 20/21/22.
Scope note: we exclude soft PPE, intrinsically safe mobile phones, and software-only monitoring platforms, keeping our focus on installed industrial hardware.
Segmentation Overview
- By Method of Protection
- Explosion Containment (Flame-Proof)
- Intrinsic Safety
- Pressurization / Purged
- Explosion Prevention
- Explosion Segregation
- By Zone
- Zone 0
- Zone 1
- Zone 2
- Zone 20
- Zone 21
- Zone 22
- By End-User Industry
- Oil and Gas
- Chemicals and Petrochemicals
- Mining and Metals
- Energy and Power
- Pharmaceuticals
- Food and Beverage Processing
- Waste-Water Treatment
- Hydrogen Production and Fuel Cells
- Other End-User Industries
- By System
- Power Supply and Distribution
- Motors and Drives
- Automation and Control Systems
- Lighting Systems
- Material Handling Equipment
- Surveillance and Detection
- Heating and HVAC
- Other Systems
- By Geography
- North America
- United States
- Canada
- Mexico
- Europe
- Germany
- United Kingdom
- France
- Italy
- Spain
- Russia
- Rest of Europe
- Asia Pacific
- China
- Japan
- India
- South Korea
- ASEAN
- Australia and New Zealand
- Rest of Asia Pacific
- South America
- Brazil
- Argentina
- Rest of South America
- Middle East
- Saudi Arabia
- United Arab Emirates
- Turkey
- Rest of Middle East
- Africa
- South Africa
- Nigeria
- Rest of Africa
- North America
Detailed Research Methodology and Data Validation
Primary Research
We spoke with hazardous-area certifiers, refinery maintenance heads, and automation integrators across North America, Europe, the Middle East, and Asia. Their insights helped us validate typical replacement cycles, zone-wise device mixes, and premium pricing differentials, allowing us to fine-tune adoption curves that pure desk work could not capture.
Desk Research
We began with public standards and compliance registries such as IECEx, ATEX Notified Bodies, OSHA accident logs, and the U.S. National Electrical Code, which let us map certification volumes by zone and device class. Trade data from UN Comtrade, Eurostat, and Volza shipment panels gave us export-value trends for flame-proof enclosures, while energy-sector CAPEX figures from the IEA and OPEC informed demand cycles. Company 10-Ks, investor decks, and news feeds accessed via Dow Jones Factiva supplied average selling prices and backlog clues from leading suppliers, and sector-specific associations, such as the International Association of Drilling Contractors and the Hydrogen Council, offered plant count and project pipeline data that shaped installed-base assumptions. These illustrations are not exhaustive; many other open and paid sources were tapped for cross-checks and clarifications.
Market-Sizing & Forecasting
We apply a top-down build that starts with production and trade statistics for certified housings and components, which are then reconciled with hazardous-industry capex outlays, new hydrogen-electrolyzer counts, IECEx certificate issuances, and regional rig totals. Select bottom-up checks, sampled supplier shipments and channel ASP x volume calculations, anchor plausibility. A multivariate regression, tested on indicators such as Brent crude price, global chemical output index, and issued ATEX certificates, projects demand to 2030. Where bottom-up gaps arise, we hold the modeled growth to the lower bound of our primary-research consensus.
Data Validation & Update Cycle
Every quarter, our analysts rerun anomaly screens, compare model outputs with fresh import data and incident reports, and escalate any +/-5% variance for senior review. The report is refreshed annually, with mid-cycle tweaks if major regulatory or supply-chain shocks emerge.
Why Mordor's Explosion Proof Equipment Baseline Commands Decision-Makers' Trust
Published figures often differ because each firm chooses its own device roster, zone mapping, currency year, and refresh rhythm. We disclose our scope up front, keep currencies constant, and roll forecasts only after live checks with field engineers.
Key gap drivers include whether mechanical flame arrestors are counted, how aggressively green-hydrogen projects are baked in, the cadence of ASP inflation, and how frequently datasets are refreshed. Many published values lean on supplier revenue roll-ups without matching them to demand proxies such as IECEx certificate volumes or refinery turn-around schedules, which we always integrate.
Benchmark comparison
| Market Size | Anonymized source | Primary gap driver |
|---|---|---|
| USD 9.96 B (2025) | Mordor Intelligence | - |
| USD 8.64 B (2025) | Global Consultancy A | Counts mostly electrical gear, limited regional price harmonization |
| USD 9.9 B (2025) | Trade Journal B | Relies on supplier revenue roll-ups, no cross-check with zone certifications |
In short, our disciplined scope selection, live primary validations, and annual refresh cycle give stakeholders a transparent, balanced baseline they can trace to real-world variables and replicate with confidence.


Key Questions Answered in the Report
How big is the explosion proof equipment market today?
The explosion proof equipment market size was USD 10.57 billion in 2026 and is projected to reach USD 14.14 billion by 2031.
Which segment is growing fastest within hazardous-area equipment?
Automation and control systems lead with a 6.37% CAGR due to the spread of SIL-rated PLCs and IIoT gateways.
Why is intrinsic safety gaining share over flame-proof containment?
It lowers enclosure weight, cuts maintenance and supports plug-and-play sensor retrofits while still meeting ignition-prevention rules.
Which region is expected to expand the most through 2031?
The Middle East is forecast to post an 8.27% CAGR, fueled by hydrogen and gas mega-projects in Saudi Arabia and the UAE.
How do certification costs impact new entrants?
Type-testing and recertification can exceed USD 150,000 per product family, delaying launches and limiting smaller firms to niche markets.
Page last updated on:


