Insurance Third Party Administrators Market Size and Share
Market Overview
| Study Period | 2020 - 2031 |
|---|---|
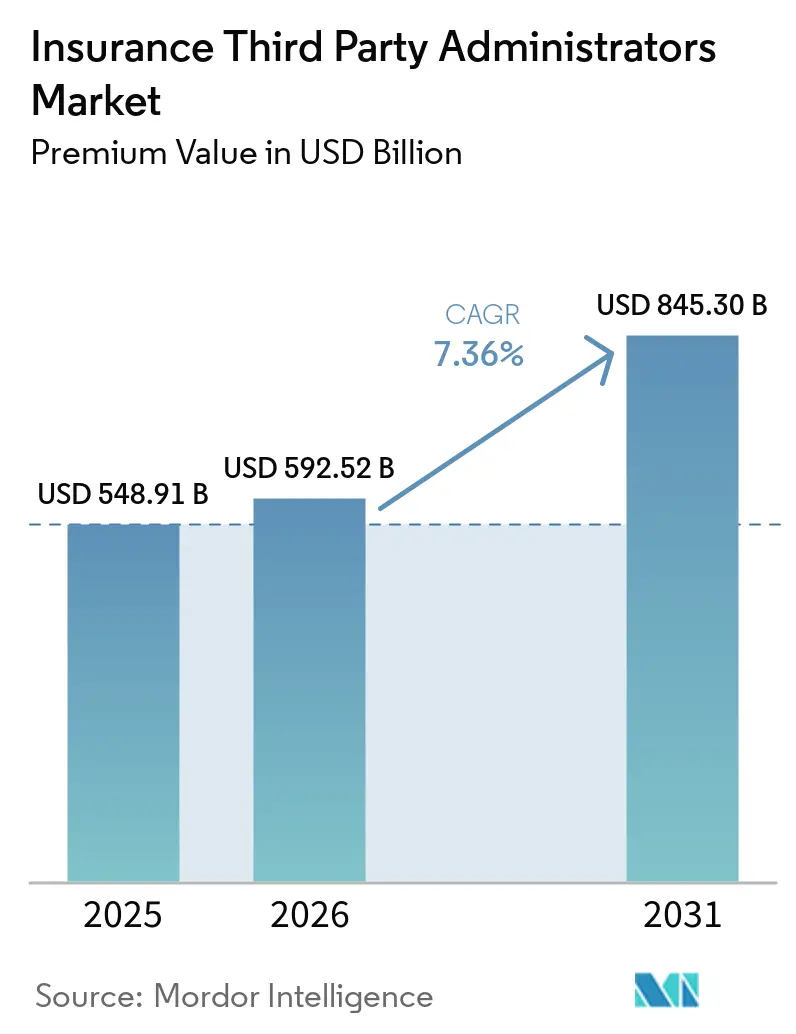
| Market Size (2026) | USD 592.52 Billion |
| Market Size (2031) | USD 845.30 Billion |
| Growth Rate (2026 - 2031) | 7.36% CAGR |
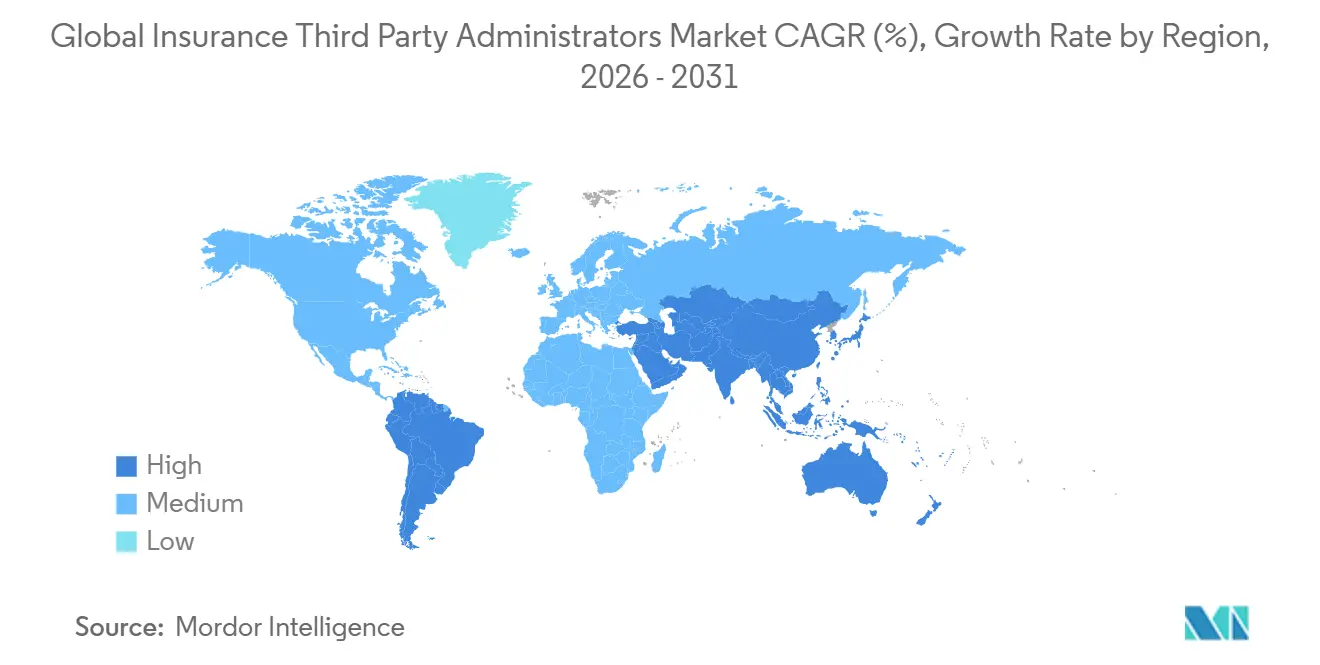
| Fastest Growing Market | Asia-Pacific |
| Largest Market | North America |
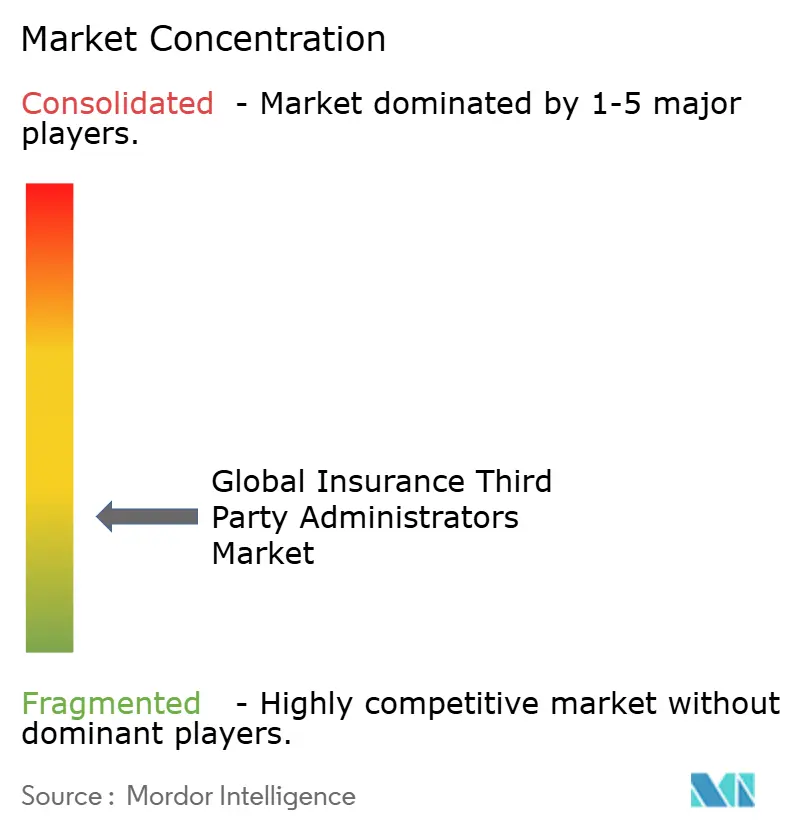
| Market Concentration | Low |
Major Players.webp) *Disclaimer: Major Players sorted in no particular order Image © Mordor Intelligence. Reuse requires attribution under CC BY 4.0. | |
Insurance Third Party Administrators Market Analysis by Mordor Intelligence
The Insurance Third Party Administrators Market size in terms of premium value is projected to be USD 548.91 billion in 2025, USD 592.52 billion in 2026, and reach USD 845.30 billion by 2031, growing at a CAGR of 7.36% from 2026 to 2031.
This reflects a robust long-term growth trajectory and underscores the increasing scale and significance of the TPA sector. A major factor driving this growth is the rising adoption of self-funded health plans, which require specialized administrative services for efficient claims management and regulatory compliance. Insurers are also increasingly shifting toward digital-first administration models, leveraging technology to streamline workflows, reduce operational costs, and enhance customer service. The use of advanced analytics is further transforming the market, enabling carriers to optimize risk allocation, monitor claims more effectively, and improve financial performance. These changes have accelerated the trend toward outsourcing administration, as insurers seek operational flexibility, scalability, and resilience. TPAs play a critical role in helping insurers navigate complex regulatory environments, multi-state licensing, and cybersecurity challenges. The need for real-time data management and audit-ready processes has become a central requirement, further emphasizing the importance of third-party expertise. In India, regulatory and policy initiatives are driving additional growth in the TPA market. Guidelines from IRDAI, the implementation of the National Health Claim Exchange, and the ongoing expansion of the Ayushman Bharat program are creating demand for scalable, compliant TPA solutions that can support multilingual engagement and efficient claims processing.
Key Report Takeaways
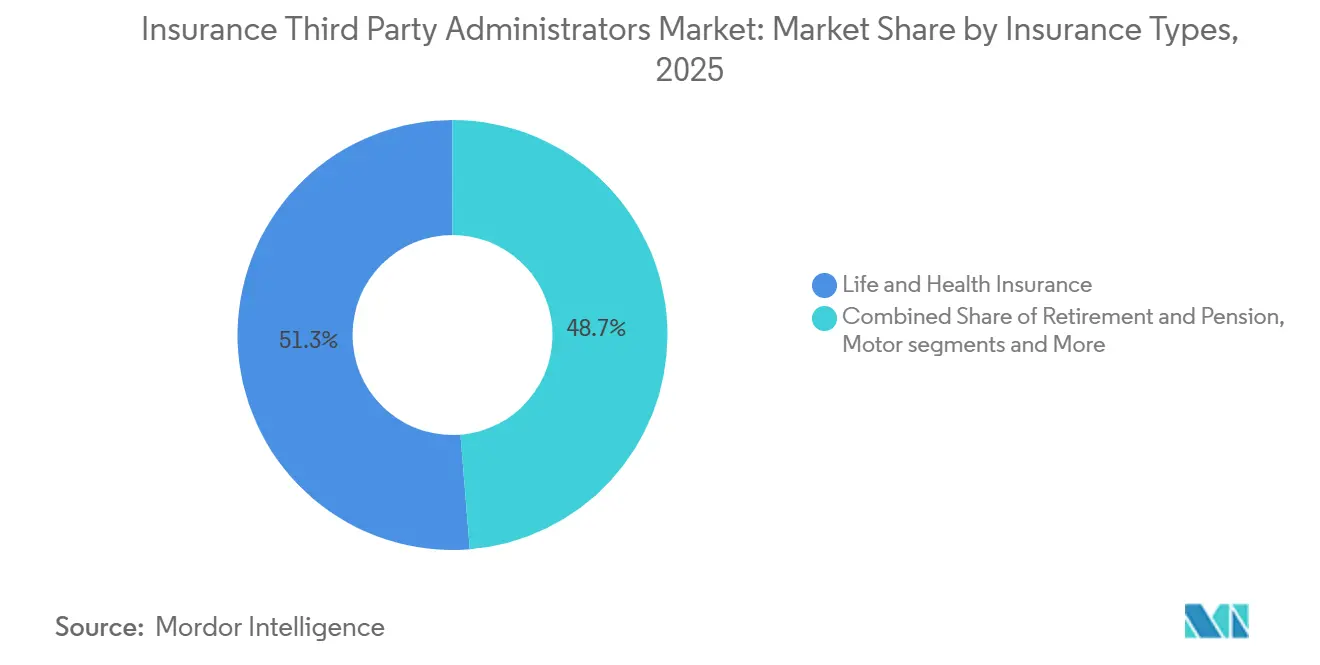
- By insurance type, life and health led in 2025 with 51.27% of the Insurance Third-Party Administrators Market share, while travel insurance TPAs posted the fastest 2026-2031 CAGR at 11.33%.
- By service type, claims administration accounted for 40.76% of the Insurance Third-Party Administrators Market share in 2025, and provider-network management registered the highest projected CAGR at 11.98%.
- By end user, insurers commanded 55.32% of the Insurance Third-Party Administrators Market share in 2025, and government health schemes are projected to grow at a 10.38% CAGR.
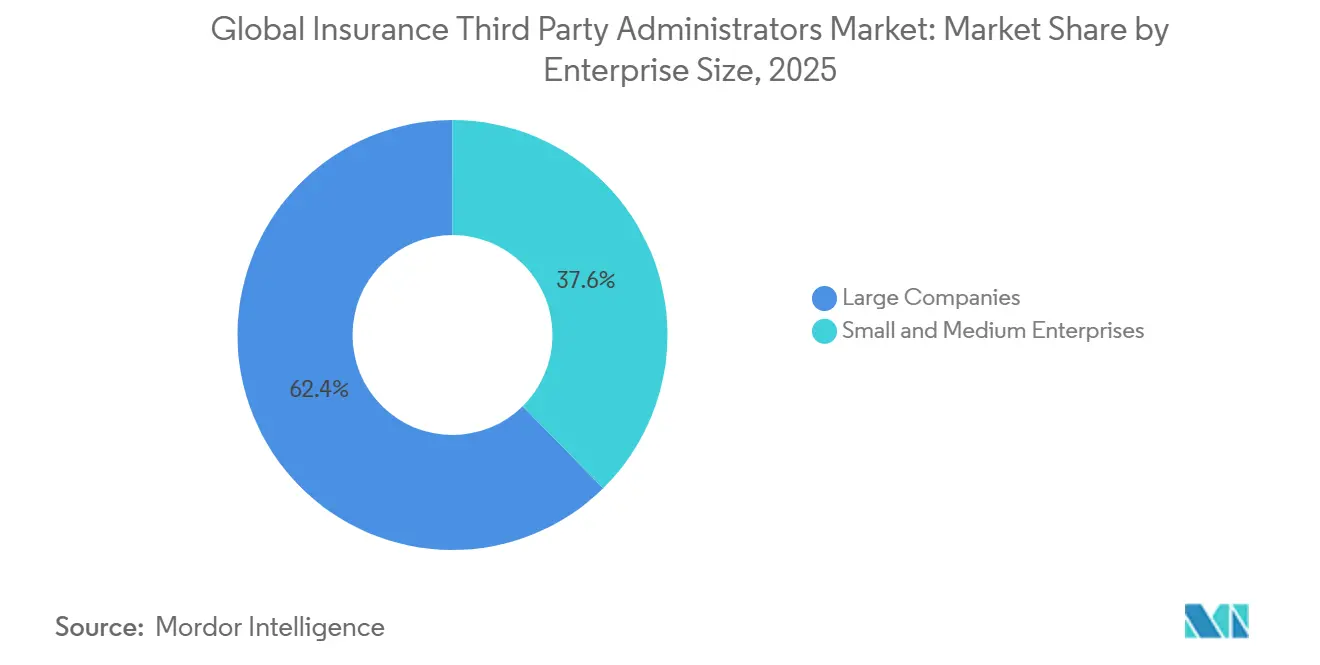
- By enterprise size, large companies held 62.37% of the Insurance Third-Party Administrators Market share in 2025, and small and medium enterprises are expected to grow at an 11.55% CAGR.
- By technology, cloud-based deployments represented 47.39% of the Insurance Third-Party Administrators Market share in 2025, and AI-enabled platforms advanced at 13.75% through 2031.
- North America retained 29.39% of the Insurance Third-Party Administrators Market share in 2025, while Asia-Pacific recorded an 11.36% CAGR.
Note: Market size and forecast figures in this report are generated using Mordor Intelligence’s proprietary estimation framework, updated with the latest available data and insights as of January 2026.
Global Insurance Third Party Administrators Market Trends and Insights
Drivers Impact Analysis*
| Driver | (~)% Impact on CAGR Forecast | Geographic Relevance | Impact Timeline |
|---|---|---|---|
| Rising self-funded health plans among mid-sized employers | +1.8% | Global, strongest in North America where 65% of covered workers in the United States are enrolled and with a spill-over into India and China via level-funded models. | Medium term (2-4 years) |
| Digitalization and hyper-automation in claims | +1.5% | North America and the EU, where 85% of insurers plan cloud by 2026, APAC follows with a lag. | Short term (≤ 2 years) |
| Regulatory push for cost transparency & value-based administration | +1.2% | National scope with early United States enforcement and EU data regimes shaping practice | Medium term (2–4 years) |
| AI-driven fraud analytics improving loss ratios | +1.0% | Global, with a concentration in North America and Europe, where coding accuracy reaches 95% | Short term (≤ 2 years) |
| Private-equity roll-ups enabling scale | +0.9% | North America core with extensions into Europe and selective MEA markets | Long term (≥ 4 years) |
| Embedded insurance models needing post-bind TPA support | +0.7% | Global, strongest in travel and fintech, with APAC mobile-first acceleration | Medium term (2–4 years) |
| Source: Mordor Intelligence | |||


Rising self-funded Health Plans Among Mid-sized Employers
Self-funded health coverage has become a mainstream choice, particularly among mid-sized and large employers. Among firms with 200 or more employees, the majority offer self-funded plans, while smaller and mid-sized firms increasingly adopt level-funded hybrid plans to manage risk and control costs. Average annual premiums for family coverage now exceed USD 26,900, with workers contributing nearly USD 6,850 on average, and single coverage deductibles averaging USD 1,886. These rising costs and the desire to avoid insurer risk loads have driven employers to consider self-funding, which allows greater control over plan design and financial exposure. High-deductible health plans with savings options and PPOs remain common, but self-funded arrangements are growing faster in larger firms. This expansion directly increases demand for third-party administrators that can provide stop-loss coverage, compliance support, and flexible, modular administrative services tailored to employer needs. As a result, self-funded adoption is reinforcing the TPA scale and sustaining the momentum of configurable benefits solutions across mid-sized employer segments. [1]Kaiser Family Foundation, “2025 Employer Health Benefits Survey,” kff.org.
Digitalization and Hyper-Automation in Claims
Digital-first claims processing is significantly reducing cycle times as insurers migrate to cloud platforms and deploy agentic AI for intake triage, fraud detection, and reserve optimization. These unified operating models minimize handoffs and rework, improving efficiency across the claims lifecycle. Generative coding tools now achieve high accuracy, reduce labor costs per claim, and lower denial rates, aligning automation with improved member experience. Leading platforms illustrate this transformation: Crawford’s co-pilot guides adjusters with next-best actions, Gallagher Bassett’s Luminos generates machine-driven claim summaries, and CorVel’s agentic workflows reduce manual steps in eligibility verification and medical necessity reviews. Sedgwick has extended automation into legal bill review and vendor management by integrating legal spend management software, enabling real-time overbilling detection for complex casualty programs. The TPA market benefits when proprietary AI leverages claims data, offering buyers comparable insights into automation depth and delivering measurable cost and service advantages, particularly across Indian enterprise portfolios that prioritize efficiency and transparency.
Regulatory Push for Cost Transparency & Value-Based Administration
Regulators are actively increasing transparency in healthcare pricing by requiring health plans and insurers to publicly disclose in-network negotiated rates, out-of-network allowed amounts, and prescription drug pricing through standardized, machine-readable files. Under the CMS Transparency in Coverage rules, these disclosures began for plan years on or after July 2022 and must be updated regularly, typically monthly, to ensure accuracy. Items or services with fewer than 20 claims may be omitted to protect privacy, while cost-sharing disclosures are being phased in for shoppable services and eventually all covered services. [2]Centers for Medicare & Medicaid Services, “Use of Pricing Information Published under the Transparency in Coverage Final Rule,” CMS, cms.gov. These requirements are intended to improve accessibility, support informed decision-making by employers, consumers, and other stakeholders, and provide a standardized framework for comparing healthcare costs. Public proposals and updates continue to enhance the usability and comparability of the data, including reorganizing disclosures by provider network and improving accessibility features. State-level efforts to harmonize travel coverage disclosures and licensing complement these federal directives, promoting consistency across jurisdictions. Employers and public purchasers are increasingly embedding affordability and quality metrics into their TPA selection and contracting processes, driving adoption of value-based administration.
AI-driven Fraud Analytics Improving Loss Ratios
Fraud, waste, and abuse continue to impact loss ratios significantly, and AI-driven analytics are increasingly helping TPAs detect upcoding, aberrant billing patterns, and other irregularities that human review may miss. Risk-scored triage ensures that only borderline cases are routed for manual review, protecting provider relationships and member experience while maintaining the deterrent effect on fraudulent activity. Greater transparency in pricing and claims data further enhances these gains by making outliers more visible, supporting targeted negotiations, and encouraging member routing toward higher-value providers. TPAs benefit from improved operational performance as early detection of improper charges reduces payment leakage and downstream disputes. Embedding fraud controls directly into claims workflows and maintaining robust model monitoring in compliance with HIPAA and local privacy regulations strengthens the value proposition for employers, particularly in markets like India, where health data governance standards are rising. Overall, AI-driven fraud analytics is driving efficiency, enhancing loss control, and reinforcing employer confidence in outsourcing claims administration.
Restraints Impact Analysis*
| Restraint | (~)% Impact on CAGR Forecast | Geographic Relevance | Impact Timeline |
|---|---|---|---|
| Rising cyber-risk and data-privacy liabilities | -1.1% | Global, with acute exposure in North America and the EU, and an emerging risk profile in APAC | Short term (≤ 2 years) |
| Complexity of multi-state licensing and compliance | -0.8% | North America and the Middle East, with state and country-level fragmentation | Medium term (2–4 years) |
| Pressure on fee margins from insurers’ in-house administration | -0.7% | North America and the EU with carrier-led platform modernization | Long term (≥ 4 years) |
| Acute shortage of AI and claims-technology talent | -0.6% | Global, with pronounced scarcity in North America and mature APAC markets | Medium term (2–4 years) |
| Source: Mordor Intelligence | |||
Rising Cyber-Risk and Data-Privacy Liabilities
Rising cyber threats and evolving data privacy regulations are creating significant challenges for TPAs and healthcare administrators. The IBM Cost of a Data Breach Report further highlights that the global average cost of a data breach is around 4.44 million USD, and organizations lacking AI governance and proper access controls face heightened risk exposure. Breaches in complex environments increase remediation costs, while companies leveraging AI and automation in security save roughly 1.9 million USD per incident. [3]IBM Institute for Business Value and Ponemon Institute, Cost of a Data Breach Report 2025, IBM, ibm.com. TPAs, which aggregate eligibility, claims, and payment data across thousands of clients, are particularly attractive targets, creating cascading liabilities under HIPAA, state data protection laws, and GDPR when compromised. Buyers now mandate SOC 2 Type II compliance, annual penetration tests, and cyber-insurance as baseline conditions, though zero-day exploits and credential theft demonstrate that compliance alone is not sufficient. GCC markets are experiencing rising exposure as health information exchanges in Saudi Arabia and the UAE connect payers, providers, and patients, expanding the attack surface even as digital mandates accelerate adoption.
Complexity of multi-state licensing and compliance
Regulatory requirements for TPAs vary widely across jurisdictions, creating a complex compliance landscape. Each state interprets TPA obligations differently, leading to duplicated filings, differing financial assurance requirements, and variable record-keeping standards for national operators. Even though self-insured ERISA plans fall under federal preemption, administrators may still need to obtain state licenses when managing fully insured blocks or lines outside ERISA’s scope, adding further variability. Oversight of related services, such as pharmacy benefits, increases reporting obligations, while penalties for non-compliance amplify operational risk. In international markets like the Middle East, TPAs must navigate multiple overlapping regulations with staggered implementation timelines, reflecting a similar need in India for state-specific operational adjustments despite national guidance.
*Our forecasts treat driver/restraint impacts as directional, not additive. The impact forecasts reflect baseline growth, mix effects, and variable interactions.
Segment Analysis
By Insurance Type: Travel Surges Ahead as Embedded Models Mature
Life and Health Insurance contributed 51.27% of total revenue in 2025, reflecting the complexity and regulatory requirements that lead employers and public programs to outsource administration under structured service-level agreements and audit-ready processes. The Insurance Third-Party Administrators market is seeing strong growth in travel insurance, where TPAs are positioned to expand rapidly as embedded distribution with airlines and online agencies converts a significant portion of bookings into coverage. The United States travel insurance segment is projected to nearly double over the coming years, with annual multi-trip policies for frequent travelers and remote workers driving much of the growth. Strategic acquisitions, such as PassportCard’s purchase of Pattern, demonstrate the focus on controlling embedded distribution while TPAs manage mobile claims, ID cards, and regulatory compliance behind the scenes. The market benefits when TPAs deliver point-of-sale coverage that scales across travel portals in India, maintaining fast claims turnaround and high customer satisfaction.
Travel administration is only one pillar of TPA activity, as retirement and pensions provide stable volumes despite fee compression, sustaining revenues for incumbents even in a competitive pricing environment. Commercial general liability and motor lines follow broader P&C trends, with carriers increasingly insourcing high-frequency, low-severity claims as cloud-based tools streamline adjudication workflows. Workers’ compensation remains a specialized niche requiring combined clinical management, subrogation, and litigation expertise that employers cannot replicate internally without substantial investment. Overall, the market is bifurcating by complexity, with commoditized health claims under AI and insourcing pressure while niche verticals preserve margins through specialized workflows and expert teams. India’s market reflects a similar split, as employers rely on TPAs for complex lines and embedded travel insurance while adjusting sourcing models for routine health claims in areas where carriers have strong digital capabilities.


By Service Type: Provider Networks Ascend as Cost Discipline Tightens
Claims administration accounted for 40.76% of service revenue in 2025, highlighting the continued centrality of claims handling and payment functions in third-party administration. Provider-network management is expected to grow rapidly as TPAs leverage claims history, quality metrics, and access modeling to build high-performing networks that reduce operating costs without compromising member satisfaction. The market benefits when data-driven network curation and personalized provider guidance improve outcomes, cost-efficiency, and convenience for members. Cost-transparency tools aligned with CMS machine-readable files further enhance employee decision-making, linking network design directly to member experience. In India, procurement increasingly emphasizes network depth, quality measures, and reporting granularity, pulling TPAs toward value-based administration with clear performance targets and corrective triggers.
Policy administration, billing, and enrollment continue to grow steadily as cloud platforms streamline onboarding, qualifying events, COBRA, and invoicing for standard plan designs. Risk and compliance services, including subrogation and Medicare Section 111 reporting, remain critical as penalties for lapses underscore their importance in complex programs. The TPA market is shifting as claims processing becomes a low-cost utility under AI, while network design, payment integrity, and compliance orchestration command premium pricing. Indian buyers now weigh the sophistication of network analytics and fraud controls alongside unit pricing when evaluating TPAs. Service providers that demonstrate measurable savings, robust audits, and performance-linked outcomes gain a competitive advantage in renewals and RFP processes.
By End User: Government Schemes Accelerate as Public Programs Outsource Scale
Insurers accounted for 55.32% of end-user spend in 2025, reflecting ASO contracts and self-funded employer blocks where carriers focus on underwriting and distribution while outsourcing administration. Government health schemes are projected to grow steadily as programs like India’s Ayushman Bharat scale and China’s public schemes move toward universal enrollment, requiring TPAs to handle high-volume adjudication across multiple state systems. In the United States, rising Medicare Advantage support needs, including prior authorization workflows and compliance with quality-linked metrics, mirror the capabilities required for Indian state programs. Self-insured employers remain a stable market, emphasizing service quality and measurable cost containment over unit price, particularly in mid-market segments demanding transparency and operational flexibility. Brokers and reinsurers act as smaller purchasers, often for captives or specialized programs, where TPAs split administration responsibilities across stakeholders with clear reporting to support risk financing.
In India, growth in government schemes drives both volume and capability expansion for TPAs, as mobile-first claims submission, vernacular-language support, and digital identity verification become baseline expectations. Administrative platforms must support centralized rules while enabling decentralized delivery to meet state health objectives and extend to commercial programs with similar operational needs. TPAs are increasingly required to provide digital evidence for all cost-control claims, including defensible fraud analytics models and streamlined provider credentialing across large panels. Rising end-user demand is fostering standardized service catalogs and layered SLAs that ensure consistent provider engagement and audit readiness in mixed public-private ecosystems. The market continues to reward TPAs that deliver reliable outcomes at scale while aligning system design with India’s policy framework and state-specific operational realities.
By Enterprise Size: SMEs Embrace Self-Funding as Level-Funded Plans Democratize Risk
Large enterprises accounted for 62.37% of revenue in 2025, driven by their high self-funding rates and demand for sophisticated administration that integrates reference-based pricing, direct contracting, captives, and targeted solutions. Small and medium enterprises are growing rapidly as level-funded plans allow even very small firms to self-insure, providing refunds when claims fall below funding levels, while stop-loss coverage limits exposure. The TPA market benefits when providers bundle network access, claims, and compliance into per-employee-per-month fees that resemble fully insured arrangements while unbundling components for cost transparency. Cloud-based platforms lower fixed-cost thresholds for serving smaller accounts, and AI accelerates underwriting and group size determination, simplifying adoption for SMEs. In India, SMEs increasingly expect standardized plan designs, streamlined enrollment, and digital support as baseline features, aligning with scalable TPA portfolios.
As SME adoption grows, the segment is expanding at a CAGR of 11.55% through 2031. TPAs achieve greater scale, enabling investments in automation and analytics that reduce administrative unit costs without sacrificing quality. The market sees continued SME growth as buyers value control, transparency, and refined pricing that accounts for adverse selection within level-funded programs. Procurement teams favor TPAs that offer fair refund policies, coordinated stop-loss coverage, and reliable support for qualifying events, minimizing administrative friction for HR teams. In India, localized support, compliance interpretation, and platform stability further enhance SME engagement and trust in TPAs. These trends allow TPAs to leverage SME wins to drive operating efficiency, fund platform enhancements, and improve service quality and audit readiness across their portfolios.
By Technology: AI-Enabled Platforms Race Ahead as Cloud Becomes Table Stakes
Cloud-based deployments accounted for 47.39% of technology usage in 2025 as insurers shifted from on-premise systems to gain elastic capacity, rapid updates, and streamlined operations during open enrollment and renewal periods. The TPA market is projected to reach 85% cloud adoption among insurers and administrators, consolidating security patching, simplifying integration, and improving total cost of ownership across multiple lines. On-premise systems remain necessary where data residency or security requirements demand local deployment, particularly in specific GCC states or sensitive sectors, but the long-term trend favors scalable, resilient cloud platforms. AI-enabled platforms are leading growth, with generative models and predictive analytics embedded into claims and network workflows to increase accuracy, reduce labor, and lower denial rates. In India, AI adoption aligns with public digital infrastructure and rising expectations for self-service, multilingual support, and transparent tracking of claims throughout all stages.
Blockchain deployments remain experimental, with limited production use such as synchronizing accumulators between medical and pharmacy systems, demonstrating feasibility but awaiting broader commercial adoption. The TPA market is evolving into a technology hierarchy where cloud serves as the baseline, AI provides differentiation, and blockchain emerges based on proven value cases. Proprietary model training creates a durable advantage, as claim corpuses and client-specific workflows enhance predictive performance beyond generic tools. Indian procurement increasingly evaluates model outputs through pilot runs and outcome baselines before scaling, favoring TPAs with robust MLOps and compliance governance. Platforms that embed explainability and audit trails will be rewarded, as regulators and enterprise risk teams demand transparency while data use scales across complex healthcare ecosystems.
Geography Analysis
North America held 29.39% of the 2025 Insurance Third-Party Administrators market, supported by a strong self-funded foundation where a large share of United States workers participate in self-insured plans and substantial funds flow through TPAs under ASO and direct administration structures. Procurement expectations have shifted toward strategic partnerships, as seen in Delaware’s RFPs emphasizing advanced payment models and chronic-condition programs that go beyond basic claims processing. Market growth is slowing compared with post-ACA periods, as large-firm self-funding reaches saturation, and incremental expansion depends on mid-market and SME adoption driven by clear ROI from TPA capabilities. Technology adoption is mature, with cloud platforms and generative AI becoming mainstream and operational improvements such as lower denial rates demonstrating measurable value to clients. Regulatory complexity, including transparency file requirements, No Surprises Act arbitration, PBM state laws, and TCPA litigation exposure, favors TPAs with robust legal, compliance, and IT infrastructure.
Asia-Pacific is projected to grow at an 11.36% CAGR from 2026 to 2031, fueled by China’s broad basic medical insurance coverage and India’s strong annual expansion in life insurance, which expands administrative demand. Digital-first initiatives like India’s National Health Claim Exchange and IRDAI guidelines under Ayushman Bharat support standardized data exchange and scalable TPA partnerships. Mobile-first populations and multilingual needs drive investment in platforms that balance localized service with central governance. Competitive dynamics include local specialists navigating provincial rules alongside multinational entrants serving cross-border employers and expatriates, creating diverse sourcing options. Sustained growth depends on strong execution in data governance, cybersecurity, and value-based frameworks that enable payer-provider collaboration as regional regulations evolve.
Europe, the Middle East, and Africa show steady gains, with the GCC standing out due to expatriate coverage mandates, where the UAE and Saudi Arabia contribute the largest share of health insurance premiums. HIE platforms in the Middle East accelerate the adoption of AI for claims and fraud management, speeding up the path to digital maturity for TPAs. European markets continue steady TPA growth, supported by outsourcing and digitization trends, while profitability improvements among carriers encourage strategic investments in complex claims management and cross-border coverage. Latin America grew 7.5% year-over-year in 2025 across the insurance sector, but regulatory fragmentation and currency volatility limit TPA penetration to below 5% of regional premiums. For India-focused multinationals, these regional patterns shape strategies for risk pooling, shared services, and vendor selection to balance global standards with local execution in the TPA market.

Competitive Landscape
The Insurance Third-Party Administrators market is moderately to highly fragmented globally, with consolidation accelerating as private equity-backed platforms acquire regional specialists to create national footprints. Independent TPAs serve a significant portion of private health-plan workers and coexist with insurer-affiliated divisions, creating a market that balances scale with specialization. Major carriers have historically relied on TPAs for covered lives, but the insourcing of high-volume, low-complexity claims is rising due to cloud modernization, reshaping how procurement allocates administrative categories. In the Middle East, over 120 registered TPAs intensify competition even as expatriate mandates drive demand for scalable administration. For India, the market includes regional specialists addressing state priorities alongside global platforms that set benchmarks for cybersecurity, AI, and regulatory compliance.
Innovation across technology, network design, and service bundling continues to drive operational efficiency, with AI-first approaches delivering the largest leverage through coding accuracy and workflow-embedded denial-rate improvements. Platforms like Crawford’s co-pilot boost adjuster productivity, Gallagher Bassett’s Luminos streamlines case summarization, and Sedgwick’s legal spend software flags anomalies in real time for complex claims. [4]Sedgwick Communications, “Sedgwick Announces Closing of USD 1B Equity Investment,” Sedgwick, sedgwick.com. Provider networks are optimized using claims and quality data to curate high-value providers, supporting transparency mandates and member-directed choice. Strategic acquisitions enhance service breadth, exemplified by Gallagher Bassett’s acquisition of Safe T Professionals and Davies’ SCM purchase, which expanded cross-border claims and forensic capabilities. Bundling adjacent services such as legal bill review, subrogation, and Medicare reporting helps TPAs retain clients and comply with evolving regulatory standards, including those in India.
White-space opportunities remain as government schemes expand, SMEs adopt level-funded plans, and embedded insurance grows beyond travel into areas like renters and automotive coverage. APAC specialists leverage mobile adoption and local-language support, while blockchain pilots explore synchronization between pharmacy and medical systems, though commercial adoption is limited. Indian buyers increasingly demand API-centric integrations, verifiable ROI on fraud and payment integrity, and transparent fee structures that pass audit review. Private equity roll-ups will continue to shape market dynamics, but independent, tech-focused TPAs can defend niches with speed, configurability, and domain expertise. Overall, the market balances consolidation pressures with persistent specialization driven by product complexity, regulatory diversity, and client demand for measurable outcomes.
Insurance Third Party Administrators Industry Leaders
Sedgwick Claims Management Services Ltd
Crawford & Company
Maritain Health
UMR Inc.
Gallagher Bassett Services Inc.
- *Disclaimer: Major Players sorted in no particular order

Recent Industry Developments
- November 2025: Davies Group signed an agreement to acquire SCM Insurance Services, Canada's largest claims processing and risk solutions provider, for an undisclosed sum, creating a global entity with approximately USD 1.4 billion in annual revenues and 9,500 colleagues across 22 countries.
- October 2025: Gallagher Bassett finalized the acquisition of Safe T Professionals LLC, a Chandler, Arizona-based provider of construction and manufacturing safety management services with nearly 200 safety professionals, integrating the firm into its Technical Services division to expand risk-control and safety solutions nationwide across North America.
- October 2025: Roy Medical Assistance officially launched comprehensive TPA and international medical assistance services in Bahrain, a strategic expansion solidifying its Middle East presence as part of a regional growth trajectory. The integrated model combines core TPA functions (claims processing, case monitoring) with 24/7 emergency medical assistance, backed by a global footprint spanning 24 countries and a Preferred Provider Network exceeding 6,000 providers.
- February 2025: Sedgwick announced the acquisition of Bottomline's legal spend management division, which provides Legal-X and Legal eXchange software and bill review solutions to carriers, TPAs, and corporate legal departments, with 300 employees transitioning and the division operating separately.


Research Methodology Framework and Report Scope
Market Definitions and Key Coverage
According to Mordor Intelligence, the insurance third-party administrators (TPA) market covers every licensed organization that, for a fee, undertakes claims adjudication, policy and benefits administration, provider-network management, and related analytics on behalf of insurers or self-funded plans across life, health, and property and casualty lines worldwide.
Scope exclusion: in-house insurer service centers, pure software vendors, and captive reinsurer units are not counted.
Segmentation Overview
- By Insurance Type
- Life and Health Insurance
- Retirement & Pension
- Commercial General Liability
- Motor
- Workers' Compensation
- Travel
- Others
- By Service Type
- Claims Management
- Policy Administration
- Billing & Enrollment
- Provider-Network Management
- Risk & Compliance Services
- By End User
- Insurance Companies
- Self-insured Employers
- Government Health Schemes
- Brokers & Reinsurers
- By Enterprise Size
- Large Enterprises
- Small & Medium Enterprises
- By Technology
- Cloud-based Platforms
- On-premise Solutions
- AI-enabled TPAs
- Blockchain-enabled TPAs
- By Geography
- North America
- United States
- Canada
- Mexico
- South America
- Brazil
- Argentina
- Rest of South America
- Europe
- United Kingdom
- Germany
- France
- Italy
- Spain
- Russia
- Rest of Europe
- Asia-Pacific
- China
- India
- Japan
- Australia
- South Korea
- Rest of Asia-Pacific
- Middle East & Africa
- United Arab Emirates
- Saudi Arabia
- South Africa
- Rest of Middle East & Africa
- North America
Detailed Research Methodology and Data Validation
Primary Research
Interviews and pulse surveys with claims managers, benefits consultants, regional regulators, and TPA technology heads across North America, Europe, Asia-Pacific, and the GCC validated pricing spreads, outsourcing triggers, and adoption lags that are not visible in public datasets. These conversations helped refine average administration fees, policy volumes, and digital conversion timelines.
Desk Research
Our analysts gathered baseline figures from publicly available tier-1 sources such as the National Association of Insurance Commissioners, OECD Insurance Statistics, Swiss Re Sigma world insurance datasets, and filings to the U.S. Department of Labor for self-funded health plans. Company 10-Ks, investor decks, trade association white papers (e.g., AHIP, APCIA), and regulatory circulars supplied cost ratios, fee income mixes, and regional penetration clues. Dow Jones Factiva and D&B Hoovers supplemented revenue splits and recent acquisitions that shift market share.
Macro indicators, insurance density, employer self-funding rates, healthcare expenditure, and cloud adoption indices were extracted country by country, standardized to 2024 USD, and aligned with the study period. The desk sources listed are illustrative only; many other references were reviewed for cross-checks and clarification.
Market-Sizing & Forecasting
A top-down build, starting with carrier premium pools, employer self-insured spend, and government scheme budgets, is reconciled with selective bottom-up checks such as sampled administrator fee per claim and regional provider roll-ups. Key variables feeding the model include: 1. Self-funded plan prevalence by firm size 2. Average claims frequency per covered life 3. Mean administration fee per claim by service bundle 4. Cloud TPA platform penetration 5. Regulatory outsourcing caps or incentives
Historical series run through multivariate regression with scenario overlays for fee compression and digital efficiency gains; the preferred forecast engine is ARIMA supplemented by expert consensus adjustments where data gaps persist.
Data Validation & Update Cycle
Outputs pass three-layer variance reviews, anomaly flags trigger re-contact with respondents, and senior analysts sign off only after numbers align with independent insurance spend benchmarks. Reports refresh annually, with interim updates when material events, large M&A, sudden regulatory shifts, and pandemic spikes emerge.
Why Mordor's Insurance Third Party Administrators Market Baseline Remains Dependable
Published estimates often diverge because firms slice the market differently, apply dissimilar fee assumptions, or refresh data on uneven cadences. We acknowledge these realities upfront.
Key gap drivers include narrower service scopes that omit provider-network management revenue, aggressive double-digit growth assumptions tied to niche cloud TPAs, or the exclusion of self-funded health plans from some models. Mordor Intelligence applies a common fee architecture, uses blended premium plus claim volume multipliers, and refreshes forecasts every twelve months, thereby dampening volatility.
Benchmark comparison
| Market Size | Anonymized source | Primary gap driver |
|---|---|---|
| USD 519.65 B (2025) | Mordor Intelligence | - |
| USD 324.90 B (2022) | Global Consultancy A | Counts only claims processing revenue; limited geography set |
| USD 390.27 B (2024) | Research House B | Inflates forecast via uniform 9 % CAGR without fee compression checks |
| USD 300.80 B (2022) | Trade Journal C | Excludes self-funded employer plans and ancillary network services |
The comparison shows that when consistent scope, multi-source validation, and yearly refresh cadence are applied, Mordor's baseline presents the most balanced and reproducible view for strategic decisions.


Key Questions Answered in the Report
What is the current Insurance Third-Party Administrators market size and expected growth to 2031?
The Insurance Third-Party Administrators market stands at USD 592.52 billion in 2026 and is projected to reach USD 845.30 billion by 2031 at a 7.36% CAGR, indicating steady growth underpinned by self-funding adoption, digitization, and regulatory transparency.
Which segments lead in share and growth within this space?
In 2025, Life and Health led by insurance type with a 51.27% share, while travel TPAs posted the fastest 2026–2031 growth at 11.33%, and by service type, claims held a 40.76% share with provider networks growing at 11.98%.
How does India influence regional dynamics for TPAs?
India’s IRDAI guidance, the National Health Claim Exchange, and Ayushman Bharat’s scaling claims volume drive demand for digital-first TPAs with localized compliance and multilingual support, which elevates service expectations and data governance standards.
Which geographies show the strongest momentum for TPAs?
Asia-Pacific leads growth at 11.36% CAGR, supported by near-universal public coverage in China and ongoing expansion in India, while North America remains the largest by share with strong self-funding penetration.
What is pressuring TPA margins, and how are providers responding?
Carrier insourcing of routine claims and demands for fee transparency compress margins while payment-integrity edits, fraud analytics, and network design capabilities help TPAs protect profitability and defend renewals.
Page last updated on:


