Market Overview
| Study Period | 2019 - 2031 |
|---|---|
| Forecast Data Period | 2026 - 2031 |
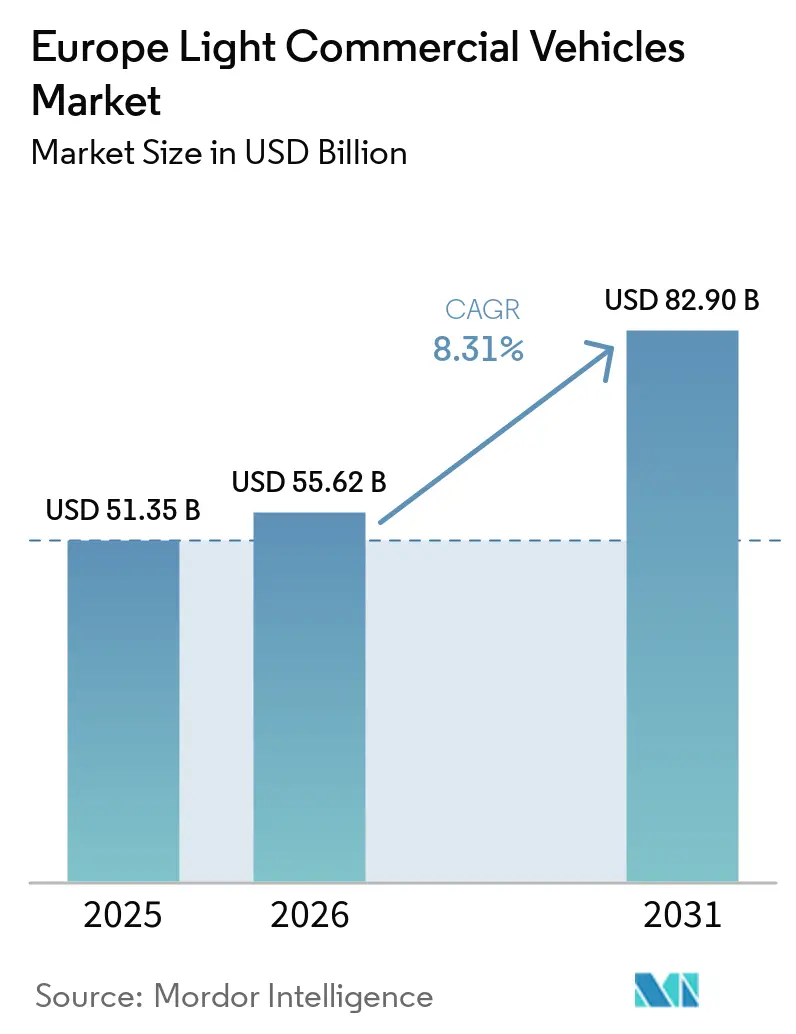
| Base Year Market Size (2025) | USD 51.35 Billion |
| Market Size (2026) | USD 55.62 Billion |
| Market Size (2031) | USD 82.90 Billion |
| Growth Rate (2026 - 2031) | 8.31% CAGR |
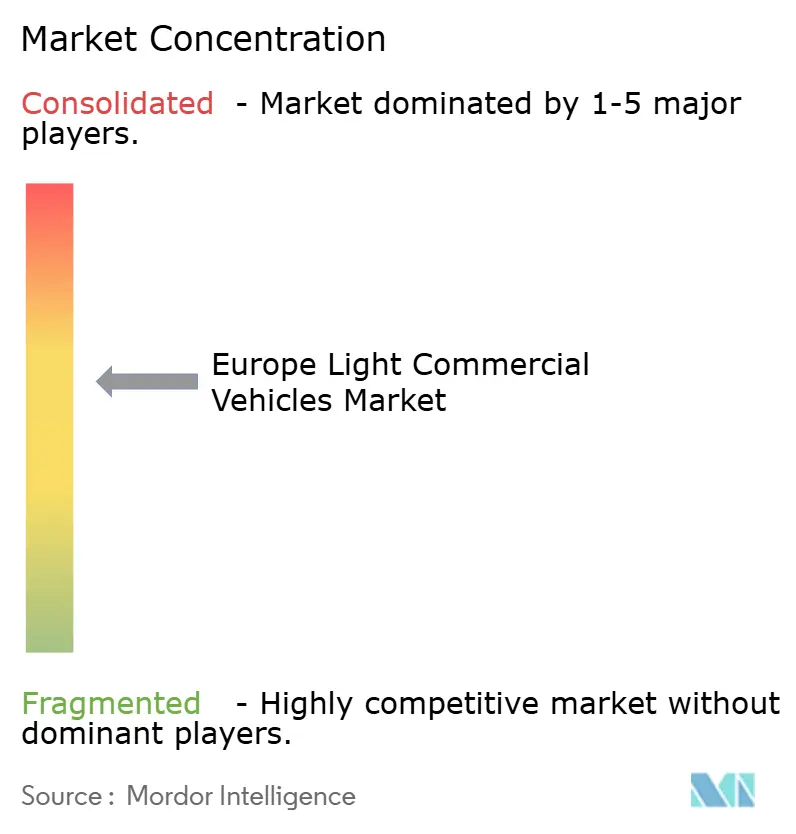
| Market Concentration | Medium |
Major Players
*Disclaimer: Major Players sorted in no particular order Image © Mordor Intelligence. Reuse requires attribution under CC BY 4.0. |
|
Europe Light Commercial Vehicles Market Analysis by Mordor Intelligence
The European light commercial vehicles market size is expected to grow from USD 51.35 billion in 2025 to USD 55.62 billion in 2026 and is forecast to reach USD 82.90 billion by 2031 at an 8.31% CAGR over 2026–2031. Growth is propelled by record e-commerce parcel volumes, the rapid rollout of low-emission zones, and subsidy-backed fleet electrification that tilts total cost of ownership in favor of battery electric vans. Battery electric models recorded a 34.91% CAGR to 2031, quadrupling the overall market pace as operators accelerate diesel replacement to avoid Euro 7 penalties and daily access charges. The sub-2.0 tonne gross-weight class is rising fastest, supported by quick-commerce platforms that prioritize nimble vehicles able to park curbside in congested city cores.
Key Report Takeaways
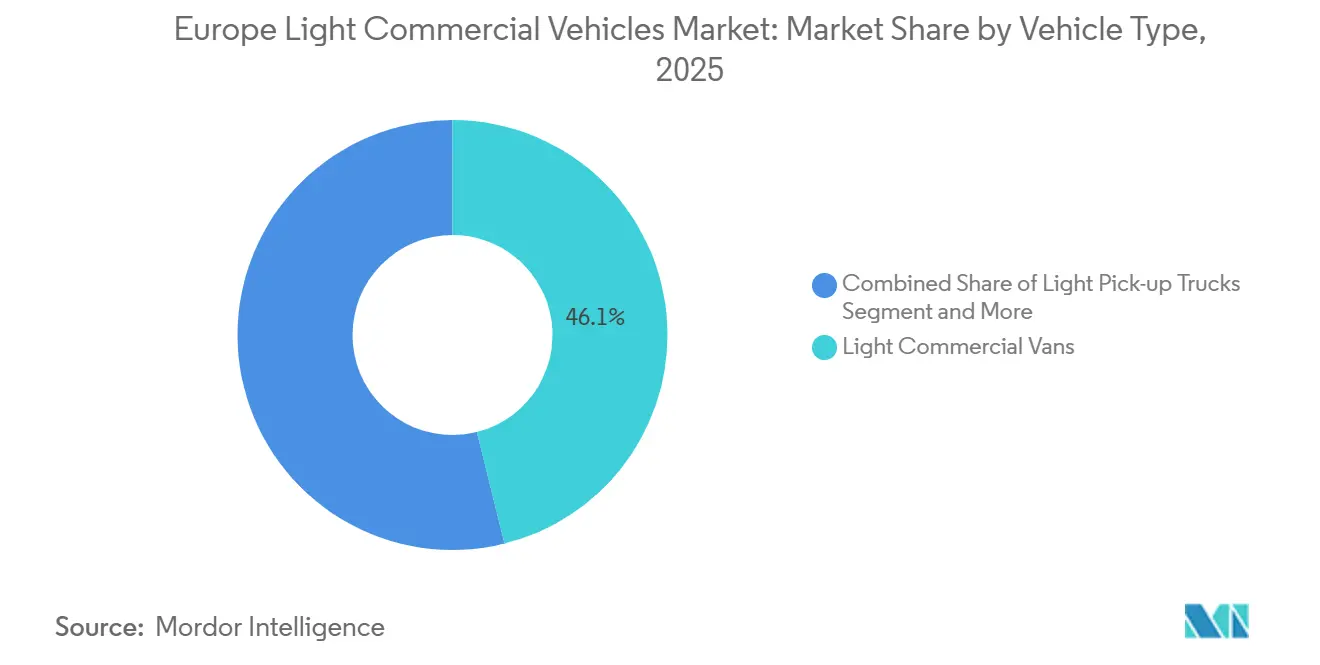
- By vehicle type, light commercial vans held 46.11% of the European light commercial vehicle market share in 2025, while battery-electric vans in this category are projected to grow at an 18.67% CAGR through 2031.
- By gross vehicle weight, the 2.6-3.0 tonne class commanded 41.34% of the European light commercial vehicles market size in 2025, whereas the sub-2.0 tonne class is expanding at a 12.28% CAGR to 2031.
- By propulsion, diesel still accounted for 62.47% of the market, yet battery-electric vehicles are projected to post a 34.91% CAGR and surpass 50% by 2031.
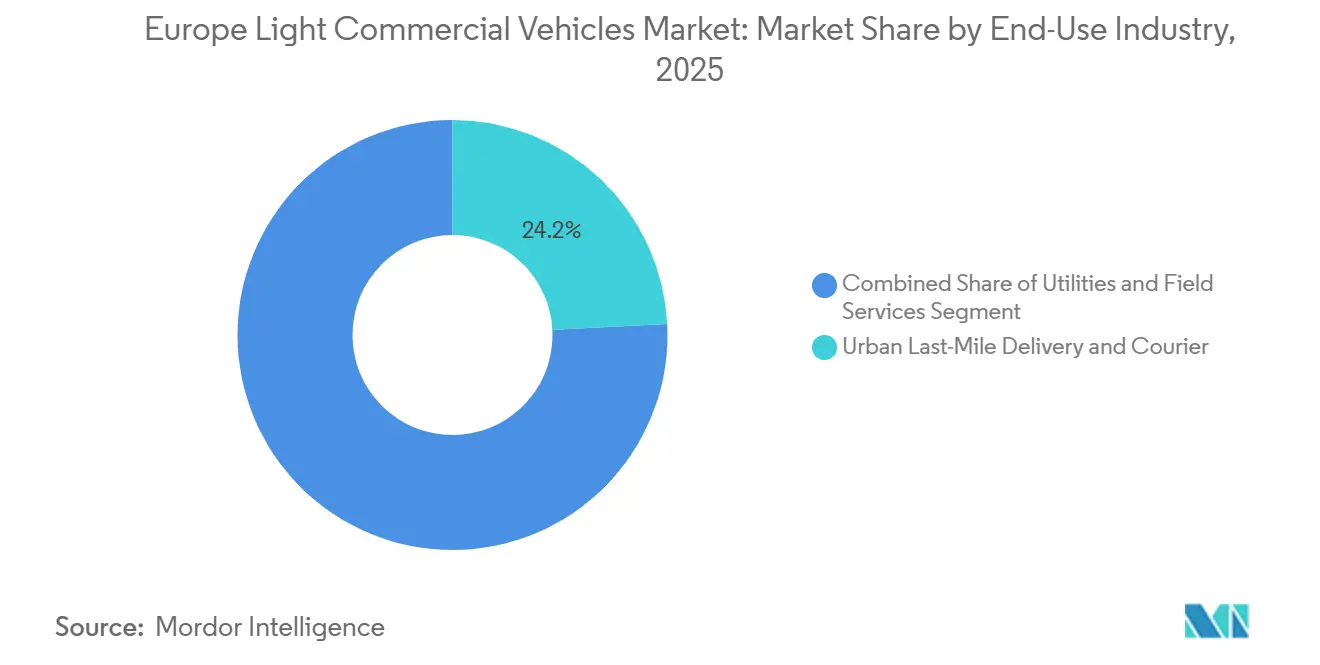
- By end use, urban last-mile delivery accounted for 24.18% of 2025 demand and is advancing at a 21.76% CAGR through 2031, the highest across all sectors.
- By ownership type, corporate fleets accounted for 38.52% of the market share in 2025 and are projected to expand at a 17.93% CAGR through 2031.
- By geography, Germany retained an 18.26% market share in 2025, whereas Norway is forecast to expand at a 13.44% CAGR through 2031.
Note: Market size and forecast figures in this report are generated using Mordor Intelligence’s proprietary estimation framework, updated with the latest available data and insights as of January 2026.
Europe Light Commercial Vehicles Market Trends and Insights
Drivers Impact Analysis*
| Driver | (~) % Impact on CAGR Forecast | Geographic Relevance | Impact Timeline |
|---|---|---|---|
| E-Commerce-Driven Last-Mile Delivery Boom | +2.8% | Germany, United Kingdom, France, Benelux | Short term (≤ 2 years) |
| Stricter EU CO₂ and NOx Limits | +2.1% | EU-27, United Kingdom, Norway | Medium term (2-4 years) |
| Government Fleet-Renewal Incentives | +1.9% | France, Germany, Spain, Italy | Short term (≤ 2 years) |
| Proliferation of Urban Low-Emission Zones (LEZs) | +1.7% | Major metropolitan areas | Medium term (2-4 years) |
| Modular Up-Fitting Platforms Enabling Quick Body Swaps | +0.7% | Western Europe OEM hubs | Long term (≥ 4 years) |
| Vehicle-to-Grid (V2G) Revenue Stacks Enhancing TCO | +0.6% | Netherlands, Denmark, Germany | Long term (≥ 4 years) |
| Source: Mordor Intelligence | |||


E-Commerce-Driven Last-Mile Delivery Boom
Parcel volumes in Europe are projected to continue growing, driven by e‑commerce and same-day delivery demand. Leading markets such as Germany, the UK, and France each handle several billion parcels annually, with overall European parcel volumes expected to increase steadily year-on-year. Logistics operators respond by adding zero-emission vans that secure unrestricted access to the city center. Amazon is committed to deploying 10,000 electric delivery vans across Germany, France, and Spain by the end of 2026, following agreements with Rivian and Mercedes-Benz. Quick-commerce firms such as Getir and Gorillas prefer sub-2.0-ton micro-vans, reinforcing double-digit growth in that weight class. Retailers continue to offer in-house delivery to protect brand experience, creating captive demand for purpose-built electric LCVs pre-equipped with telematics and route-optimization software.
Stricter EU CO₂ and NOx Limits for City Access
The EU’s CO₂ emission performance standards regulation (Regulation (EU) 2019/631) requires that the average CO₂ emissions of new vans (light commercial vehicles) be reduced by approximately 50 % by 2030 compared to 2021 levels, under current law[1]"Reduction in CO2 emissions of new passenger cars and of new light commercial vehicles," EUR-Lex, eur-lex.europa.eu. OEMs are front-loading battery electric launches, for instance, Stellantis released the Peugeot e-Partner and Citroën ë-Berlingo in March 2025, targeting tradespeople traversing daily low-emission zones. London expanded its Ultra-Low Emission Zone to all 32 boroughs in August 2025, imposing a GBP 12.50 daily charge on non-compliant vans, accelerating fleet replacement cycles. Paris enforced a diesel van ban within the Périphérique in January 2025, while Euro 7 standards, coming in 2027, mandate real-world emissions tests that further shift economics toward zero-emission powertrains.
Government Fleet-Renewal Incentives and Scrappage
France extended its Prime à la Conversion scheme through December 2026, paying up to EUR 9,000 to scrap pre-2011 diesel vans and purchase a BEV, with a EUR 2,000 rural-SME bonus[2]"What is the scrappage bonus?" Ministry of the Economy, economie.gouv.fr . Berlin and Munich add municipal grants to Germany’s federal subsidy, trimming BEV premiums below EUR 5,000 for qualifying buyers. Spain’s MOVES III program allocated EUR 400 million to electric LCVs in 2025, driving a 34% surge in registrations among government fleets. Italy re-engineered its Ecobonus in January 2025 to exclude hybrids and to allocate EUR 150 million to pure-electric vans with a payload over 800 kg, accelerating the uptake of the Iveco eDaily and Fiat E-Ducato.
Proliferation of Urban Low-Emission Zones (LEZs)
Europe is experiencing a significant expansion of Low Emission Zones (LEZs) as cities work to improve urban air quality and achieve climate goals[3]Katharine Swindells, "Will low-emission zones help European cities reach climate neutrality?" City Monitor, citymonitor.ai. These zones restrict or penalize high-emission vehicles, including older diesel and petrol light commercial vehicles, encouraging fleets to adopt electric or low-emission alternatives. Amsterdam banned all diesel vans in April 2025, while Madrid restricts weekday access to zero-emission badge holders, creating a two-tier logistics market with premium rates for compliant fleets. Brussels plans to phase out diesel LCVs by 2030 and petrol by 2035, forcing operators to harmonize on electric powertrains.
Restraints Impact Analysis*
| Restraint | (~) % Impact on CAGR Forecast | Geographic Relevance | Impact Timeline |
|---|---|---|---|
| Up-Front EV Van Cost Premium | -1.2% | Eastern Europe | Short term (≤ 2 years) |
| Semiconductor and Battery-Cell Supply Constraints | -0.9% | Germany, France, Spain | Medium term (2-4 years) |
| Payload Penalties from Heavy Battery Packs | -0.5% | Norway, Sweden | Medium term (2-4 years) |
| Slow Homologation Cycles for Fuel-Cell LCVs | -0.3% | Germany, Netherlands, France | Long term (≥ 4 years) |
| Source: Mordor Intelligence | |||
Up-Front EV Van Cost Premium
A mid-size BEV van in 2025 carried a EUR 12,000-18,000 premium over diesel, shrinking to EUR 8,000-10,000 after incentives, yet still deterring SMEs in Eastern Europe with limited access to low-cost credit. Poland’s electric LCV registrations rose only 9% in 2025, compared with 34% in Germany, mirroring weaker subsidy structures. Battery-as-a-service contracts reduce purchase prices by EUR 6,000-8,000 but add monthly fees, leaving rural operators with lower mileage outside the break-even range.
Semiconductor and Battery-Cell Supply Constraints
Lead times for power-management chips dedicated to 800-volt electric architectures remained 16-20 weeks in early 2025, postponing production of Ford E-Transit Custom and Mercedes eSprinter models. European gigafactory capacity reached 450 GWh in 2025 but lagged the 520 GWh demand projection, prompting Stellantis to prioritize higher-margin passenger EVs and constrain Opel Vivaro-e output. A 75 kWh pack adds 400-500 kg, reducing cargo by up to 15% for regional delivery fleets, a trade-off scrutinized by operators in Scandinavia where long rural routes remain common.
*Our forecasts treat driver/restraint impacts as directional, not additive. The impact forecasts reflect baseline growth, mix effects, and variable interactions.
Segment Analysis
By Vehicle Type: Vans Anchor Volume, BEVs Drive Value
Light commercial vans captured 46.11% of Europe's light commercial vehicle market share in 2025, anchored by familiar box-van formats that now ship with standardized 50-80 kWh battery packs capable of 240-300 km real-world range. The category is forecast to post an 18.67% CAGR through 2031 as postal services and courier companies lock in bulk orders that lower pack costs by a further 14%. Pick-ups serving construction and agriculture remain dominated by diesel, yet electric variants are entering pilot trials as bidirectional-power sockets enable on-site tool use. Micro-LCVs such as the Citroën Ami Cargo tripled registrations in 2025 and now appeal to quick-commerce firms that value ease of curbside parking.
Platform-cab and chassis-cab variants accounted for 18% of volume, with body-in-white designs that simplify upfitting for refrigeration, mobile workshops, or tipper beds. Modular architectures adopted by Stellantis cut body-swap lead times to 6-8 weeks, half the industry average, allowing fleets to redeploy chassis across duty cycles. Homologation under EU Whole Vehicle Type Approval continues to add 6-9 months for niche bodies, although digital twins and virtual testing are shortening physical crash-validation phases.


By Gross Vehicle Weight Class: Mid-Range Dominates, Micro Segment Accelerates
The 2.6-3.0 ton class accounted for 41.34% of Europe's light commercial vehicle market in 2025, offering the best payload-to-range compromise for urban and peri-urban logistics. Operators appreciate that drivers can operate these vans with standard Category B licenses, eliminating the need for additional training or higher wages. Sub-2.0-ton vans, while smaller, are growing at a 12.28% CAGR to 2031 as quick-commerce firms require agile platforms able to slip through congestion-charge windows without weight-based toll surcharges.
The 3.1-3.5 ton bracket supports furniture delivery and light construction, yet diesel still commands 78% share, given energy-density limitations for battery packs at higher curb weights. CATL’s shift toward cost-efficient LFP chemistry now supplies Renault and Nissan, trimming pack pricing by 15-20% and starting to make electric adoption viable in the mid-weight segment.
By Propulsion Type: Diesel Retreats, BEV Surges
Diesel engines accounted for 62.47% of the European light commercial vehicles market share in 2025. Still, their portion is set to shrink to 38% by 2031 as operators pull forward replacement cycles ahead of Euro 7 certification costs. Battery electric vans will bridge most of that gap, advancing at a 34.91% CAGR on the back of falling pack prices and widening city-center access restrictions. Plug-in hybrids remained marginal at 3.2% in 2025 because fleets view their 40–50 km electric-only range as inadequate for urban duty cycles. Hydrogen fuel-cell vans stayed below 1,200 units, concentrated in Germany and the Netherlands, where more than 150 public refueling stations now operate.
Battery electric models will exceed 50% of annual registrations by 2031, unlocking new revenue from vehicle-to-grid trials that return EUR 500-800 per van each year and shorten payback periods. Stellantis and Renault have already scheduled the phase-out of PHEV offerings by 2027 to concentrate engineering budgets on longer-range BEVs that can rapid-charge to 80% in under 30 minutes. The European light commercial vehicles market size in the BEV sub-segment will therefore rise faster than any other propulsion category, lifting supplier demand for lithium-iron-phosphate cells that cost 15-20% less than NMC chemistry. Residual-value guarantees from leasing firms are also smoothing adoption curves by offsetting concerns about future battery degradation.
By End-Use Industry: Last-Mile Leads, Utilities Electrify
Urban last-mile delivery accounted for 24.18% of demand in 2025 and is projected to expand at a 21.76% CAGR through 2031 as retailers internalize logistics to protect the customer experience and bypass third-party surcharges. DHL Express alone ordered 7,500 battery electric vans in 2025, aiming for 60% zero-emission coverage of European urban routes by 2028. Utilities and field-service operators followed, controlling 19.3% of the 2025 base after distribution network owners in the United Kingdom and France electrified more than 1,200 service vans. Construction and building-supply fleets lag because payload penalties and towing limits still favor diesel for heavy loads.
Postal incumbents such as Deutsche Post and Royal Mail face statutory zero-emission mandates in core cities by 2028, locking in multi-year framework agreements for electric chassis at volume discounts of up to 12%. Agriculture and rural services account for 8.9% of demand, but limited charging infrastructure extends diesel lifecycles beyond 2031 for these operators. Specialist mobile workshops—veterinary units, broadcast vans, emergency response—now choose e-platforms offering factory-fitted 2.3 kW onboard power to run tools without idling engines. Collectively, these dynamics will keep last-mile and utilities at the top of growth rankings while other sectors move at a steadier pace.
By Ownership/Fleet Type: Corporates Lead, SMEs Follow
Corporate fleets controlled 38.52% of registrations in 2025 and are forecast to grow at a 17.93% CAGR as telematics-enabled depots optimize charging windows and secure off-peak electricity tariffs. Amazon, DHL, and Coca-Cola European Partners already operate more than 45,000 electric vans, pooling procurement to cut battery pack costs below USD 95 per kWh—about 14% under the European average. Rental and leasing companies captured a 9.2% share by bundling maintenance, insurance, and public-charging cards into predictable monthly fees that simplify fleet budgeting. Government and municipal buyers, although only 4.2% of the 2025 base, accelerate policy signaling by mandating zero-emission purchases from 2025 onward in the United Kingdom and several Nordic countries.
SME fleets held a 29.4% share but face higher financing costs, an issue partly mitigated by a EUR 500 million green loan from the European Investment Bank, which offers 2.5% interest versus the 5-6% prevailing rate. Self-employed drivers accounted for 18.7% of demand and still favor used diesel vans, yet certified pre-owned electric programs from Mercedes-Benz and Renault are beginning to sway them with warranty coverage on battery health. Subscription models remain niche at fewer than 3,000 units, but flexible month-to-month contracts from Onto in the United Kingdom and Finn in Germany cater to gig-economy couriers who value low commitment. As corporate pioneers demonstrate lifetime cost savings and residual-value stability, the European light commercial vehicles market size attributable to SMEs and sole traders is expected to accelerate over the forecast period.
Geography Analysis
Germany maintained an 18.26% share of the European light commercial vehicles market in 2025, anchored by its role as the region’s largest manufacturing and logistics hub and by domestic production of the Volkswagen ID. Buzz Cargo and Mercedes-Benz eSprinter ensure a stable supply, while dense urban delivery demand sustains high replacement cycles across postal, retail, and municipal fleets.
Infrastructure readiness remains a decisive advantage. Germany hosts around 120,000 public charging points, including a fast-growing DC corridor along autobahns and freight routes. This reduces range anxiety for commercial operators and enables multi-shift utilization, a critical requirement for parcel and last-mile delivery fleets transitioning to battery-electric vans.
Policy support further reinforces market leadership. Federal environmental bonuses cut BEV van list prices by up to EUR 7,500, with several Länder layering additional regional incentives. Coupled with tightening enforcement of low-emission zones in major cities, these measures continue to accelerate fleet electrification and cement Germany’s position as the cornerstone of the European light commercial vehicle market.
Competitive Landscape
The European light commercial vehicles market is moderately concentrated: Stellantis, Ford, Renault, Mercedes-Benz, and Volkswagen controlled 68% of 2025 registrations. Stellantis shipped 180,000 electric vans on shared platforms spanning Peugeot, Citroën, Opel, Vauxhall, and Fiat Professional, cutting per-unit development costs by 22% through badge engineering. Ford’s E-Transit range held 14% of the electric segment, but faced stiff competition from Rivian’s EDV following Amazon’s 10,000-unit European order. Renault leverages alliance procurement to secure USD 95/kWh cells, enabling lease rates that undercut rivals by 8-10%.
Chinese brands Maxus (SAIC) and DFSK entered in 2025 with BEV vans priced 20-30% below incumbents, achieving a combined 2.8% share and sparking an EU anti-subsidy investigation. Modular skateboard suppliers enable body-swap cycles of six weeks versus legacy norms of 12 months, with Kögel and Schmitz Cargobull partnering on refrigerated bodies compatible with Stellantis chassis. Vehicle-to-grid pilots in the Netherlands.
demonstrated EUR 500-800 in annual grid-services revenue per van, a feature set to appear in 2026 model-year Ford and Mercedes vans via CCS 2.0 bidirectional-charging firmware updates. Volta Trucks' 2024 administration left white space in the 3.6-5.0 ton bracket, which Iveco and MAN aim to capture with extended-range BEV platforms launching in 2027.
Europe Light Commercial Vehicles Industry Leaders
-
Ford Motor Company
-
Volkswagen AG
-
Stellantis N.V.
-
Renault Group
-
Toyota Motor Corporation
- *Disclaimer: Major Players sorted in no particular order

Recent Industry Developments
- April 2025: Mercedes-Benz revealed plans to end production of its small van models (Citan and T-Class) by mid-2026, as part of a strategic shift toward larger, more profitable commercial vehicle segments.
- March 2025: Ford announced that it has begun volume production of new electric models for the European market, including the E-Transit Courier and E-Tourneo Courier, enhancing its Ford Pro lineup of electrified commercial vehicles.


Europe Light Commercial Vehicles Market Report Scope
Commercial Vehicles are covered as a segment under Vehicle Type. Hybrid and Electric Vehicles, ICE are covered as segments by Propulsion Type. Austria, Belgium, the Czech Republic, Denmark, Estonia, France, Germany, Ireland, Italy, Latvia, Lithuania, Norway, Poland, Russia, Spain, Sweden, the UK, and the rest of Europe are covered as segments by Country.
The Market Forecasts are Provided in Terms of Value (USD) and Volume (Units).
By Vehicle Type
| Light Commercial Vans |
| Light Pick-up Trucks (Less than 3.5 t GVW) |
| Chassis-Cab / Platform Cab |
| Mini-Trucks / Micro-LCVs |
| Minibuses (Less than 20 seats) |
By Gross Vehicle Weight (GVW) Class
| Less than 2.0 t |
| 2.1 to 2.5 t |
| 2.6 to 3.0 t |
| 3.1 to 3.5 t |
| 3.6 to 5.0 t |
By Propulsion Type
| BEV (Battery Electric Vehicle) |
| PHEV (Plug-in Hybrid Electric Vehicle) |
| HEV (Hybrid Electric Vehicle) |
| FCEV (Fuel Cell Electric Vehicle) |
| ICE (Internal Combustion Engine) |
By End-Use Industry
| Urban Last-Mile Delivery and Courier |
| Utilities and Field Services |
| Construction and Building Supplies |
| Postal and Parcel |
| Agriculture and Rural Services |
| Mobile Workshops and Special Purpose |
By Ownership/Fleet Type
| Corporate Fleets |
| SME Fleets |
| Self-Employed/Sole Proprietors |
| Rental and Leasing Companies |
| Government and Municipal Fleets |
By Country
| Austria |
| Belgium |
| Czech Republic |
| Denmark |
| Estonia |
| France |
| Germany |
| Ireland |
| Italy |
| Latvia |
| Lithuania |
| Norway |
| Poland |
| Russia |
| Spain |
| Sweden |
| United Kingdom |
| Rest of Europe |
| By Vehicle Type | Light Commercial Vans |
| Light Pick-up Trucks (Less than 3.5 t GVW) | |
| Chassis-Cab / Platform Cab | |
| Mini-Trucks / Micro-LCVs | |
| Minibuses (Less than 20 seats) | |
| By Gross Vehicle Weight (GVW) Class | Less than 2.0 t |
| 2.1 to 2.5 t | |
| 2.6 to 3.0 t | |
| 3.1 to 3.5 t | |
| 3.6 to 5.0 t | |
| By Propulsion Type | BEV (Battery Electric Vehicle) |
| PHEV (Plug-in Hybrid Electric Vehicle) | |
| HEV (Hybrid Electric Vehicle) | |
| FCEV (Fuel Cell Electric Vehicle) | |
| ICE (Internal Combustion Engine) | |
| By End-Use Industry | Urban Last-Mile Delivery and Courier |
| Utilities and Field Services | |
| Construction and Building Supplies | |
| Postal and Parcel | |
| Agriculture and Rural Services | |
| Mobile Workshops and Special Purpose | |
| By Ownership/Fleet Type | Corporate Fleets |
| SME Fleets | |
| Self-Employed/Sole Proprietors | |
| Rental and Leasing Companies | |
| Government and Municipal Fleets | |
| By Country | Austria |
| Belgium | |
| Czech Republic | |
| Denmark | |
| Estonia | |
| France | |
| Germany | |
| Ireland | |
| Italy | |
| Latvia | |
| Lithuania | |
| Norway | |
| Poland | |
| Russia | |
| Spain | |
| Sweden | |
| United Kingdom | |
| Rest of Europe |


Market Definition
- Vehicle Type - The category covers light commercial vehicle.
- Vehicle Body Type - This includes Light Commercial Pick-up Trucks and Light Commercial Vans.
- Fuel Category - The category includes various fuel types such as Gasoline, Diesel, LPG (Liquefied Petroleum Gas), CNG (Compressed Natural Gas), HEV (Hybrid Electric Vehicles), PHEV (Plug-in Hybrid Electric Vehicles), BEV (Battery Electric Vehicles), and FCEV (Fuel Cell Electric Vehicles)
| Keyword | Definition |
|---|---|
| Electric Vehicle (EV) | A vehicle which uses one or more electric motors for propulsion. Includes cars, buses, and trucks. This term includes all-electric vehicles or battery electric vehicles and plug-in hybrid electric vehicles. |
| BEV | A BEV relies completely on a battery and a motor for propulsion. The battery in the vehicle must be charged by plugging it into an outlet or public charging station. BEVs do not have an ICE and hence are pollution-free. They have a low cost of operation and reduced engine noise as compared to conventional fuel engines. However, they have a shorter range and higher prices than their equivalent gasoline models. |
| PEV | A plug-in electric vehicle is an electric vehicle that can be externally charged and generally includes all-electric vehicles as well as plug-in hybrids. |
| Plug-in Hybrid EV | A vehicle that can be powered either by an ICE or an electric motor. In contrast to normal hybrid EVs, they can be charged externally. |
| Internal combustion engine | An engine in which the burning of fuels occurs in a confined space called a combustion chamber. Usually run with gasoline/petrol or diesel. |
| Hybrid EV | A vehicle powered by an ICE in combination with one or more electric motors that use energy stored in batteries. These are continually recharged with power from the ICE and regenerative braking. |
| Commercial Vehicles | Commercial vehicles are motorized road vehicles designed for transporting people or goods. The category includes light commercial vehicles (LCVs) and medium and heavy-duty vehicles (M&HCV). |
| Passenger Vehicles | Passenger cars are electric motor– or engine-driven vehicles with at least four wheels. These vehicles are used for the transport of passengers and comprise no more than eight seats in addition to the driver’s seat. |
| Light Commercial Vehicles | Commercial vehicles that weigh less than 6,000 lb (Class 1) and in the range of 6,001–10,000 lb (Class 2) are covered under this category. |
| M&HDT | Commercial vehicles that weigh in the range of 10,001–14,000 lb (Class 3), 14,001–16,000 lb (Class 4), 16,001–19,500 lb (Class 5), 19,501–26,000 lb (Class 6), 26,001–33,000 lb (Class 7) and above 33,001 lb (Class 8) are covered under this category. |
| Bus | A mode of transportation that typically refers to a large vehicle designed to carry passengers over long distances. This includes transit bus, school bus, shuttle bus, and trolleybuses. |
| Diesel | It includes vehicles that use diesel as their primary fuel. A diesel engine vehicle have a compression-ignited injection system rather than the spark-ignited system used by most gasoline vehicles. In such vehicles, fuel is injected into the combustion chamber and ignited by the high temperature achieved when gas is greatly compressed. |
| Gasoline | It includes vehicles that use gas/petrol as their primary fuel. A gasoline car typically uses a spark-ignited internal combustion engine. In such vehicles, fuel is injected into either the intake manifold or the combustion chamber, where it is combined with air, and the air/fuel mixture is ignited by the spark from a spark plug. |
| LPG | It includes vehicles that use LPG as their primary fuel. Both dedicated and bi-fuel LPG vehicles are considered under the scope of the study. |
| CNG | It includes vehicles that use CNG as their primary fuel. These are vehicles that operate like gasoline-powered vehicles with spark-ignited internal combustion engines. |
| HEV | All the electric vehicles that use batteries and an internal combustion engine (ICE) as their primary source for propulsion are considered under this category. HEVs generally use a diesel-electric powertrain and are also known as hybrid diesel-electric vehicles. An HEV converts the vehicle momentum (kinetic energy) into electricity that recharges the battery when the vehicle slows down or stops. The battery of HEV cannot be charged using plug-in devices. |
| PHEV | PHEVs are powered by a battery as well as an ICE. The battery can be charged through either regenerative breaking using the ICE or by plugging into some external charging source. PHEVs have a better range than BEVs but are comparatively less eco-friendly. |
| Hatchback | These are compact-sized cars with a hatch-type door provided at the rear end. |
| Sedan | These are usually two- or four-door passenger cars, with a separate area provided at the rear end for luggage. |
| SUV | Popularly known as SUVs, these cars come with four-wheel drive, and usually have high ground clearance. These cars can also be used as off-road vehicles. |
| MPV | These are multi-purpose vehicles (also called minivans) designed to carry a larger number of passengers. They carry between five and seven people and have room for luggage too. They are usually taller than the average family saloon car, to provide greater headroom and ease of access, and they are usually front-wheel drive. |


Research Methodology
Mordor Intelligence follows a four-step methodology in all its reports.
- Step-1: Identify Key Variables: To build a robust forecasting methodology, the variables and factors identified in Step-1 are tested against available historical market numbers. Through an iterative process, the variables required for market forecast are set and the model is built based on these variables.
- Step-2: Build a Market Model: Market-size estimations for the historical and forecast years have been provided in revenue and volume terms. Market revenue is calculated by multiplying the sales volume with their respective average selling price (ASP). While estimating ASP factors like average inflation, market demand shift, manufacturing cost, technological advancement, and varying consumer preference, among others have been taken into account.
- Step-3: Validate and Finalize: In this important step, all market numbers, variables, and analyst calls are validated through an extensive network of primary research experts from the market studied. The respondents are selected across levels and functions to generate a holistic picture of the market studied.
- Step-4: Research Outputs: Syndicated Reports, Custom Consulting Assignments, Databases & Subscription Platforms.


