Direct Attach Cables Market Size and Share
Market Overview
| Study Period | 2020 - 2031 |
|---|---|
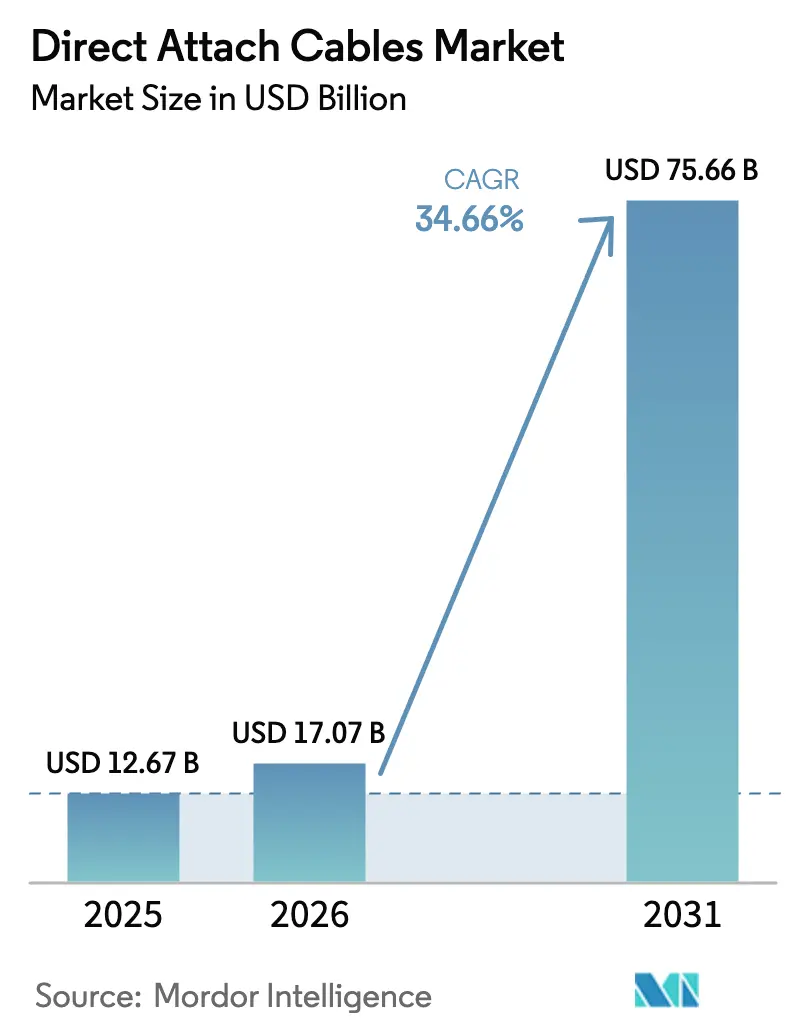
| Market Size (2026) | USD 17.07 Billion |
| Market Size (2031) | USD 75.66 Billion |
| Growth Rate (2026 - 2031) | 34.66% CAGR |
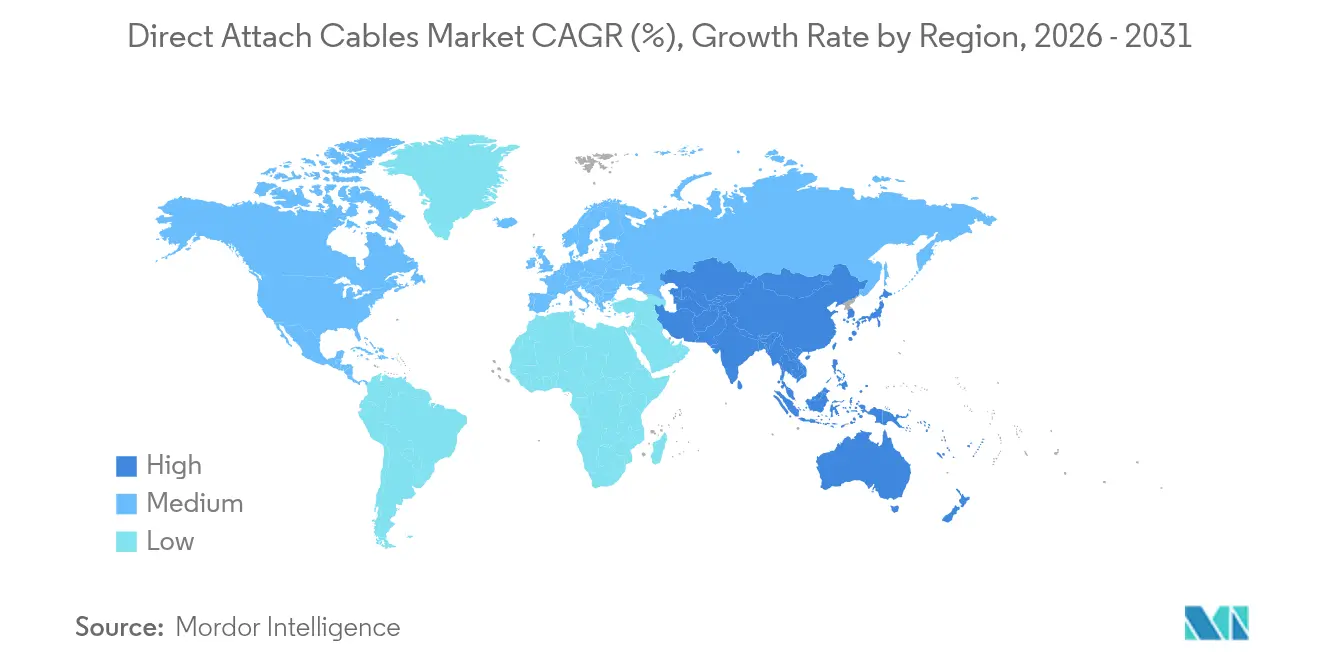
| Fastest Growing Market | Asia Pacific |
| Largest Market | North America |
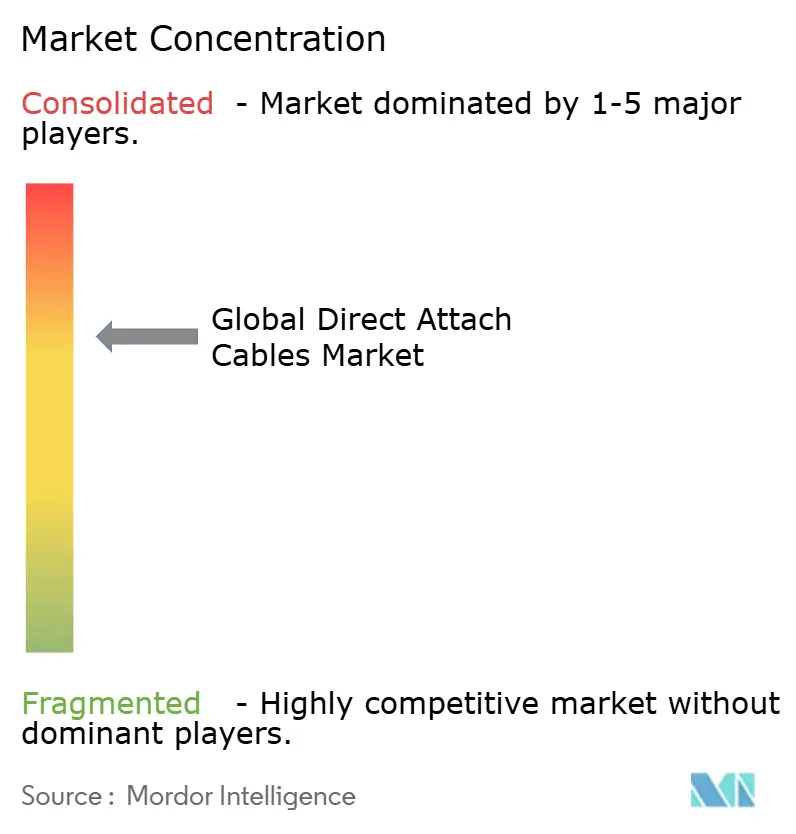
| Market Concentration | Medium |
Major Players
*Disclaimer: Major Players sorted in no particular order Image © Mordor Intelligence. Reuse requires attribution under CC BY 4.0. |
|
Direct Attach Cables Market Analysis by Mordor Intelligence
The Global Direct Attach Cables market size is expected to grow from USD 12.67 billion in 2025 to USD 17.07 billion in 2026 and is forecast to reach USD 75.66 billion by 2031 at 34.66% CAGR over 2026-2031.
Momentum reflects data-center rack densities shifting from 8–10 kW toward 15–20 kW, while AI clusters already top 100 kW per rack, forcing operators to favor power-efficient copper interconnects. Data-center owners view passive copper as the lowest-latency option for sub-7 m links, avoiding the 2–5 W per port penalty of optical transceivers. Form-factor migration toward QSFP-DD and OSFP supports 400 GbE and 800 GbE switches, accelerating high-speed cable pull-through. Asia Pacific emerges as the fastest-growing buyer base, backed by China’s hyperscale build-outs and Japan’s 5G rollouts, while the CHIPS Act’s 25% credit encourages U.S. reshoring of cable assembly. Copper cost volatility and falling optical module prices temper near-term enthusiasm, yet integrated digital-signal-processing (DSP) in Active DACs extends reach and sustains performance at more than 100 Gbps.
Key Report Takeaways
- By application, data centers held 70.90% of the Direct Attach Cables market share in 2025, whereas edge data centers are projected to expand at a 36.90% CAGR through 2031.
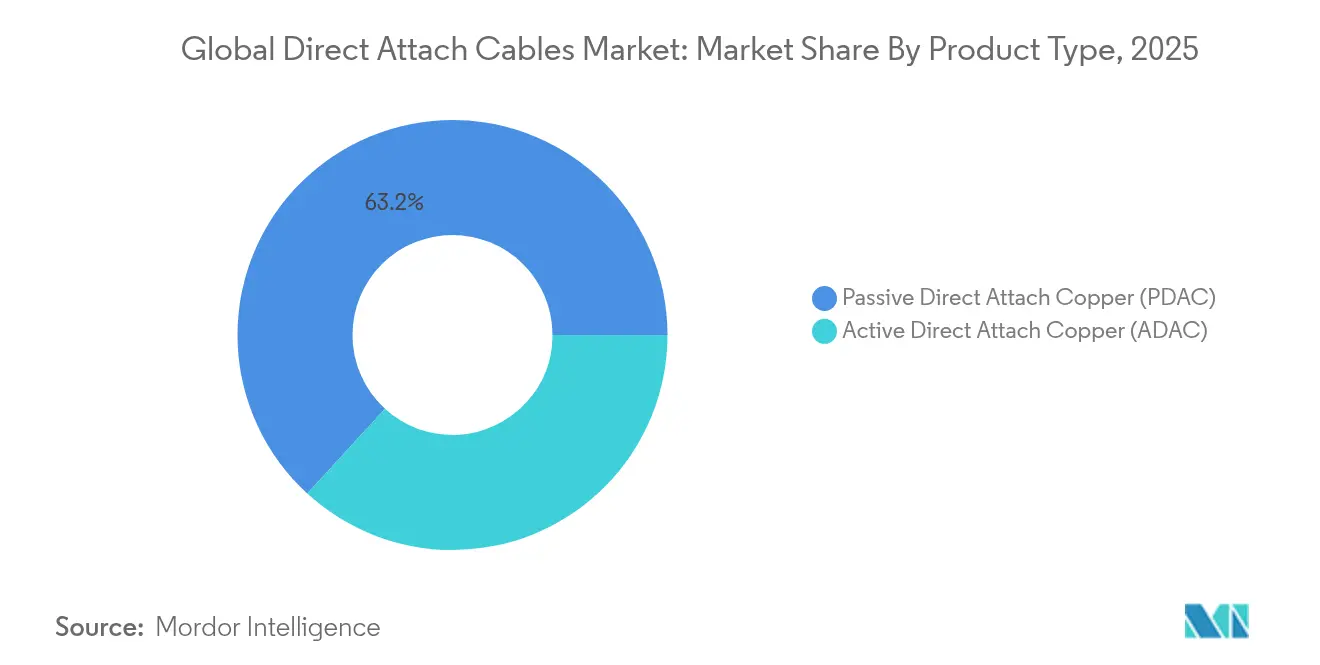
- By product type, passive copper captured 63.20% of the Direct Attach Cables market size in 2025, while active solutions recorded the fastest 39.15% CAGR to 2031.
- By form factor, QSFP28 led with 37.30% revenue share in 2025; QSFP-DD is advancing at a 35.62% CAGR through 2031.
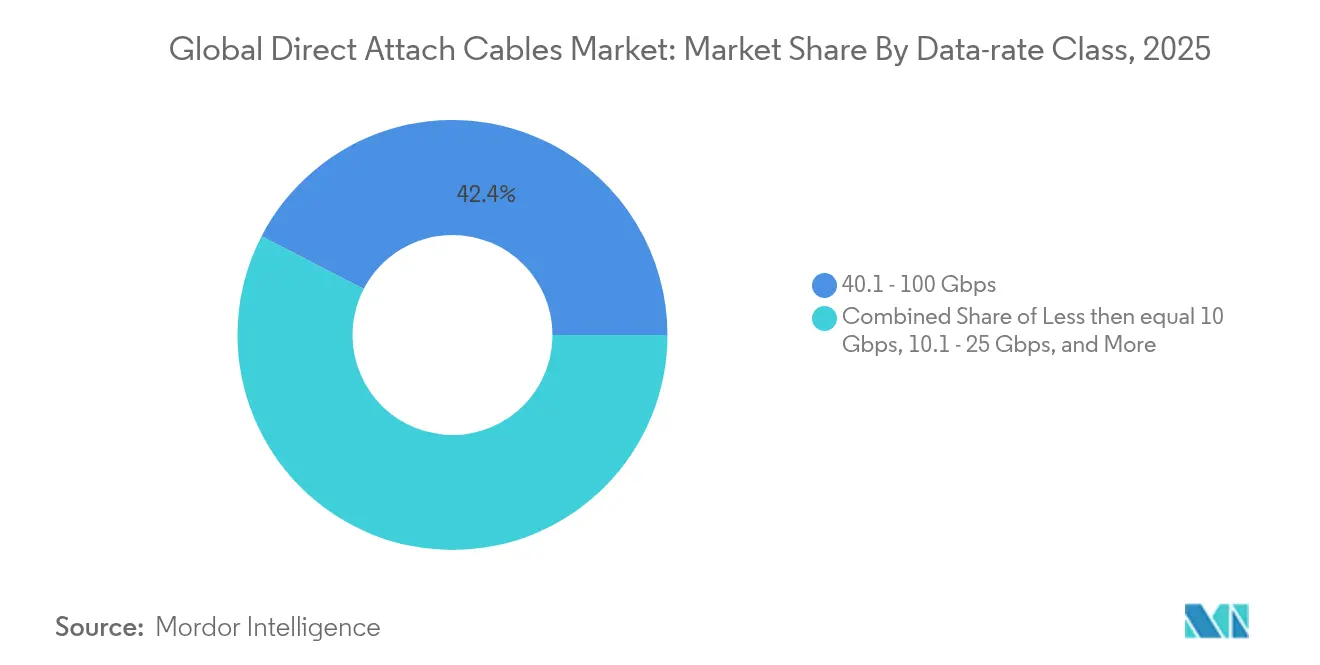
- By data-rate class, 40.1–100 Gbps commanded 42.40% of the Direct Attach Cables market size in 2025, and the more than 100 Gbps tier is projected to grow 34.90% annually to 2031.
- By region, North America contributed 37.80% revenue in 2025, while Asia Pacific is forecast to post the highest 34.95% CAGR through 2031.
Note: Market size and forecast figures in this report are generated using Mordor Intelligence’s proprietary estimation framework, updated with the latest available data and insights as of 2026.
Global Direct Attach Cables Market Trends and Insights
Drivers Impact Analysis*
| Driver | % Impact on CAGR Forecast | Geographic Relevance | Impact Timeline |
|---|---|---|---|
| Cloud-scale data-center buildouts in hyperscaler & colocation segments | 8.50% | Global, concentrated in North America & APAC | Medium term (2-4 years) |
| Rapid 400 GbE/800 GbE switch upgrades accelerating high-speed DAC pull-through | 7.20% | North America & EU, expanding to APAC | Short term (≤ 2 years) |
| Telco 5G RU-to-DU fronthaul preferring cost-optimized 25 Gbps DAC links | 6.80% | APAC core, spill-over to MEA | Medium term (2-4 years) |
| Edge AI clusters (LLM inferencing) demanding low-latency copper interconnect | 9.10% | Global, early adoption in North America | Short term (≤ 2 years) |
| Source: Mordor Intelligence | |||
Cloud-scale data-center buildouts in the hyperscaler and colocation segments
Hyperscalers now specify copper cabling for intra-rack and short-reach inter-rack runs where deterministic sub-microsecond latency is critical. A single Microsoft facility consumes more than 2,100 tons of copper, and projected demand will multiply as AI inference becomes pervasive. Colocation operators follow a similar path because copper removes optical transceiver overhead, typically 2–5 W per port, resulting in direct energy savings. Pre-connectorized assemblies cut installation time by up to 80%, shrinking deployment windows for new capacity. Together, these factors lift the Direct Attach Cables market by ensuring copper remains the short-reach default even as fiber takes over building-to-building links.
Rapid 400 GbE/800 GbE switch upgrades accelerating high-speed DAC pull-through
AI training clusters rely on wide, non-blocking fabrics that push every switch port to 400 GbE and 800 GbE. The Ethernet Technology Consortium ratified an 800 GbE spec that multiplexes eight 106-Gb/s lanes, forcing cable makers to invest in low-skew twin-ax designs. Arista reported USD 7 billion FY 2024 revenue, citing AI networking as the dominant growth vector. NVIDIA projects its Spectrum-X switches will ship in 2026, but they will coexist with copper for sub-10 m links where power loss from optics still matters. These upgrades form a demand pipeline for 400 G and 800 G DAC products that lifts the Direct Attach Cables market over the forecast horizon.
Telco 5G RU-to-DU fronthaul preferring cost-optimized 25 Gbps copper links
Centralised RAN architectures require deterministic RU-to-DU latency. CPRI guidelines limit fronthaul link budgets, making passive copper viable up to 30 m. Ericsson’s Fronthaul 6000 platform accepts 25 G copper interfaces, helping mobile operators avoid fibre buildouts in congested streets[1]Ericsson AB, “Fronthaul 6000 Product Sheet,” ericsson.com. Dense urban 5G networks of 300+ small cells/km², therefore, become a sizeable addressable pool for cost-effective DAC assemblies.
Edge AI clusters (LLM inferencing) demanding low-latency copper interconnect
Inference workloads at metro-edge sites prize sub-microsecond latency. Leviton notes a 30% CAGR in AI-driven transceiver demand but concedes copper keeps an advantage in tight power budgets. Marvell’s Active Electrical Cable integrates DSP to push copper reach beyond 5 m at 112 Gb/s per lane[2]Marvell Technology, “Active Electrical Cable White Paper,” marvell.comMarvell Technology, “Active Electrical Cable White Paper,” marvell.com. TE Connectivity expects 224 Gb/s links within a few years, sustaining copper relevance for edge deployments[3]TE Connectivity, “224 Gb/s Interconnect Roadmap,” te.com.
Restraints Impact Analysis*
| Restraint | % Impact on CAGR Forecast | Geographic Relevance | Impact Timeline |
|---|---|---|---|
| Looming server rack power limits (<25 kW) constrain thick-gauge DAC adoption | -4.20% | Global, acute in legacy data centers | Short term (≤ 2 years) |
| QSFP-DD800 optical module ASPs falling faster than copper, shrinking TCO gap | -3.80% | North America & EU, spreading globally | Medium term (2-4 years) |
| Source: Mordor Intelligence | |||
Looming server-rack power limits (Less than 25 kW) constrain thick-gauge DAC adoption
Legacy data-center electrical systems cap at 25 kW per rack, limiting the space and thermal headroom for large-diameter copper. Operators retrofitting from 208 V to 400 V distribution reduce losses, but remain cautious about extra cable mass that complicates airflow. Active Electrical Cable solves part of this issue with embedded equalizers, though the cost rises accordingly, dampening near-term unit growth in the Direct Attach Cables market.
QSFP-DD800 optical module ASPs falling faster than copper, shrinking the TCO gap
Silicon photonics integration slashes optical component costs, and hyperscale volume contracts accelerate the decline. NVIDIA’s roadmap targets 3.5× power efficiency versus conventional optics, which will erode copper’s energy edge over the long term. Copper also faces raw-material inflation: LME cash prices surpassed USD 5.20/lb in 2024, adding 25–35% to assembly costs. The cumulative effect narrows copper’s cost lead in some edge-reach scenarios.
*Our forecasts treat driver/restraint impacts as directional, not additive. The impact forecasts reflect baseline growth, mix effects, and variable interactions.
Segment Analysis
By Product Type: Active DACs Extend Reach While Passive Units Dominate
Passive assemblies accounted for 63.20% of 2025 revenue, confirming their status as the volume workhorse for less than 7 m links inside racks where signal integrity remains within IEEE specifications. In this bracket, the Direct Attach Cables market size for passive units equaled USD 8.01 billion in 2025. Hyperscalers favor them because the elimination of DSP lowers failure points and reduces per-port power draw by 1–2 W.
Active designs post the highest 39.15% CAGR, leveraging integrated DSP to compensate for skin-effect attenuation at 25 Gb/s and above. Marvell’s AEC proof-points demonstrate 1.6 T PAM4 throughput over 5 m twin-ax, extending copper to small-pod interconnects. The Direct Attach Cables market share for active variants is expected to grow from 36.80% in 2025 to nearly 54.20% by 2031 as AI clusters demand deterministic latency beyond the rack.


By Form Factor: QSFP-DD Emergence Challenges QSFP28 Leadership
QSFP28 held 37.30% shipment share during 2025, riding the entrenched 100 GbE installed base. Operators appreciate backward compatibility and abundant supplier choice, retaining volume even as newer speeds arise.
QSFP-DD grows 35.62% annually on the back of 400 GbE and 800 GbE switch deployment. NVIDIA’s GB300 NVL72 system illustrates density benefits: 72 OSFP ports handle backend fabric while thousands of QSFP-DD cables support server NIC connections. As the Direct Attach Cables market shifts to 800 Gbps ports, QSFP-DD is positioned to eclipse QSFP28 revenue by 2027.
By Data-rate Class: More than 100 Gbps Tier Surges Yet 40–100 Gbps Reigns
The 40.1–100 Gbps band controlled 42.40% of 2025 revenue by balancing affordability with broad ecosystem validation. Operators adopt 2×100 GbE leaf-switch designs to aggregate GPU clusters efficiently, protecting this tier’s volume through 2027.
Demand for more than 100 Gbps cables accelerates at 34.90% CAGR. Ethernet 800 G specifications demonstrate viability for eight-lane copper up to 3 m. Early shipments target 600 W rack-scale AI systems that require seven-nines link reliability for tensor-parallel training.
By Application Area: Edge Sites Lead Growth as Data Centers Keep Scale
Data centers claimed 70.90% of 2025 spending, reflecting hyperscale procurement cycles aligning with accelerated AI server rollouts. Their share stays above 60% through 2031 due to sustained GPU cluster expansion.
Edge sites defined as facilities under 200 kW benefit from 5G coverage obligations and low-latency services such as fraud detection or AR streaming. The Direct Attach Cables market size for edge deployments grows from USD 1.11 billion in 2026 to more than USD 5.33 billion by 2031, translating into the fastest 36.90% CAGR. Copper underpins these sites because passive DACs simplify field replacement and reduce truck rolls.
Geography Analysis
North America represented 37.80% of 2025 revenue, anchored by hyperscaler expansion plans. The CHIPS and Science Act now provides a 25% investment credit for domestic cable assembly lines, encouraging local production. Amphenol’s Q1 2025 sales of USD 4.8 billion underscore the region’s datacom momentum. Cloud operators fast-track 800 GbE fabrics, ensuring steady DAC pull-through for the next deployment wave.
Asia Pacific is the fastest-growing geography at 34.95% CAGR through 2031. China alone approved more than 220 national data-center projects in 2024, each designed for more than 50 MW IT load. Japan’s 5G densification adds demand for 25 Gbps fronthaul DACs, especially in urban micro-cells where fiber civil works would be cost-prohibitive. Local cable plants leverage labor and component agility to serve both domestic hyperscalers and U.S. customers sourcing value-range SKUs.
Europe shows steady mid-teens growth, tempered by stricter RoHS recasts that tighten lead exemptions in copper assemblies. Compliance costs add 1–2% to the bill-of-materials, but operators offset via energy savings from passive cable choice. The region’s colocation footprint grows as U.S. content providers localize data to meet GDPR directives, ensuring a durable albeit slower expansion path for the Direct Attach Cables market.

Competitive Landscape
The market shows moderate concentration. Amphenol, Molex, TE Connectivity, and Luxshare control a collective 58% of global revenue, enabling volume procurement of copper and DSP components. Amphenol’s USD 15.2 billion FY 2024 revenue demonstrates a scale advantage and cross-segment exposure.
Tier-2 specialists target high-speed niches: Molex samples 224 Gb/s internal cabled-backplane prototypes for 51.2 Tb switch chassis. Quanta develops purpose-built 800 GbE DAC harnesses bundled with its OCP-approved servers, embedding interconnect sales in wider system contracts.
Technology roadmaps converge on Active Electrical Cable with integrated DSP, enabling 5 m reach at 112 Gb/s PAM4. Early deployments earn price premiums exceeding 40% over passive SKUs, providing margin ballast against copper price swings. Vendors also develop co-packaged optics (CPO) but position them for more than 20 m links, preserving copper primacy under the rack.
Direct Attach Cables Industry Leaders
-
ACT Cables
-
Volex plc
-
IOI Technology
-
NVIDIA (Mellanox)
-
JPC Connectivity
- *Disclaimer: Major Players sorted in no particular order

Recent Industry Developments
- March 2025: NVIDIA released Blackwell Ultra AI platform, integrating 400 GbE NICs and thousands of copper links for internal fabric.
- March 2025: NVIDIA introduced Spectrum-X photonics switches that promise 3.5× power efficiency; copper remains for sub-rack spans until CPO matures.
- October 2024: U.S. Treasury finalized CHIPS ITC rules granting 25% credit for advanced interconnect manufacturing investments.
- October 2024: NVIDIA published a comprehensive DAC design guide for AI factories, covering InfiniBand and Ethernet layouts.


Research Methodology Framework and Report Scope
Market Definitions and Key Coverage
Our study defines the direct attach cable (DAC) market as prefabricated copper twinax assemblies with integrated transceivers that plug straight into switches, routers, servers, and storage for high-speed links of roughly five meters. According to Mordor Intelligence, both passive and active copper variants that carry 10 Gbps through 400 Gbps Ethernet or InfiniBand traffic are included.
Scope Exclusions. We exclude fiber-based active optical cables and all generic structured cabling products.
Segmentation Overview
-
By Product Type
- Passive Direct Attach Copper (PDAC)
- Active Direct Attach Copper (ADAC)
-
By Form Factor
- SFP/SFP+
- SFP28
- QSFP+
- QSFP28
- QSFP-DD/QSFP112
- Others
-
By Data-rate Class
- Less then equal 10 Gbps
- 10.1 - 25 Gbps
- 25.1 - 40 Gbps
- 40.1 - 100 Gbps
- More than 100 Gbps
-
By Application Area
- Data Center
- Telecommunication
- High-Performance Computing
- Consumer Electronics
- Industrial
- Others
-
By Geography
-
North America
- United States
- Canada
- Mexico
- South America
-
Europe
- Germany
- United Kingdom
- France
-
Asia-Pacific
- China
- India
- Japan
- South Korea
- ASEAN
- Rest of Asia-Pacific
-
Middle East
- Saudi Arabia
- UAE
- Turkey
- Rest of Middle East
-
Africa
- South Africa
- Rest of Africa
-
North America
Detailed Research Methodology and Data Validation
Primary Research
Mordor analysts speak with DAC design engineers, procurement heads at hyperscale and edge data centers, regional distributors, and network architects across North America, Europe, and Asia. The discussions confirm typical cable mixes, average selling prices, and refresh cycles that secondary data alone cannot reveal.
Desk Research
We start with open data such as IEEE 802.3 working-group releases, ITU-T interface updates, Uptime Institute's data-center census, United States International Trade Commission shipment records, and European Network Operators statistics, complemented by company filings on EDGAR. D&B Hoovers, Dow Jones Factiva, and Questel give us revenue, news, and patent clues that refine supplier shares and technology shifts. These examples illustrate the range of sources; many other documents were also consulted for data collection, validation, and clarification.
Market-Sizing & Forecasting
We rebuild demand top-down from active server-switch port counts, subdivided by speed tier and typical cable length, before corroborating totals with sampled supplier revenue roll-ups. Key variables like including rack density, 100 G / 400 G penetration, copper price index, cloud capex plans, and regional floor space feed a multivariate regression that produces our 2025-2030 view. Select bottom-up checks on QSFP-DD cable price × volume fine-tune the model prior to sign-off.
Data Validation & Update Cycle
Every run is put through variance screens, multi-analyst review, and, when needed, fresh callbacks. We refresh models once a year and issue interim updates after material events so clients receive the latest baseline.
Why Mordor's Direct Attach Cable Baseline Commands Reliability
We see published figures often diverge because firms differ on cable types counted, projection horizons, and update frequency.
Key gap drivers include whether active optical cables are blended, how fast 400 G ramps are modeled, currency-conversion timing, and whether vendor revenues or installed ports anchor the model. This is where Mordor Intelligence differentiates through disciplined scope choices, yearly refreshes, and dual-lens validation.
Benchmark comparison
| Market Size | Anonymized source | Primary gap driver |
|---|---|---|
| USD 12.67 bn (2025) | Mordor Intelligence | |
| USD 9.47 bn (2024) | Global Consultancy A | Excludes >100 Gbps and edge-data-center demand |
| USD 13.21 bn (2024) | Trade Journal B | Relies on shipment extrapolation with limited primary checks |
| USD 9.32 bn (2023) | Industry Association C | Older base year, infrequent refresh, aggressive price erosion path |
These contrasts show our estimate sits between optimistic and conservative ends, giving decision-makers a balanced, transparent starting point that is traceable to clear variables and repeatable steps.


Key Questions Answered in the Report
What is the current size of the Direct Attach Cables market?
The Direct Attach Cables market stands at USD 17.07 billion in 2026.
How fast is the Direct Attach Cables market expected to grow?
Industry revenue is projected to rise at a 34.66% CAGR, reaching USD 75.66 billion by 2031.
Which application represents the largest opportunity?
Large data centers account for 70.90% of 2025 revenue, driven by AI cluster deployment.
Why are Active DACs gaining attention?
Active DACs integrate DSP to extend reach at 112 Gb/s per lane, growing 39.15% annually through 2031.
Which region will expand the fastest?
Asia Pacific is forecast to grow at 34.95% CAGR thanks to hyperscale construction in China and Japan’s 5G rollout.
Are falling optical prices a major threat to copper cables?
Lower 800 G optical ASPs compress copper’s cost gap, but sub-10 m links still favor passive DACs on latency and power grounds.
Page last updated on:


