Active Copper Cables (ACC) Market Size and Share
Market Overview
| Study Period | 2020 - 2031 |
|---|---|
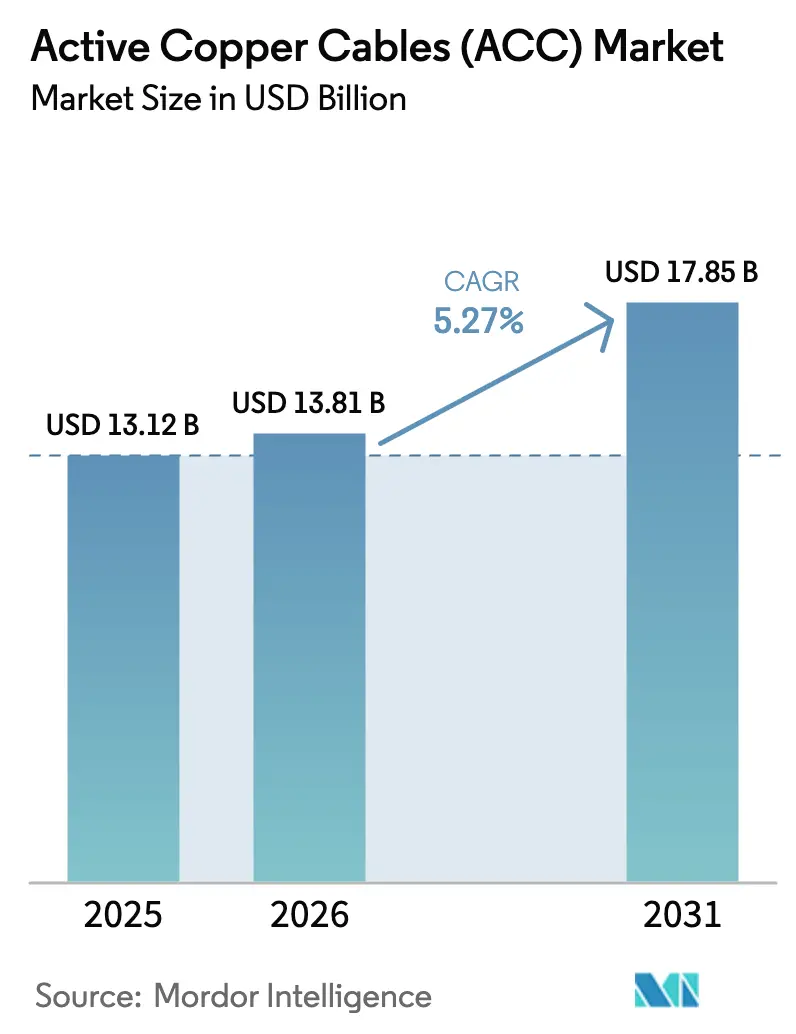
| Market Size (2026) | USD 13.81 Billion |
| Market Size (2031) | USD 17.85 Billion |
| Growth Rate (2026 - 2031) | 5.27% CAGR |
| Fastest Growing Market | Asia Pacific |
| Largest Market | North America |
| Market Concentration | Medium |
Major Players *Disclaimer: Major Players sorted in no particular order Image © Mordor Intelligence. Reuse requires attribution under CC BY 4.0. | |
Active Copper Cables (ACC) Market Analysis by Mordor Intelligence
The active copper cables market size was valued at USD 13.12 billion in 2025 and estimated to grow from USD 13.81 billion in 2026 to reach USD 17.85 billion by 2031, at a CAGR of 5.27% during the forecast period (2026-2031). Accelerated hyperscale data-center expansion, AI-optimized server architecture, and the sector’s cost-per-port advantage in short-reach links underpin this steady rise. Copper continues to win inside the rack where its low latency offsets optical reach benefits, while new PCIe 5.0/6.0 and CXL use-cases extend demand beyond traditional networking. Commodity headwinds such as the 2024 copper price spike above USD 5 per pound prompt closer vertical integration, yet sustained investment by cloud providers keeps channel volumes high. Adoption of higher-density form factors such as OSFP-XD, plus the move from 100 G to 800 G ports, amplify requirements for miniaturized 28 AWG and finer gauges, creating design challenges that favor incumbents with advanced signal-conditioning expertise.
Key Report Takeaways
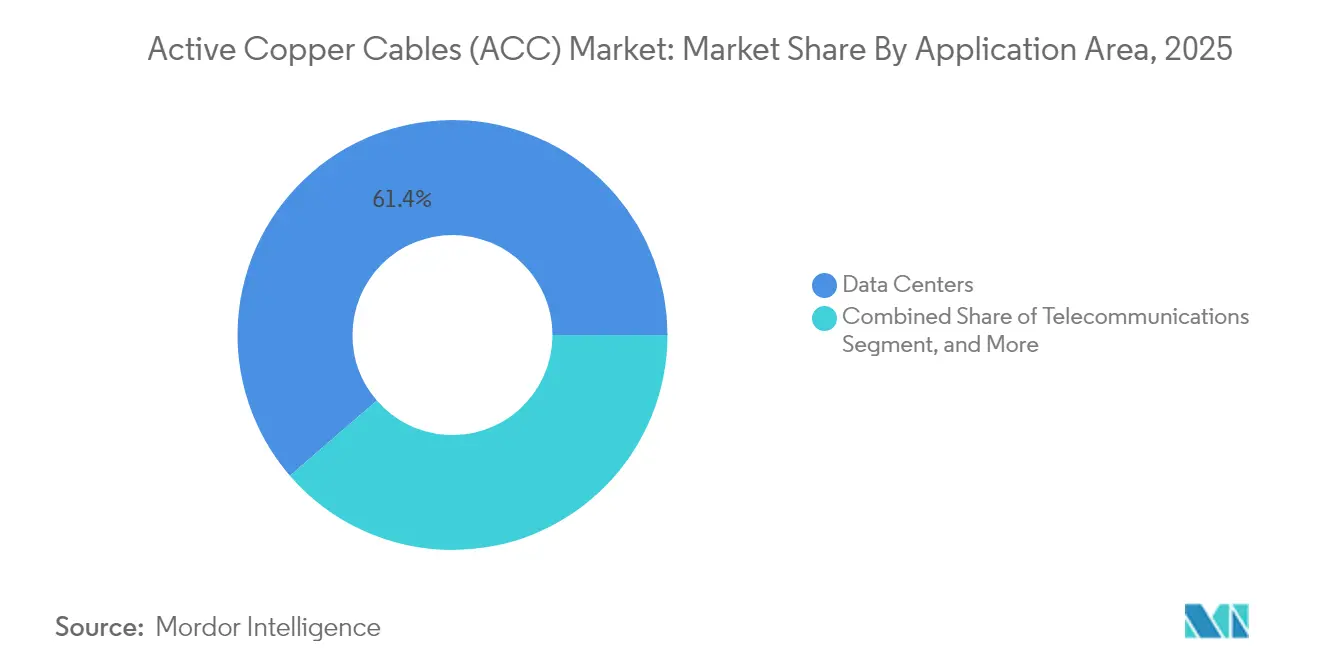
- By application, data centers led with 61.35% of active copper cables market share in 2025 and are expanding at a 5.41% CAGR to 2031.
- By form factor, QSFP+/QSFP28 held 46.30% revenue share in 2025, whereas OSFP/OSFP-XD is forecast to grow at 6.12% CAGR through 2031.
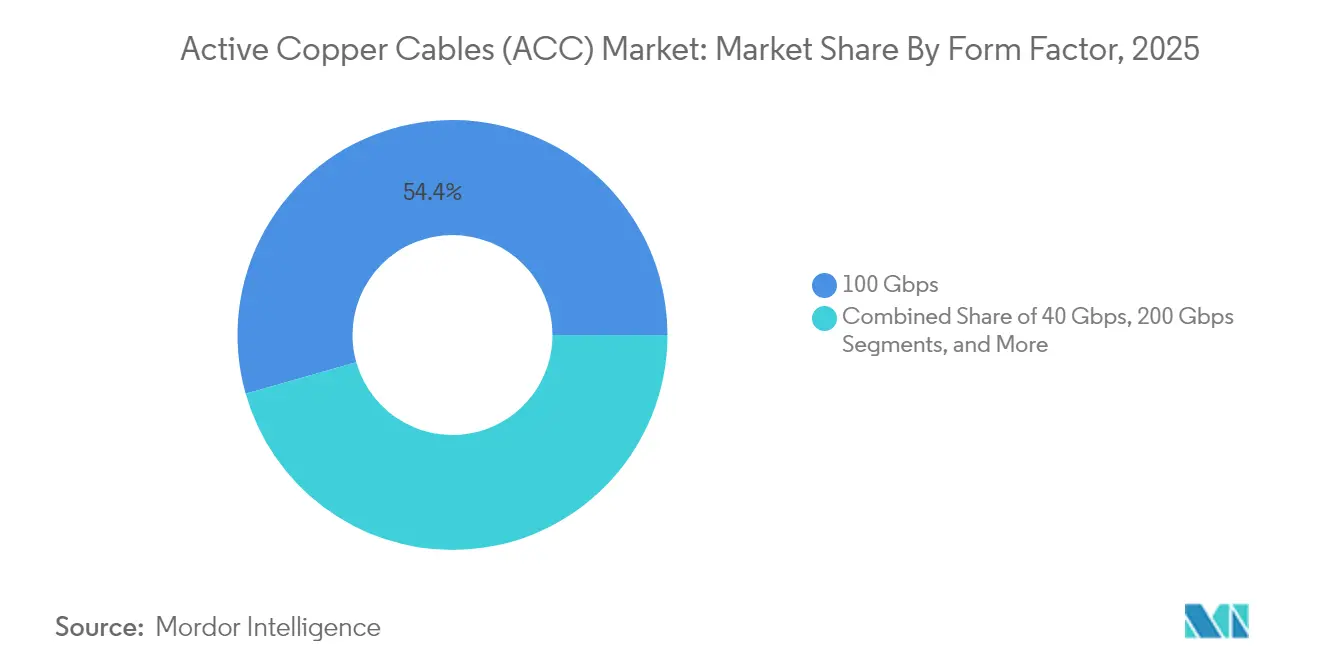
- By data-rate, 100 Gbps connections accounted for 54.40% share of the active copper cables market size in 2025, while 800 Gbps links record the fastest 5.82% CAGR to 2031.
- By conductor gauge, 28 AWG dominated with 59.25% market share in 2025; 32 AWG and finer grades are set to advance at a 6.94% CAGR.
- By geography, North America commanded 37.55% of the active copper cables market size in 2025, whereas Asia-Pacific posts the highest 6.32% CAGR through 2031.
Note: Market size and forecast figures in this report are generated using Mordor Intelligence’s proprietary estimation framework, updated with the latest available data and insights as of 2026.
Global Active Copper Cables (ACC) Market Trends and Insights
Drivers Impact Analysis*
| Driver | (~) % Impact on CAGR Forecast | Geographic Relevance | Impact Timeline |
|---|---|---|---|
| Surging hyperscale and colocation data-center buildouts | +1.8% | Global, concentrated in North America and Asia-Pacific | Medium term (2–4 years) |
| Accelerating server-to-switch link speeds (100G → 400G) | +1.2% | Global, led by North American hyperscalers | Short term (≤ 2 years) |
| AI/ML GPU clusters demanding ultra-low-latency short-reach links | +1.5% | North America and Europe, expanding to Asia-Pacific | Medium term (2–4 years) |
| Transition to PCIe 5.0/6.0 and CXL inside servers | +0.7% | Global, early enterprise adoption | Long term (≥ 4 years) |
| Growth of open compute and ORv3 architectures standardizing 800G AECs | +0.3% | North America hyperscalers, Asia-Pacific followers | Long term (≥ 4 years) |
| Source: Mordor Intelligence | |||
Surging Hyperscale and Colocation Data-Center Buildouts
- New hyperscale campuses routinely exceed 200 MW, and multi-gigawatt masterplans in Virginia, Johor Bahru, and Texas exemplify an investment wave that lifts the active copper cables market. Each rack in these facilities integrates dozens of short-reach interconnects, making the copper bill of materials a line-item that scales linearly with deployed IT power. Geographic diversification into Malaysia, India, and other emerging hubs replicates that demand across regions at once, allowing standardized copper assemblies to achieve higher production volumes. Combined, the medium-term outlook shows data-center expansion adding more than 1.5 GW annually in Asia-Pacific alone, translating into sustained double-digit volume growth for short-link copper products.
Accelerating Server-to-Switch Link Speeds (100G → 400G)
Hyperscalers are leapfrogging 200 G and moving directly to 400 G or 800 G server ports. IEEE 802.3df ratification in 2024 legitimized electrical specifications up to 800 Gbps for ≤ 7 m reaches, a range that squarely favors active copper cables over mid-row optics.[1]IEEE Standards Association, “IEEE 802.3df-2024 Standard for Ethernet,” ieee.org Switch vendors already showcase 144-port 800 G blades, so leaf-tier architectures feature thousands of short runs demanding low-latency connectivity.[2]NVIDIA Corporation, “Quantum-X800 Networking Platform,” nvidia.com With optical module pricing still at a premium per port, the capital-efficiency argument keeps copper preferred inside and between adjacent racks, reinforcing demand during this rapid speed transition.
AI/ML GPU Clusters Demanding Ultra-Low-Latency Short-Reach Links
Large GPU enclosures draw up to 11 kW per card and require 8×200G or greater host connectivity, which magnifies the need for dense, thermally efficient cables. Active copper solutions contribute latency under 5 ns because they avoid electro-optical conversion, an edge that preserves training accuracy and job completion times in AI workloads. Suppliers such as TE Connectivity now sample 224 Gbps PAM4 cables designed for 85 °C environments, matching the rising exhaust temperatures inside liquid-cooled racks. These purpose-built assemblies strengthen the active copper cables market as AI clusters proliferate across new enterprise and cloud sites.
Transition to PCIe 5.0/6.0 and CXL Inside Servers
PCI-SIG finalised CopprLink for PCIe 6.0, supporting 64 GT/s over up to 4 m active cables. OEMs can architect disaggregated memory pools and external accelerators without sacrificing bandwidth or latency. This shift lifts unit volumes beyond traditional NIC–to-switch hops into backplane, chassis, and server-to-server pathways. Because these links sit inside racks, copper’s reach cap is irrelevant, while its BOM savings versus optical lead to broader adoption across mainstream x86 platforms during the forecast horizon.
Restraints Impact Analysis*
| Restraint | (~) % Impact on CAGR Forecast | Geographic Relevance | Impact Timeline |
|---|---|---|---|
| Reach limitations beyond 5–7 m compared with AOCs | -0.8% | Global, pronounced in large-scale deployments | Short term (≤ 2 years) |
| Rising copper prices and supply-chain volatility | -0.6% | Global, acute in manufacturing hubs | Medium term (2–4 years) |
| Thermal-budget challenges at 224 Gbps PAM4 lanes | -0.4% | Advanced markets with early 224G adoption | Long term (≥ 4 years) |
| Fragmented interoperability for new form factors | -0.3% | Global, early adopter segments | Medium term (2–4 years) |
| Source: Mordor Intelligence | |||
Reach Limitations Beyond 5–7 m Compared with AOCs
Electrical attenuation and electromagnetic interference degrade PAM4 signals beyond the 7 m ceiling that now frames most active copper deployments in modern data halls. Middle-of-row topologies mandating 15 m or longer links default to active optical cables, eroding copper share whenever operators stretch distances for hot-aisle containment or power-distribution reasons. At 800 G, insertion-loss budgets tighten further, pressuring copper even within the short-reach domain.
Thermal-Budget Challenges at 224 Gbps PAM4 Lanes
Unit intervals below 10 ps raise equaliser power draw, and added heat must be dissipated in racks already pushing 100 kW. Signal-integrity labs show that achieving 34 dB SNR at 224 G requires advanced DSP and retimer functions that increase temperature, potentially pushing cables beyond their 90 °C rating under sustained AI loads. Vendors hedge by adopting shielded twinax with new dielectric materials, yet these next-gen designs carry higher costs that could moderate uptake where optical prices fall.
*Our forecasts treat driver/restraint impacts as directional, not additive. The impact forecasts reflect baseline growth, mix effects, and variable interactions.
Segment Analysis
By Application Area: Data Centers Drive Market Dominance
Data centers accounted for 61.35% of active copper cables market share in 2025, the highest among all use-cases. This dominance is forecast to hold through 2031 as the segment advances at a 5.41% CAGR, driven by hyperscale rack counts and AI server density that mandate thousands of intra-rack links per campus. Telecommunications follows, buoyed by 5G backhaul and centralised radio access networks that use short copper jumpers within base-band units.
The active copper cables market size for data centers is projected to widen further as edge locations replicate cloud architectures in smaller footprints. GPU-rich research labs and HPC sites add incremental demand, though their absolute volumes remain lower than hyperscale builds. Consumer electronics and industrial automation represent niche yet promising areas where low-latency, high-flex cables suit gaming rigs and deterministic factory networks. Standardisation through OCP propagates copper part numbers into these adjacent verticals, reinforcing scale and cushioning price volatility.


By Form Factor: OSFP Evolution Challenges QSFP Dominance
QSFP+/QSFP28 captured 46.30% of revenue in 2025 and still anchors most 100 G-class switch ports. Nevertheless, the 6.12% CAGR of OSFP/OSFP-XD indicates a pending leadership handover once 800 G becomes mainstream. Dual-port OSFP implementations deliver 1.6 Tb/s per module, doubling faceplate density at equivalent thermal envelopes.
As hyperscalers refresh networks, they often back-fit existing QSFP cages with QSFP-DD optics running eight electrical lanes at 50 G each. This bridging keeps the installed base active while permitting incremental speed upgrades. The active copper cables market benefits when both generations coexist because each rack requires mixed cable inventories to match NIC and switch diversity. Tight pin-spacing and reduced insertion-loss margins position established vendors with proven high-speed PCB materials to capture a premium.
By Data-Rate: 800 Gbps Emergence Reshapes Speed Hierarchy
The 100 Gbps tier retained 54.40% of shipments in 2025 owing to its ubiquity across enterprise and cloud leaf layers. The next cycle, however, shows 800 Gbps links accelerating at 5.82% CAGR as AI clusters adopt 800 G leaf-spine fabrics. The active copper cables market size allocated to 800 G ports thus rises briskly, shifting revenue mix without eliminating legacy speeds.
400 Gbps still occupies a strategic mid-cycle slot, serving as the breakout aggregate for 8×50 G servers or 4×100 G GPUs. Below 25 Gbps tiers linger in long-tail deployments such as legacy storage and edge devices. Keysight’s 224 G test suites confirm engineering readiness for the next rate jump, suggesting that copper remains relevant even beyond 1 Tb/s provided equalisation and retimers keep power envelopes viable.
By Conductor Gauge: Miniaturisation Drives Finer Wire Adoption
28 AWG leads with 59.25% unit share thanks to its balanced attenuation and mechanical strength. Growth momentum now shifts to 32 AWG and finer, which post a 6.94% CAGR as operators chase tighter bend-radii and improved airflow. These slimmer cables clear space for liquid-cooling manifolds around GPU trays and ease cable-management above servers.
Product engineers enhance signal integrity using low-skew dielectrics and twin-axial shield geometries that combat skin-effect losses in thinner conductors. The active copper cables market size for 24 AWG remains stable inside demanding HPC centres where margin matters more than space. Yet as rack densities climb, most new volume will align with 30–32 AWG siblings, reinforcing the miniaturisation trend across the forecast window.
Geography Analysis
North America controlled 37.55% of the active copper cables market in 2025 on the back of concentrated hyperscale capex. Microsoft earmarked USD 80 billion for fiscal-2025 data-center growth and Amazon committed USD 30 billion across Pennsylvania and North Carolina, locking in multi-year connectivity demand. Stable grid access, established supply chains, and streamlined permitting reinforce this leadership, although rising land and power costs push some expansion into secondary metros.
Asia-Pacific records the highest 6.32% CAGR through 2031. Multi-gigawatt projects in Johor Bahru will lift Malaysia to 1.6 GW of operational capacity, while India plans to double its installed MW by 2026 under large cloud leases. Japan experiences 69% cost inflation on data-center builds but continues to add footprint to meet domestic AI demand. This outsized regional momentum channels significant volume into local cable assemblies, sometimes favouring regional vendors where import duties or lead times constrain US-made products.
Europe shows steady, regulation-driven expansion that values energy-efficient hardware. Local data-sovereignty rules keep new capacity onshore, while renewable-rich regions such as the Nordics attract high-density compute farms that still rely on copper for internal links. Middle East and Africa trail in absolute terms but enjoy double-digit growth off a small base, supported by digital-transformation initiatives and submarine-cable landings that improve regional interconnectivity. Commodity copper supply, with material coming from Chile, the DRC, and Zambia, influences regional cost profiles and remains a strategic variable for cable manufacturers.


Competitive Landscape
The active copper cables market features mid-level concentration. Amphenol, TE Connectivity, Molex, and Luxshare control key portions of QSFP, OSFP, and PCIe cable assemblies, benefiting from owned plating, stamping, and twin-ax extrusion lines. Rising raw-material pricing above USD 5 per pound in 2024 prompted these leaders to optimise conductor cross-sections and adopt alternate alloys, initiatives that smaller players struggle to replicate at scale.
Amphenol’s acquisition of CommScope’s Andrew and LifeSync businesses expanded its signal-integrity portfolio and added USD 4.81 billion to 2025 revenue, indicating an appetite for vertical integration.[4]Amphenol Corporation, “FY-2024 Earnings Release,” amphenol.com TE Connectivity bought Richards Manufacturing to gain precision connector machining for 224 G designs. Prysmian’s move into Channell Commercial extends its reach from power cabling into data-center assemblies, a diversification strategy that balances cyclicality in telecom and energy segments.
Open standards such as OCP’s 800 G AEC specification dilute proprietary margins, yet they also expand total available volume, giving tier-two Asian manufacturers room to address cost-sensitive orders. Meanwhile, intellectual-property barriers in PAM4 DSP and retimers favour incumbents, limiting immediate erosion of premium price points. The resultant landscape combines scale advantages for top brands with niche opportunities in emerging form factors where agility and low overhead permit faster design cycles.
Active Copper Cables (ACC) Industry Leaders
NVIDIA Corporation
Cisco Systems Inc.
3M Company
TE Connectivity
Sumitomo Electric
- *Disclaimer: Major Players sorted in no particular order

Recent Industry Developments
- May 2025: Mirait Holdings secured 629.2 billion yen in orders, a 14.6% jump tied to data-center and renewable-energy cabling projects.
- May 2025: Prysmian Group agreed to acquire Channell Commercial Corporation for USD 950 million plus earn-outs, marking its entry into data-center connectivity
- February 2025: TE Connectivity closed the purchase of Richards Manufacturing, adding high-precision connectors for 224 G assemblies
- January 2025: Amphenol posted USD 15.2 billion FY-2024 sales after integrating CommScope’s Andrew and LifeSync units.


Research Methodology Framework and Report Scope
Market Definitions and Key Coverage
Active copper cables (ACCs) are short-reach twin-axial copper assemblies that embed redrivers or retimers so 25 to 800 Gbps Ethernet, InfiniBand, PCIe, and CXL traffic moves cleanly between servers, switches, and storage inside one rack or the next. Our study values factory-terminated ACCs shipped in SFP28, QSFP28, OSFP, OSFP-XD, and equivalent formats at end-customer revenue.
Scope Exclusions: passive direct-attach copper, active optical cables, and bulk copper wire without onboard electronics.
Segmentation Overview
- By Application Area
- Data Centers
- Telecommunications
- High-Performance Computing
- Consumer Electronics
- Industrial Automation
- Other Applications
- By Form Factor
- SFP+/SFP28
- QSFP+/QSFP28
- QSFP-DD
- OSFP / OSFP-XD
- By Data-Rate
- ?25 Gbps
- 40 Gbps
- 100 Gbps
- 200 Gbps
- 400 Gbps
- 800 Gbps
- By Conductor Gauge (AWG)
- 24-26 AWG
- 28-30 AWG
- 32 AWG and finer
- By Geography
- North America
- United States
- Canada
- Mexico
- South America
- Brazil
- Argentina
- Rest of South America
- Europe
- Germany
- United Kingdom
- France
- Italy
- Spain
- Russia
- Rest of Europe
- Asia Pacific
- China
- Japan
- South Korea
- India
- Australia
- Rest of Asia Pacific
- Middle East and Africa
- Saudi Arabia
- United Arab Emirates
- South Africa
- Rest of Middle East and Africa
- North America
Detailed Research Methodology and Data Validation
Primary Research
Mordor analysts interviewed cable makers, cloud network architects, and distributors across North America, Europe, and Asia-Pacific. The calls clarified port-mix shifts, typical cable lengths, and regional ASP spreads, closing gaps left by open data.
Desk Research
We began by mapping demand with HS-8544 import rows, hyperscaler capex filings, IEEE 802.3 and OCP release notes, BICSI node counts, product datasheets, audited 10-Ks, and widely cited press. Paid libraries, D&B Hoovers and Dow Jones Factiva, helped our analysts screen supplier revenues and watch price shifts. These titles illustrate, not exhaust, the evidence we reviewed.
Market-Sizing & Forecasting
A top-down model starts with installed rack counts and published switch-port roadmaps, layers region-level ACC penetration and blended ASPs, then cross-checks once with supplier roll-ups and sampled invoices. Multivariate regression projects demand using 400/800 G port shipments, rack density, copper price index, and the shift to 28 to 32 AWG gauges; cloud capex acts as a proxy where data run thin.
Data Validation & Update Cycle
Outputs face variance screens against independent port trackers before senior review. Models refresh each year, with interim updates when events such as a new CXL specification alter demand.
Why Mordor's Active Copper Cables (ACC) Baseline Commands Reliability
Published figures often diverge because each firm adopts its own product cut, uptake curve, and refresh rhythm.
By aligning scope with standards and re-checking shipment plus ASP inputs annually, Mordor Intelligence delivers a balanced baseline buyers can trust.
Benchmark comparison
| Market Size | Anonymized source | Primary gap driver |
|---|---|---|
| USD 13.12 B (2025) | Mordor Intelligence | - |
| USD 9.47 B (2024) | Global Consultancy A | Includes passive DACs and optical hybrids |
| USD 3.10 B (2024) | Industry Tracker B | Caps scope at ≤100 G; omits Asia-Pacific |
| USD 2.15 B (2024) | Trade Journal C | Uses vendor revenue only; no channel checks |
This comparison shows our figure sitting mid-range because the process is transparent, repeatable, and anchored to measurable drivers.


Key Questions Answered in the Report
What is the current size of the active copper cables market?
The market is valued at USD 13.81 billion in 2026 and is projected to reach USD 17.85 billion by 2031.
Which application dominates demand for active copper cables?
Data centers lead with 61.35% of market share in 2025 thanks to hyperscale rack volume and AI server density.
How fast is the Asia-Pacific region growing?
Asia-Pacific records a 6.32% CAGR through 2031, the fastest among all regions.
Why are 800 Gbps cables important?
AI workloads require higher bandwidth per node, making 800 G the quickest-growing data-rate segment at 5.82% CAGR.
Which form factor is gaining momentum over QSFP?
OSFP and OSFP-XD post a 6.12% CAGR as they support 800 G links with superior port density.
What challenges limit copper cable reach?
Signal attenuation and EMI restrict effective lengths to 7 m, after which active optical options become more cost-efficient.
Page last updated on:


