Data Center Wire And Cable Market Size and Share
Market Overview
| Study Period | 2020 - 2031 |
|---|---|
| Market Size (2026) | USD 22.55 Billion |
| Market Size (2031) | USD 32.92 Billion |
| Growth Rate (2026 - 2031) | 7.86% CAGR |
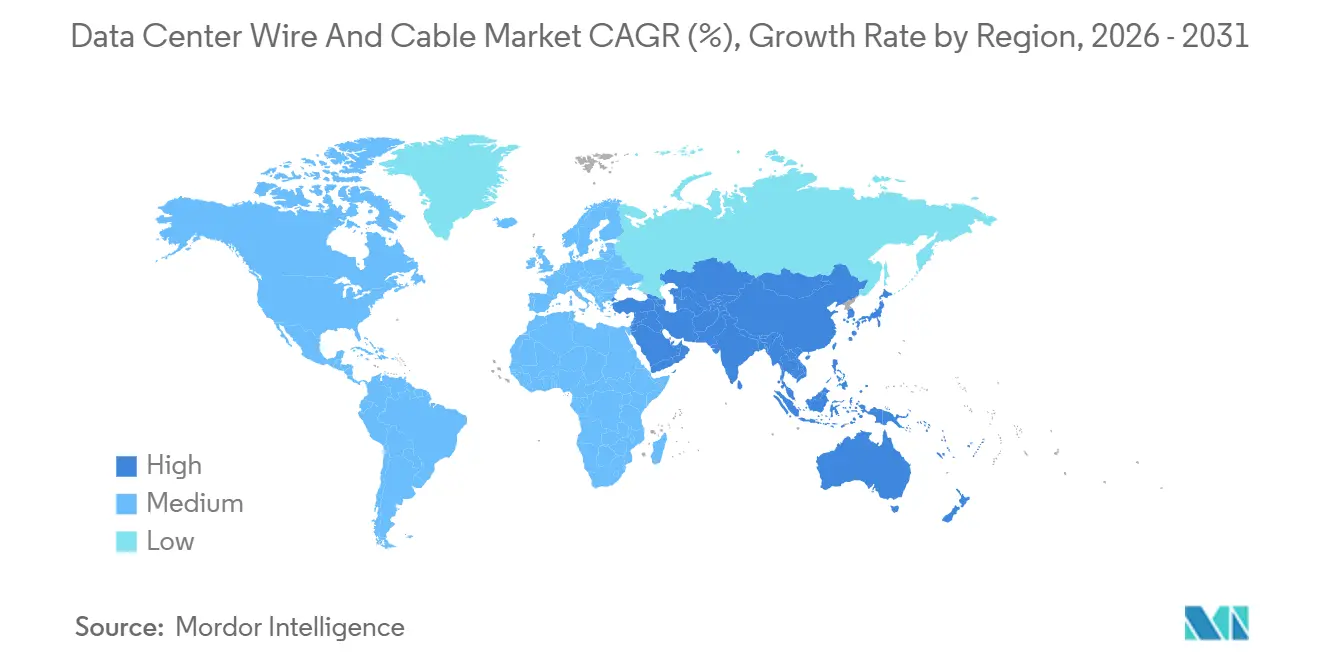
| Fastest Growing Market | Asia Pacific |
| Largest Market | North America |
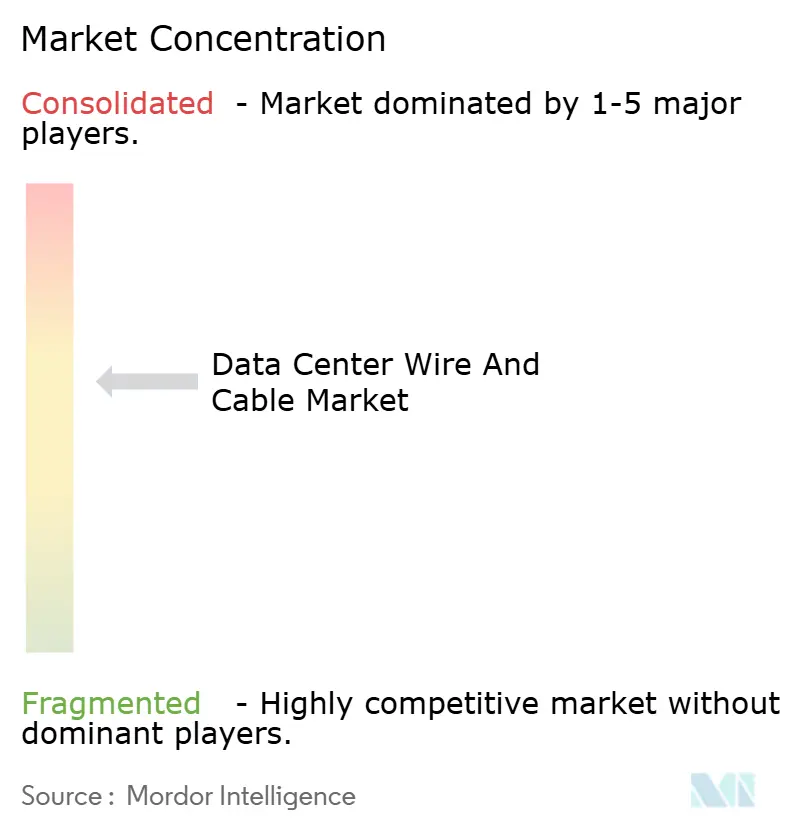
| Market Concentration | Medium |
Major Players
*Disclaimer: Major Players sorted in no particular order Image © Mordor Intelligence. Reuse requires attribution under CC BY 4.0. |
|
Data Center Wire And Cable Market Analysis by Mordor Intelligence
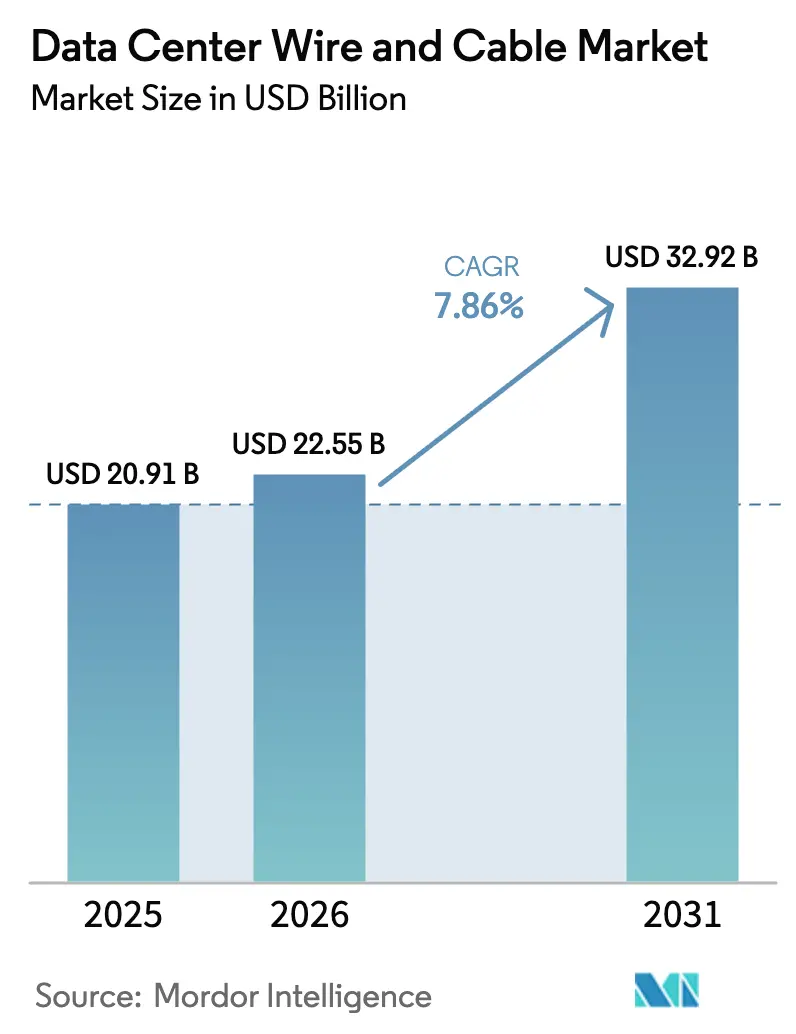
The Data center wire and cable market size is projected to be USD 20.91 billion in 2025, USD 22.55 billion in 2026, and reach USD 32.92 billion by 2031, growing at a CAGR of 7.86% from 2026 to 2031. Solid demand stems from hyperscale operators that now specify more than 10,000 fibers per rack to support GPU clusters, while data-sovereignty laws prompt new builds in countries that once relied on imports. The rapid transition from 100G to 800G optical links renders legacy copper systems obsolete within 18 months of installation, driving a wave of rip-and-replace projects. Competitive differentiation hinges on bend-insensitive fiber geometry, vertically integrated preform production, and 48-hour lead-time logistics that win bids in fast-moving build cycles. At the same time, copper and aluminum price swings, plus a widening fiber-splicing skills gap, create cost overruns and project delays that operators must factor into total cost of ownership.
Key Report Takeaways
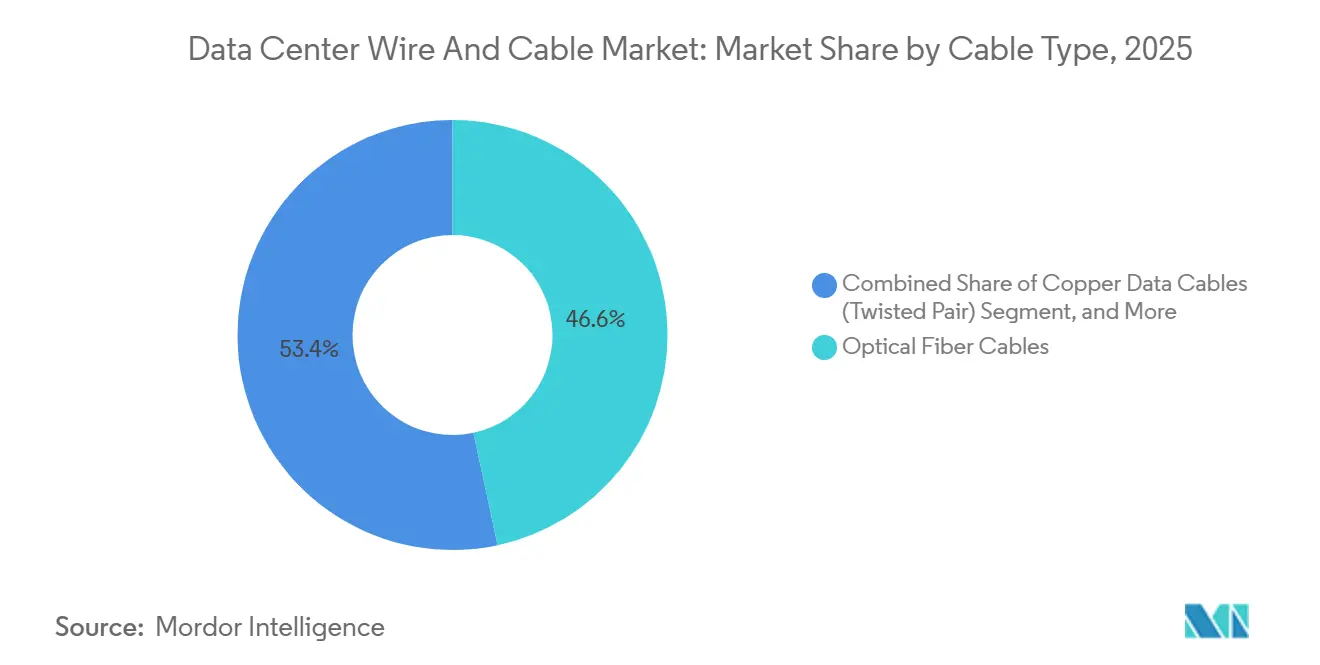
- By cable type, optical fiber captured 59.30% revenue share of the Data Center Wire and Cable market in 2025, while high-speed interconnects above 100 G are advancing at a 10.12% CAGR through 2031.
- By data center type, hyperscale facilities accounted for 48.60% of the Data Center Wire and Cable market share in 2025, whereas edge and micro deployments are expanding at an 8.78% CAGR through 2031.
- By application, structured cabling accounted for 38.60% of the Data Center Wire and Cable market in 2025, and high-speed interconnects are the fastest-growing application, with a 10.12% CAGR through 2031.
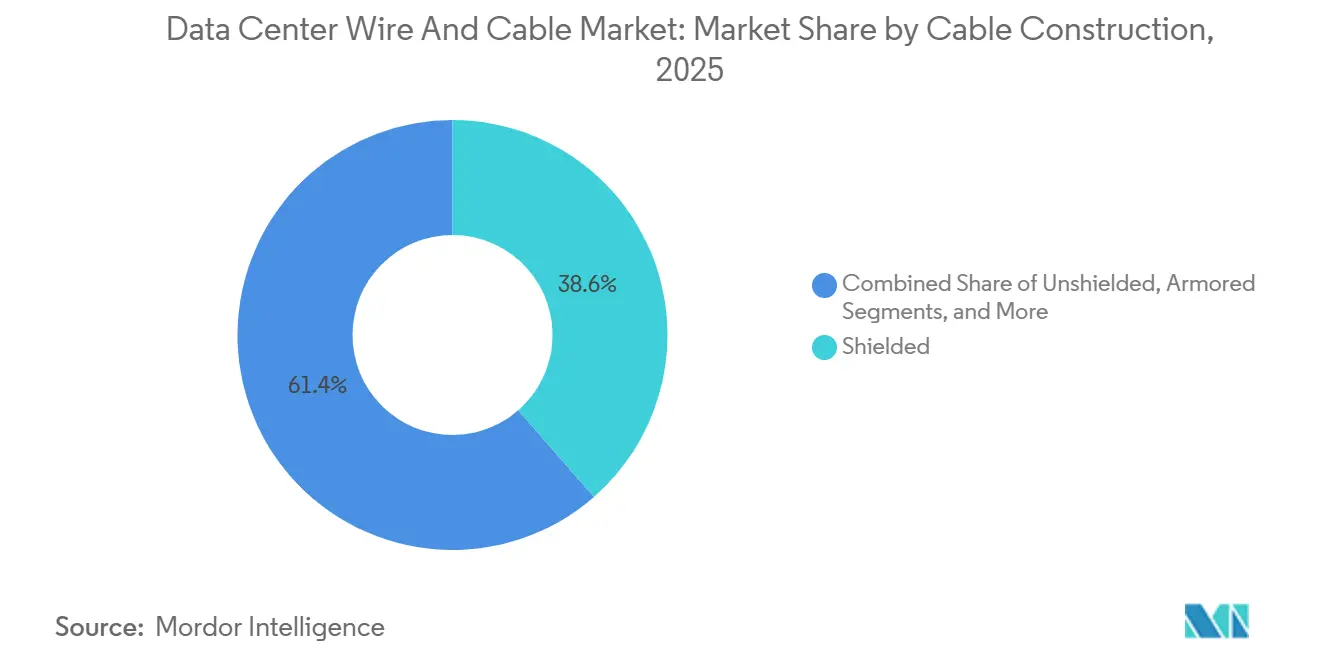
- By cable construction, unshielded twisted-pair products led with a 44.20% share in 2025, and armored variants are set to grow at an 8.74% CAGR through 2031, driven by harsh-environment edge sites.
- By deployment environment, indoor white-space projects accounted for 59.20% of 2025 revenue, while subsea and inter-facility links recorded a 7.63% CAGR through 2031.
- By geography, North America led with a 30.43% share in 2025, yet Asia-Pacific’s 8.12% CAGR to 2031, and is the fastest among regions.
Note: Market size and forecast figures in this report are generated using Mordor Intelligence’s proprietary estimation framework, updated with the latest available data and insights as of 2026.
Global Data Center Wire And Cable Market Trends and Insights
Drivers Impact Analysis*
| DRIVER | (~) % IMPACT ON CAGR FORECAST | GEOGRAPHIC RELEVANCE | IMPACT TIMELINE |
|---|---|---|---|
| Robust Data-Center Expansion Worldwide | +1.8% | Global, with APAC and Middle East leading capacity additions | Medium term (2-4 years) |
| Surge in AI and HPC Workloads Requiring Ultra-Low-Latency Links | +2.1% | North America and APAC core markets, spillover to Europe | Short term (≤ 2 years) |
| Rapid Adoption of 400G and 800G Optical Inter-Connects | +1.5% | Global, concentrated in hyperscale facilities | Short term (≤ 2 years) |
| Proliferation of Edge and Micro Data Centers | +1.2% | APAC, Latin America, and secondary North American metros | Medium term (2-4 years) |
| Sustainability Mandates for Low-Loss Recyclable Cabling | +0.9% | Europe and North America, regulatory influence from IEC standards | Long term (≥ 4 years) |
| Government Incentives for Domestic Fiber and Power-Cable Production | +0.7% | United States, India, European Union | Medium term (2-4 years) |
| Source: Mordor Intelligence | |||
Robust Data-Center Expansion Worldwide
Hyperscale operators earmarked USD 200 billion for facilities coming online in 2025-2026, with Amazon Web Services, Microsoft Azure, and Google Cloud each allocating more than USD 50 billion per year. A single 10 MW site now consumes roughly 400 kilometers of fiber and 150 kilometers of medium-voltage cable, numbers that double under liquid-cooling layouts. Suppliers therefore pre-position stock within a 200-kilometer radius of hot spots such as Virginia, Singapore, Frankfurt, and Mumbai, or lose out to rivals promising just-in-time delivery. Meta’s plan for 12 new campuses across Indonesia, Thailand, and the Philippines underscores the diffusion of cable demand into Southeast Asia. Colocation leaders reported 92% utilization in tier-one markets during Q3 2025, pushing investment toward modular designs that shorten project timelines and prioritize fire-resistant, electromagnetic-shielded specifications for every meter installed.
Surge in AI and HPC Workloads Requiring Ultra-Low-Latency Links
Training a trillion-parameter large language model needs interconnect latency below 500 nanoseconds, an impossible target for copper beyond 7 meters. Operators are therefore replacing Cat6A with active optical cables and direct-attach copper assemblies rated for 400G and 800G, shrinking the addressable legacy copper segment by an estimated 18% over 2024-2026. NVIDIA shipped more than 3 million H100 and H200 GPUs in 2025, igniting a parallel boom in optical transceivers where coherent pluggables became standard in spine switches. Microsoft reported that AI now accounts for 62% of Azure compute hours, with every point of additional AI share adding 1.3 kilometers of fiber per rack due to all-reduce traffic patterns.[1]Microsoft Investor Relations, "Investor Updates and Financial Reports," microsoft.com Suppliers able to co-design cables and optics capture design wins 18 months ahead of competitors.
Rapid Adoption of 400G and 800G Optical Inter-Connects
The jump from 100G to 400G completed in barely 24 months between mid-2024 and mid-2026, because every hour of idle GPU time costs hyperscalers about USD 45 in forfeited revenue. Early 800G deployments began in Q4 2025, with Arista and Cisco shipping switches that require OM5 multimode or OS2 single-mode fiber tolerating eight 100G wavelengths. Corning responded by investing USD 500 million to expand its North Carolina plant, adding preform capacity that trims lead times to eight weeks. Yet preform production remains concentrated in only three nations, so any geopolitical shock could double delivery cycles and stall hyperscale buildouts.
Proliferation of Edge and Micro Data Centers
Latency-critical services such as autonomous driving and industrial IoT need compute within 10 milliseconds of users. Telecom carriers and tower owners deployed more than 8,000 edge sites in 2025, each favoring pre-terminated fiber assemblies that cut on-site labor. Vapor IO and Crown Castle embed micro facilities in 5G towers with IP67 connectors that command a 35% price premium but eliminate climate-controlled enclosures. Edge sites show an 8.23% CAGR through 2031, thanks to higher cable intensity per rack and redundant pathways that double meters per kilowatt versus hyperscale norms. Schneider Electric’s modular edge platform reduces install time from 14 days to three, while locking customers into proprietary cable lengths that stifle competitive bidding.[2]Schneider Electric Sustainability Report, "Sustainability Initiatives," se.com
Restraints Impact Analysis*
| Restraint | (~) % Impact on CAGR Forecast | Geographic Relevance | Impact Timeline |
|---|---|---|---|
| Thermal-Management Challenges in High-Density Bundles | -0.8% | Global, acute in hyperscale and HPC facilities | Short term (≤ 2 years) |
| Retrofitting Legacy Facilities with High-Speed Cabling | -0.6% | North America and Europe, older enterprise campuses | Medium term (2-4 years) |
| Volatility in Copper and Aluminum Commodity Prices | -1.1% | Global, supply-chain dependencies on Chile, China, and Australia | Short term (≤ 2 years) |
| Skilled-Labor Shortage for Advanced Fiber Termination | -0.7% | North America, Europe, and emerging APAC markets | Medium term (2-4 years) |
| Source: Mordor Intelligence | |||
Thermal-Management Challenges in High-Density Bundles
AI accelerator racks dissipate up to 120 kilowatts, raising tray temperatures 15-22 °C above design limits. Standard PVC jackets fail above 75 °C, slashing cable life from 20 years to 8 years and voiding warranties. Operators are shifting to plenum-rated low-smoke-zero-halogen compounds tolerant of 90 °C, yet these cost 28% more per meter and add 12% insertion loss on optical runs. Liquid-cooling loops introduce risk of leaks that corrode conductors within 72 hours, so insurers now require 150 millimeter separation between data and power bundles. NFPA-70’s 2025 update further derated ampacity by 18%, triggering retrofits in many hyperscale halls.[3]NFPA Editorial Team, “NFPA 70 2025 Edition Updates,” nfpa.org
Volatility in Copper and Aluminum Commodity Prices
Copper futures spiked from USD 8,200 per metric ton in January 2025 to USD 10,100 in April before falling back to USD 8,900 by year-end, a 23% swing that wiped out margins for manufacturers locked into fixed-price bids. Power cables, which are 60-70% copper, absorb the shock. Aluminum saw similar instability following smelter shutdowns in China’s Yunnan province. Tier-one vendors responded with upstream hedging. Prysmian bought a 15% stake in a Peruvian mine to lock in copper at USD 8,600 per ton through 2029. Regional firms lacking such hedges either withdrew from tenders or bid higher, ceding share.
*Our forecasts treat driver/restraint impacts as directional, not additive. The impact forecasts reflect baseline growth, mix effects, and variable interactions.
Segment Analysis
By Cable Type: Fiber Extends Its Lead
Optical fiber held 46.64% of 2025 revenue and will grow at an 8.18% CAGR, so the segment remains the cornerstone of the Data center wire and cable market. Single-mode variants capture 68% of optical revenue because hyperscale campuses need low-loss links spanning hundreds of meters. Multimode serves short runs within racks and between adjacent rows. Copper data lines, mainly Cat6A and Cat8, are still relevant in edge facilities where 10G suffices, but AI workloads make their bandwidth ceiling untenable in hyperscale halls. Meanwhile, power cables post steady demand across high-, medium-, and low-voltage ranges, with medium-voltage copper conductors dominating utility feeds. Aluminum power lines gain share in markets where copper premiums top 40%, though larger cross-sections complicate conduit fills. Hybrid designs, such as Corning’s 144-fiber plus four-pair trunk, illustrate convergence between data and low-voltage power.
Optical innovation accelerates in response to 800G optics that need bend-insensitive, wideband multimode fiber. Volume growth surpasses price erosion as Chinese and Indian makers flood commodity single-mode SKUs, compressing margins but expanding addressable volume. High-density GPU clusters force bundles surpassing 3,456 fibers, challenging manufacturing tolerances. Suppliers who master tight bend radius and simplified polarity labeling secure multi-year contracts from hyperscale buyers. In the power segment, row-level UPS adoption propels 8.5% CAGR for PDU cables. Liquid-cooled rack rollouts lift HVAC cabling as sensors and control loops multiply. Together, these shifts maintain robust cable pull lengths even as per-rack server counts plateau.


By Data Center Type: Hyperscale Dominates, Edge Gains Pace
Hyperscale campuses generated 52.37% of 2025 spending, driven by GPU demand and multi-year capex allocations from the cloud triopoly. Buying power lets them secure 30% discounts on fiber assemblies, yet custom colors, polarity, and labeling restrict the approved-vendor list. Edge and micro sites log an 8.23% CAGR to 2031, propelled by 5G densification and latency targets under 10 milliseconds. Colocation providers take 28% of revenue by marketing flexibility, modular trunks with fan-out tails allow tenants to light capacity one aisle at a time, guarding capex in volatile economic cycles. Enterprises still own a long tail of on-premise rooms, but their refresh cycles lengthen, making them laggards in 400G adoption.
Architectural contrasts drive variant specifications. Hyperscale builds need armored outdoor fiber between buildings, often 2 kilometers point-to-point, while edge sites rarely exceed 100 meters indoors and select plenum-rated jackets for code compliance. Colocation operators must isolate each tenant’s cable pathway, inflating labor hours by 25%. Digital twins such as Schneider Electric’s EcoStruxure optimize routing and postpone new conduit runs. In emerging markets, plug-and-play kits replace field terminations to skirt scarce skilled labor, a development that gives Panduit and CommScope extra leverage but exposes them to price transparency via online configurators.
By Application: High-Speed Interconnects Accelerate
Structured cabling delivered 34.18% of application revenue in 2025, rooted in TIA-942 standards that remain valid for traditional enterprise floors. Yet high-speed interconnects above 100G post a 9.47% CAGR through 2031, becoming the fastest expansion vector in the Data center wire and cable market. GPU-to-GPU traffic now exceeds 50 Tbps per cluster, so operators deploy active optical cables up to 100 meters and passive copper assemblies under 5 meters. Active optical captured 58% of the high-speed slice in 2025 because it cuts power consumption to 1.5 watts per link and shrugs off electromagnetic noise. Power distribution holds roughly 31% share and grows in lockstep with overall megawatts, but unit margins compress as busway systems commoditize. HVAC and building systems gain profile because liquid cooling needs dedicated fiber links for temperature monitoring, and some hyperscale sites specify redundant sensor networks for sub-second fault detection.
High-speed cabling incurs firmware headaches. NVIDIA’s 800G InfiniBand cable, launched Q1 2026, pushes 1.6 Tbps over OM5 but required switch firmware upgrades at early adopters. Structured cabling faces slower growth because enterprises stretch Cat6A refresh cycles to a decade. ISO/IEC 11801 keeps certification barriers in place, preserving installer billing rates even as hardware commoditizes. Lost compute hours average USD 500,000 when monitoring links fail, so sensor and control cables demand premium quadruple-tested assemblies.
By Cable Construction: Plenum-Rated Adoption Climbs
Shielded designs owned 38.57% of 2025 revenue, their foil or braided screens blocking electromagnetic interference from power supplies and drives. Unshielded twisted pair still appears in cost-sensitive enterprise rooms but keeps losing share as 25G and 40G Ethernet roll out. Plenum-rated cables, compliant with low-smoke-zero-halogen rules, grow at 9.32% CAGR to 2031, driven mainly by code updates in North America and Europe. Operators accept an 8-12% insurance discount when they certify full plenum coverage, partially offsetting the per-meter price uplift. Armored lines advance at 7.1% CAGR because hyperscalers extend private fibers between campuses to trim latency and avoid carrier tariffs. Cost-performance trade-offs persist, shielded designs add USD 0.35-0.60 per meter but deliver clear returns only where ambient electromagnetic noise exceeds 3 V/m, generally in industrial or multi-tenant telecom facilities.
Plenum demand responds to regulation rather than inherent performance. NFPA-262 flame tests drive adoption even in halls with advanced water-mist suppression. Hybrid products such as Panduit’s 48-fiber plus eight-pair plenum trunk launched in 2025 reduce conduit fill by 40% and smooth installation. Unshielded cables linger in pop-up edge deployments where crews swap gear every 18 months, but their future looks limited as code authorities tighten rules.
By Deployment Environment: Indoor White Space Sets the Volume Pace
Indoor white-space work represented 62.94% of revenue in 2025, cementing it as the bulk environment for the Data center wire and cable market. Pre-terminated MPO trunks speed installs and cut labor 40%, though they lock operators into proprietary connectors. Outdoor plant cabling grows 6.8% CAGR as Southeast Asian and Middle Eastern greenfield sites proliferate. Sub-sea and inter-facility links, while a small slice, rise 8.53% CAGR because hyperscalers fund private transoceanic fibers that slash latency 18% below public routes.
Google’s Red Sea breakage in March 2025 illustrated the risk and spurred demand for armored designs with Kevlar or steel strength members. Indoor runs favor plenum jackets, while outdoor lines need polyethylene rated for −40 °C to +70 °C swings and ultraviolet exposure. Deployment mix by facility type diverges; hyperscale campuses allocate 22% of cable spend to inter-building links, while colocation halls delegate most perimeter plant work to landlords.
Geography Analysis
North America controlled 30.43% of 2025 revenue on the back of Virginia’s 2,500 MW corridor and rising hubs in Phoenix and Dallas. Loudoun County’s tax incentives and fiber density keep it attractive, yet land and power constraints cap future buildouts. Growth moderates to 7.2% CAGR through 2031, with fresh megawatts shifting toward secondary metros such as Wisconsin, where Microsoft plans a USD 10 billion campus using on-site nuclear power, although permitting stretches four years. Canada leverages inexpensive hydroelectricity in Montreal and Toronto, while Mexico’s Querétaro region draws near-shoring investment. Together, these trends broaden the cable supply footprint across North America.
Asia-Pacific shows the quickest pace at 8.12% CAGR to 2031. China’s Guizhou and Inner Mongolia provinces added 1,200 MW in 2025, yet developers now must source 50% renewable energy by 2028 under dual-carbon policies. India’s Navi Mumbai and Hyderabad clusters grew 34% year-over-year, spurred by production-linked incentives and fiber rollouts from Reliance Jio. Southeast Asia benefits from its neutral stance in U.S.–China technology tensions, but fragmented rules slow cross-border fiber approvals by up to nine months. Operators hedge by building within Indonesia, Malaysia, and Vietnam, each slated to add more than 500 MW of IT load by 2028.
Europe captured 24% of the 2025 total. Frankfurt and Amsterdam remain focal points, but EU Taxonomy rules add USD 0.15-0.25 per meter to cable acquisition. Nordic countries draw hyperscalers with renewable surpluses, yet sub-zero winters mandate heated trays that consume 3-5% of site power. Brexit labor gaps prolonged U.K. installations from eight to 14 weeks, forcing some operators to import pre-terminated kits despite 12% tariffs. Middle East and Africa ride sovereign wealth investment, Saudi Arabia’s NEOM earmarked USD 3 billion for cabling in 2025, specifying sand-resistant jackets to survive desert grit. Latin America, led by São Paulo, benefits from rising cloud adoption, yet power-grid reliability challenges keep colocation designs conservative.

Competitive Landscape
The Data center wire and cable market remains moderately fragmented. The top five suppliers, Prysmian, Nexans, Corning, Belden, and CommScope, held roughly 38% in 2025, leaving the balance to regional firms and in-house hyperscale manufacturing arms.
Upstream integration defines leadership; Corning and Prysmian invest in preform furnaces to cut costs and reduce lead-time variance, while downstream specialists like Panduit and TE Connectivity win contracts through application engineering and just-in-time logistics. Design-in cycles favor vendors that co-develop with silicon houses such as Broadcom and Marvell, landing sockets 18 months earlier than rivals. Automation in testing lines trims per-unit QA cost by 30% and shortens lead times to 10 days.
Innovation arrived with Prysmian’s July 2025 patent for hollow-core fiber that reduces latency by 31%, although splice compatibility issues delay broad rollout. Chinese maker Yangtze Optical undercut Western prices by 22% on standard single-mode SKUs, capturing enterprise share where price outweighs brand loyalty. Indian assembler Sterlite Technologies leverages low-cost labor and ISO 9001 certification to win edge-deployment contracts. Regulatory gates remain high, IEC 60332 and ISO/IEC 11801 compliance requires in-house labs that smaller entrants cannot afford. Service differentiation sensor-embedded jackets, recyclable compounds, or 48-hour delivery therefore shapes competitive advantage as price gaps narrow.
Data Center Wire And Cable Industry Leaders
-
Nexans S.A.
-
Belden Inc.
-
Panduit Corp.
-
CommScope Holding Co. Inc.
-
Corning Inc.
- *Disclaimer: Major Players sorted in no particular order

Recent Industry Developments
- January 2026: Corning committed USD 500 million to expand its North Carolina optical fiber plant, adding two preform furnaces and four draw towers that raise capacity 35% and cut lead times to eight weeks.
- December 2025: Prysmian secured a 15% equity stake in Southern Copper Corporation’s Peruvian mine for USD 340 million, locking copper at USD 8,600 per ton through 2029.
- November 2025: Belden launched REVConnect Fiber+, a 144-fiber MPO trunk with automated polarity management that slashed installation errors by 68% in 12 hyperscale pilots.
- October 2025: Nexans opened a EUR 180 million (USD 195 million) medium-voltage cable plant in Pune, India, reducing logistics costs 28% versus imports.


Global Data Center Wire And Cable Market Report Scope
The Data Center Wire and Cable Market is witnessing significant growth due to the increasing demand for high-speed data transmission, the expansion of hyperscale data centers, and the rising adoption of cloud computing. The market is also driven by advancements in cable technologies and the growing need for efficient power distribution and structured cabling solutions in modern data centers.
The Data Center Wire and Cable Market Report is Segmented by Cable Type (Optical Fiber, Copper Data, Power Cables by Voltage and Material and Application, Other Types), Data Center Type (Enterprise Edge and Micro, Colocation, Hyperscale), Application (Structured Cabling, Power Distribution, HVAC and Building Systems, Monitoring and Control, High-Speed Interconnects), Cable Construction (Shielded, Unshielded, Armored, Plenum-Rated), Deployment Environment (Indoor White Space, Outdoor Plant, Sub-Sea and Inter-Facility), and Geography (North America, South America, Europe, Asia Pacific, Middle East, Africa). The Market Forecasts are Provided in Terms of Value in USD.
| Optical Fiber Cables | |
| Copper Data Cables (Twisted Pair) | |
| Power Cables | Voltage Type |
| High Voltage (HV) | |
| Medium Voltage (MV) | |
| Low Voltage (LV) | |
| Material Type | |
| Copper | |
| Aluminum | |
| Application | |
| PDUs and UPS Systems | |
| HVAC System | |
| Networking and IT Equipment | |
| Other Power Cable Applications | |
| Other Cable Types (Grounding, Sensor, Control) |
| Enterprise, Edge and Micro |
| Colocation |
| Hyperscale |
| Structured Cabling |
| Power Distribution |
| HVAC and Building Systems |
| Monitoring and Control |
| High-Speed Interconnects (>100 G) |
| Shielded |
| Unshielded |
| Armored |
| Plenum-Rated |
| Indoor (White Space) |
| Outdoor Plant |
| Sub-Sea and Inter-Facility |
| North America | United States |
| Canada | |
| Mexico | |
| South America | Brazil |
| Argentina | |
| Rest of South America | |
| Europe | Germany |
| United Kingdom | |
| France | |
| Nordic Region | |
| Russia | |
| Rest of Europe | |
| Asia Pacific | China |
| India | |
| Japan | |
| South Korea | |
| Southeast Asia | |
| Rest of Asia Pacific | |
| Middle East | UAE |
| Saudi Arabia | |
| Turkey | |
| Rest of Middle East | |
| Africa | South Africa |
| Nigeria | |
| Rest of Africa |
| By Cable Type | Optical Fiber Cables | |
| Copper Data Cables (Twisted Pair) | ||
| Power Cables | Voltage Type | |
| High Voltage (HV) | ||
| Medium Voltage (MV) | ||
| Low Voltage (LV) | ||
| Material Type | ||
| Copper | ||
| Aluminum | ||
| Application | ||
| PDUs and UPS Systems | ||
| HVAC System | ||
| Networking and IT Equipment | ||
| Other Power Cable Applications | ||
| Other Cable Types (Grounding, Sensor, Control) | ||
| By Data Center Type | Enterprise, Edge and Micro | |
| Colocation | ||
| Hyperscale | ||
| By Application | Structured Cabling | |
| Power Distribution | ||
| HVAC and Building Systems | ||
| Monitoring and Control | ||
| High-Speed Interconnects (>100 G) | ||
| By Cable Construction | Shielded | |
| Unshielded | ||
| Armored | ||
| Plenum-Rated | ||
| By Deployment Environment | Indoor (White Space) | |
| Outdoor Plant | ||
| Sub-Sea and Inter-Facility | ||
| By Geography | North America | United States |
| Canada | ||
| Mexico | ||
| South America | Brazil | |
| Argentina | ||
| Rest of South America | ||
| Europe | Germany | |
| United Kingdom | ||
| France | ||
| Nordic Region | ||
| Russia | ||
| Rest of Europe | ||
| Asia Pacific | China | |
| India | ||
| Japan | ||
| South Korea | ||
| Southeast Asia | ||
| Rest of Asia Pacific | ||
| Middle East | UAE | |
| Saudi Arabia | ||
| Turkey | ||
| Rest of Middle East | ||
| Africa | South Africa | |
| Nigeria | ||
| Rest of Africa | ||


Key Questions Answered in the Report
What is the projected size and CAGR for the data center wire and cable market between 2026 and 2031?
Revenue is forecast to reach USD 32.92 billion by 2031, rising from USD 22.55 billion in 2026 at a 7.86% CAGR.
Which cable type is expected to grow fastest in global data-center deployments?
Optical fiber leads with an 8.18% CAGR to 2031, driven by the transition from 100G to 800G interconnects and AI‐centric bandwidth needs.
How will edge and micro data centers influence cabling demand through 2031?
Their 8.23% CAGR reflects thousands of small-footprint sites that use pre-terminated fiber assemblies and redundant runs, lifting cable meters per kilowatt compared with hyperscale halls.
Why are plenum-rated cables gaining adoption in data-center facilities?
Tightening fire codes and insurance incentives in North America and Europe push operators toward low-smoke-zero-halogen jackets, sending plenum-rated designs up at a 9.32% CAGR.
Which geographic region will see the highest growth in data-center cabling revenue to 2031?
Asia-Pacific shows the fastest expansion at an 8.12% CAGR, buoyed by large-scale projects in China, India, and Southeast Asia.
How concentrated is supplier competition across data-center wire and cable vendors?
The top five companies captured roughly 38% of 2025 revenue, resulting in a moderate concentration score of 6 on a 10-point scale.
Page last updated on:


