Market Overview
| Study Period | 2020 - 2031 |
|---|---|
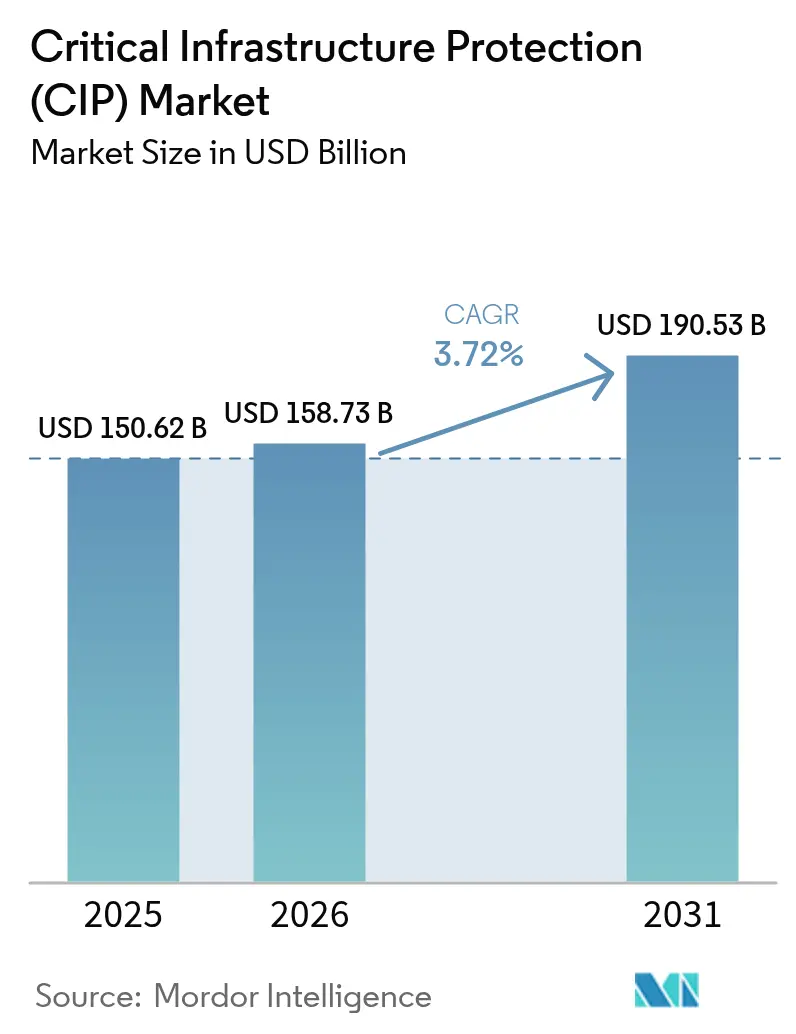
| Market Size (2026) | USD 158.73 Billion |
| Market Size (2031) | USD 190.53 Billion |
| Growth Rate (2026 - 2031) | 3.72% CAGR |
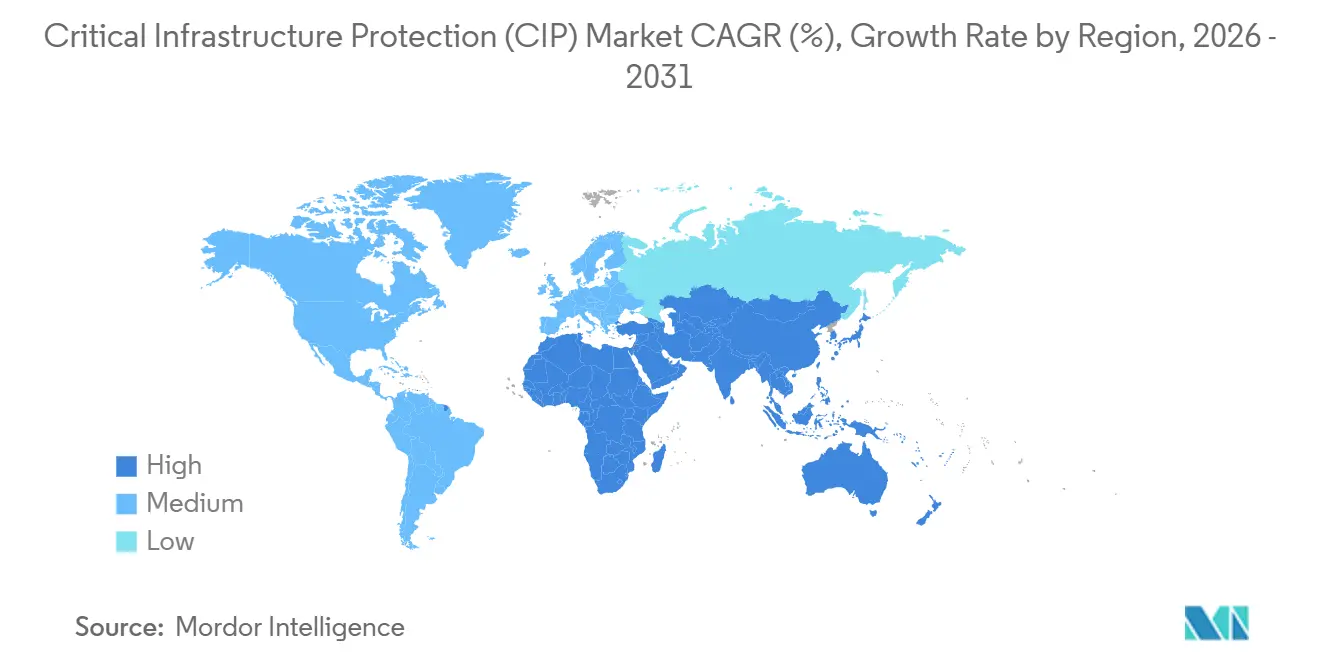
| Fastest Growing Market | Asia Pacific |
| Largest Market | North America |
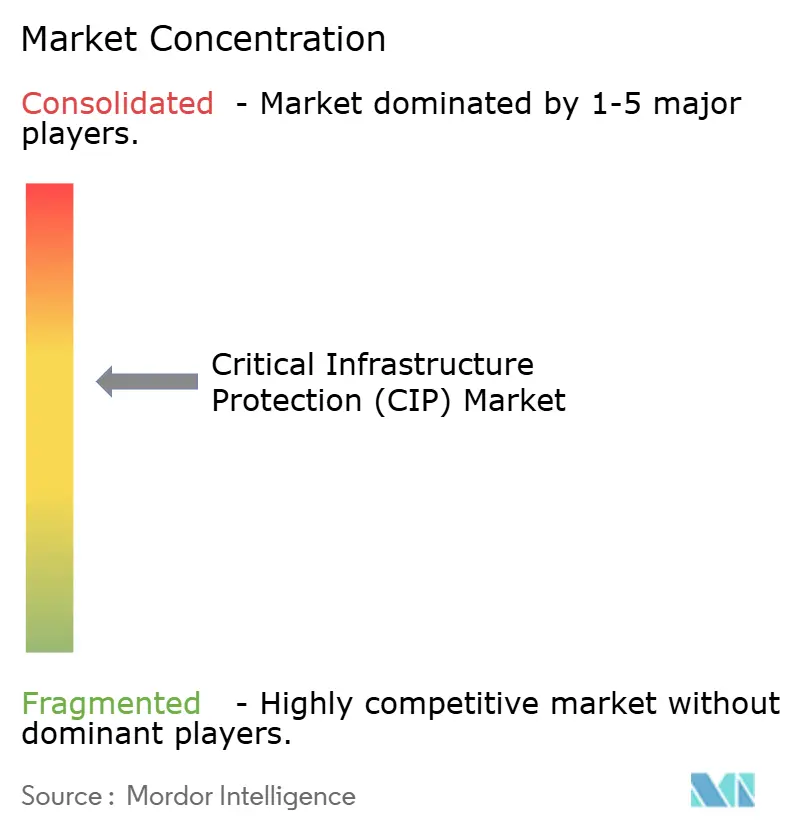
| Market Concentration | Medium |
Major Players *Disclaimer: Major Players sorted in no particular order Image © Mordor Intelligence. Reuse requires attribution under CC BY 4.0. | |
Critical Infrastructure Protection (CIP) Market Analysis by Mordor Intelligence
The critical infrastructure protection market size is projected to be USD 150.62 billion in 2025, USD 158.73 billion in 2026, and reach USD 190.53 billion by 2031, growing at a CAGR of 3.72% from 2026 to 2031. Heightened state-sponsored attacks on operational-technology networks, mandatory zero-trust deadlines across the United States and the European Union, and the rapid multiplication of 5G edge nodes are redrawing risk calculations for utilities, transport hubs, and telecom carriers. Capital budgets continue to favor perimeter cameras, access control, and SCADA-hardening appliances, yet a decisive pivot toward subscription-based monitoring and incident response is visible as operators confront talent shortages and escalating compliance audits. Vendors that offer unified asset discovery, protocol-aware anomaly detection, and cloud-delivered threat intelligence are seizing share, while sovereign-wealth funding in the Middle East and large-scale smart-grid roll-outs in Asia-Pacific sustain double-digit project pipelines. The cumulative effect is a market that appears mature on paper yet is being re-architected around identity centric, assume-breach principles that treat every physical site and every PLC as an internet-connected endpoint.
Key Report Takeaways
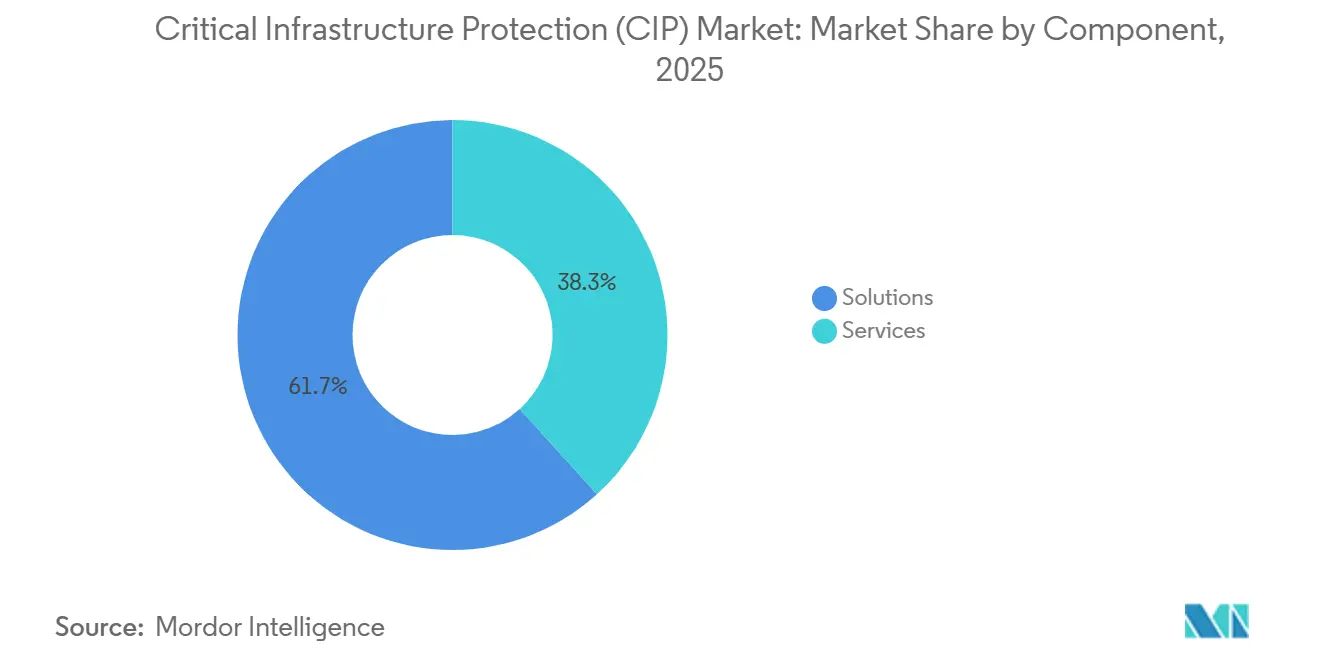
- By component, solutions held 61.73% of 2025 revenue while services are expanding at a 3.77% CAGR through 2031.
- By security type, physical safety and security accounted for 52.81% of 2025 spending, whereas cybersecurity is advancing at a 4.01% CAGR toward 2031.
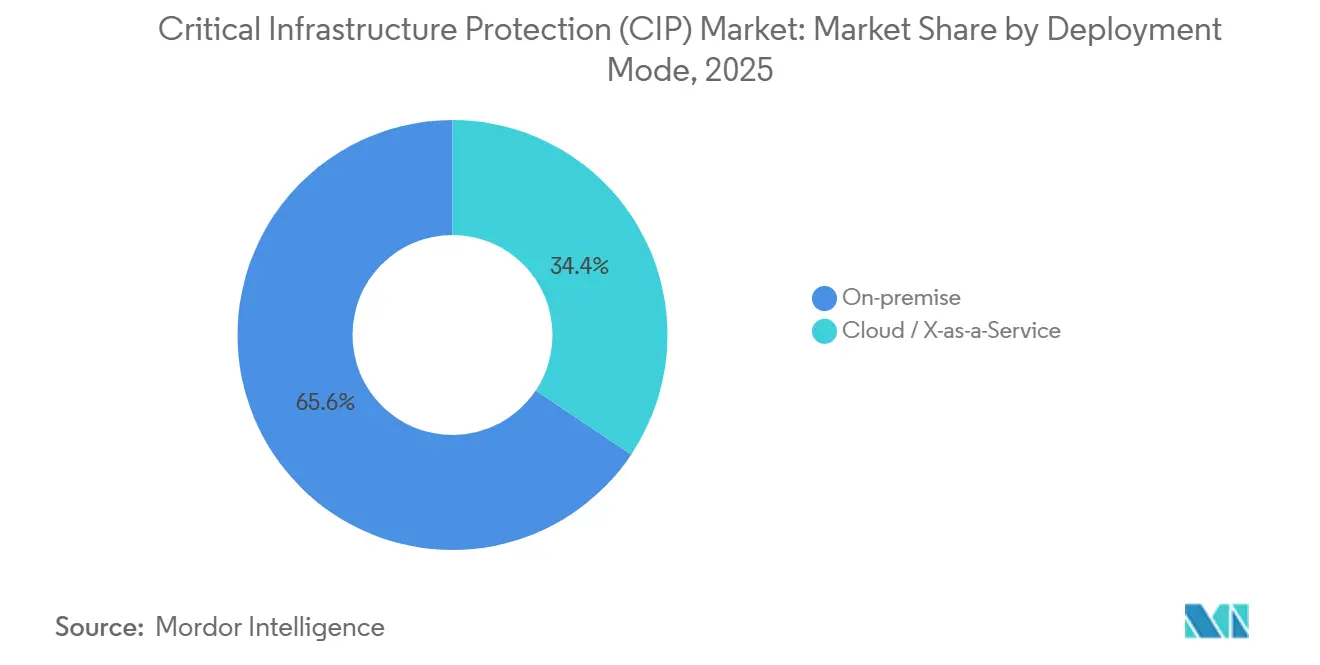
- By deployment mode, on-premise implementations contributed 65.62% of 2025 turnover, but cloud and X-as-a-service offerings are set to rise at a 3.85% CAGR over the forecast window.
- By vertical, energy and power led with 28.38% of 2025 spending and telecommunications is forecast to post the fastest 3.97% CAGR through 2031.
- By geography, North America captured 40.47% of 2025 value, yet Asia-Pacific is on track for the quickest 4.05% CAGR to 2031.
Note: Market size and forecast figures in this report are generated using Mordor Intelligence’s proprietary estimation framework, updated with the latest available data and insights as of 2026.
Market Trends and Insights
Drivers Impact Analysis of Critical Infrastructure Protection (CIP) Market*
| Driver | (~) % Impact on CAGR Forecast | Geographic Relevance | Impact Timeline |
|---|---|---|---|
| Growing Government Mandates in North America and Europe | +1.2% | North America and Europe, spillover to Asia-Pacific | Medium term (2-4 years) |
| State-Backed OT Cyber-Attacks on Energy and Water Utilities | +0.9% | Global, concentrated in North America, Europe, Middle East | Short term (≤ 2 years) |
| Smart-Grid Roll-Outs Driving Integrated Physical-Cyber Spending | +0.8% | Global, led by Asia-Pacific and North America | Long term (≥ 4 years) |
| 5G and Edge Expansion Increasing Telecom Attack Surface in Asia-Pacific | +0.6% | Asia-Pacific core, adoption in Middle East and Europe | Medium term (2-4 years) |
| IT-OT Convergence Accelerating Zero-Trust Adoption | +0.7% | North America and Europe, emerging in Asia-Pacific | Medium term (2-4 years) |
| Public-Private Funding for Airport and Port Security in Middle East | +0.4% | Middle East, selective projects in Africa and Asia-Pacific | Long term (≥ 4 years) |
| Source: Mordor Intelligence | |||
Growing Government Mandates in North America and Europe
Regulatory pressure is compressing multi-year modernization roadmaps into accelerated funding cycles across electricity, water, and transport operators. The United States final performance goals published in 2025 compel sixteen critical sectors to implement continuous monitoring, zero-trust segmentation, and incident-response drills by 2027.[1]U.S. Cybersecurity and Infrastructure Security Agency, “Cross-Sector Cybersecurity Performance Goals,” CISA.gov Europe’s NIS2 Directive widens the compliance net to more than 160,000 entities and introduces fines up to 2% of global turnover for lapses. Supply-chain mapping clauses have triggered board-level reviews that expose untracked dependencies on legacy firmware and end-of-life components, pushing demand for vendor-risk-management platforms certified under IEC 62443. Procurement solicitations now bundle asset inventory tools with managed detection and response services, reflecting the realization that regulations require both technology and round-the-clock expertise.
State-Backed OT Cyber-Attacks on Energy and Water Utilities
Nation-state campaigns have shifted from data theft to kinetic disruption, exploiting weakly segmented substations and water-treatment facilities. A February 2025 investigation confirmed lateral movement from enterprise email servers into substation controllers at multiple U.S. cooperatives before operators isolated traffic.[2]U.S. Department of Energy, “Grid Deployment Office Funding Announcement,” Energy.gov The United Kingdom issued a September 2025 advisory after reconnaissance of water-utility historian databases, noting the continued presence of default credentials on decades-old HMIs. Utilities are therefore fast-tracking purchases of unidirectional gateways, protocol-aware firewalls, and out-of-band sensors that collect encrypted traffic for cloud analytics without introducing write paths. Vendors that can baseline industrial protocols passively are winning contracts where downtime for active scanning is unacceptable.
Smart-Grid Roll-Outs Driving Integrated Physical-Cyber Spending
Smart-metering, distributed energy resources, and microgrid controllers are expanding attack surfaces faster than traditional controls can cover them. In October 2025 the United States allocated USD 3.46 billion to grid-modernization projects that explicitly combine perimeter intrusion systems with cloud-based threat intelligence. India’s April 2025 substation mandate compels every new 220 kV site to integrate video analytics with network-anomaly monitoring, pushing joint bids from automation majors and cybersecurity specialists. Renewable operators now specify bundled fencing, drone detection, and SCADA hardening in one RFP, illustrating a purchasing mindset that no longer distinguishes between physical and cyber domains.
5G and Edge Expansion Increasing Telecom Attack Surface in Asia-Pacific
Standalone 5G cores, open radio access networks, and edge data centers place compute resources in thousands of new micro-locations across Asia-Pacific. The GSM Association’s security assurance scheme, released in 2025, forces vendors to document component provenance and integrity for every network function. Operators are layering ruggedized firewalls and continuous monitoring at cell sites to maintain autonomy during backhaul loss, while adopting identity-centric policies that authenticate every orchestration API. Edge nodes designed for content caching now also host industrial IoT gateways, intermingling consumer and operational traffic and making unified security architectures mandatory.
Restraints Impact Analysis of Critical Infrastructure Protection (CIP) Market*
| Restraint | (~)% Impact on CAGR Forecast | Geographic Relevance | Impact Timeline |
|---|---|---|---|
| Legacy OT-Security Interoperability Gaps | −0.6% | Global, acute in North America and Europe | Medium term (2-4 years) |
| Shortage of OT-Skilled Cybersecurity Workforce | −0.8% | Global, most severe in North America, Europe, Asia-Pacific | Long term (≥ 4 years) |
| High Total Cost of Ownership of End-to-End Solutions | −0.5% | Global, particularly constraining in emerging markets | Medium term (2-4 years) |
| Fragmented Regulations in Emerging Economies | −0.3% | South America, Africa, Southeast Asia | Long term (≥ 4 years) |
| Source: Mordor Intelligence | |||
Shortage of OT-Skilled Cybersecurity Workforce
Utilities and manufacturers are competing for engineers who can decipher both Modbus packet captures and Active Directory logs. The United States forecasts 32% growth in security-analyst demand through 2034, but only 12% of practitioners have hands-on SCADA experience.[3]U.S. Bureau of Labor Statistics, “Occupational Outlook: Information Security Analysts,” Bls.gov A 2025 SANS study found that 68% of operators lack staff able to tune industrial firewalls, leading to over-dependence on vendors and 29% higher consulting rates since 2024. This scarcity delays greenfield deployments, inflates labor budgets, and pushes smaller operators toward managed detection subscriptions that shift expertise off-site.
Legacy OT-Security Interoperability Gaps
Brownfield plants run proprietary firmware that cannot host endpoint agents or encrypted protocols, complicating any attempt at unified monitoring. Retrofitting IEC 62443 controls often demands new protocol gateways and planned outages that clash with just-in-time production targets. An ARC Advisory Group survey in 2025 reported 54% of process manufacturers citing vendor lock-in and missing APIs as blockers to adopting anomaly detection. The resulting patchwork of passive taps and custom scripts raises total cost of ownership, especially for medium-sized plants that lack spare capital for rip-and-replace upgrades.
*Our forecasts treat driver/restraint impacts as directional, not additive. The impact forecasts reflect baseline growth, mix effects, and variable interactions.
Critical Infrastructure Protection (CIP) Market Segment Analysis
By Component:
Services Gain as Compliance Complexity RisesSolutions controlled 61.73% of 2025 spending, illustrating how video surveillance, access controllers, and industrial firewalls still anchor the critical infrastructure protection market size at facility level. Yet recurrent audits under NIS2 and United States performance goals are steering buyers toward advisory, integration, and managed response offerings that promise predictable subscription lines rather than sporadic capital spikes. Services revenue is expected to climb at a 3.77% CAGR through 2031, and the critical infrastructure protection industry now treats round-the-clock monitoring as a budgeted utility rather than a discretionary add-on. Operators struggling with scarce OT talent increasingly outsource log triage and incident containment, driving multi-year contracts that bundle compliance reporting and staff augmentation.
The shift also stems from integration headaches caused by mixed-generation PLCs and diversified camera fleets. Managed service providers absorb that complexity, promising single-pane dashboards and defined mean-time-to-respond metrics. Vendors therefore position hardware as an on-ramp to lifecycle services, and market leaders publicly report double-digit service growth that exceeds hardware units. This trend spreads the critical infrastructure protection market across suppliers able to couple remote patch orchestration, zero-trust policy tuning, and operator training under fixed-price arrangements, enlarging addressable spend beyond initial equipment roll-outs.


By Security Type:
Cybersecurity Outpaces Physical as IT-OT Boundaries BlurPhysical safety and security retained 52.81% of aggregate 2025 investment, covering fences, scanners, and PSIM dashboards that long defined baseline safeguards across plants and airports. However, convergence pressure is pushing cybersecurity subcategories to outgrow traditional gear, adding 4.01% CAGR as the preferred defensive layer for digital process controls. When identity-centric policies govern turbine access and encrypted engineering files, buyers perceive software upgrades as quicker and less disruptive than concrete walls, accelerating the cybersecurity share of the critical infrastructure protection market size.
Adoption is strongest in network-centric tools that decode IEC 61850 traffic and apply signatureless anomaly models, areas where multi-protocol visibility remains scarce. Identity and access management enters procurement checklists as remote engineers require VPN-less but authenticated pathways to HMIs. Data-at-rest encryption and secure coding standards rise alongside API exposure to third-party analytics, nudging product roadmaps toward DevSecOps integrations. The pivot does not diminish perimeter hardware importance, yet budget weight is plainly tilting to cybersecurity layers that mitigate ransomware and data-tampering threats.
By Deployment Mode:
Cloud Gains as Hybrid Architectures MatureOn-premise configurations generated 65.62% of 2025 revenue because utilities still prize deterministic latency and offline operability. Nonetheless, pilots that isolate control-plane traffic locally while uploading sanitized logs to hyperscale data centers are now recurring line items, and cloud as well as X-as-a-service lines are set to rise at 3.85% CAGR. Vendors package lightweight edge collectors that compress operational telemetry, preserve plant autonomy during outages, and stream metadata to analytic engines, satisfying operators wary of bandwidth costs and data-sovereignty penalties.
These hybrid blueprints grant smaller utilities access to AI-driven detection and instant threat-feed updates without building an in-house SOC. Compliance auditors likewise favor immutable cloud repositories for evidence retention. Consequently, the critical infrastructure protection market share of subscription analytics is widening, and equipment makers increasingly preload cloud connectors and license activation codes into boxes that once shipped with perpetual keys, easing the switch when boards approve opex subscription budgets.
By Vertical:
Telecommunications Surges on 5G and Edge ProliferationEnergy and power captured 28.38% of 2025 revenue by virtue of compulsory grid-hardening and generous stimulus grants. Yet the telecommunications segment is projected to expand at a 3.97% CAGR, outpacing every other vertical as standalone 5G cores, ORAN disaggregation, and micro-edge data centers magnify threat surfaces. The critical infrastructure protection market size directed to telcos is therefore accelerating, driven by mandates to secure transport, core, and radio domains under unified policies.
Carriers are bundling radio-site surveillance, secure orchestration containers, and protocol-aware firewalls in a single contract, rewarding vendors that navigate both IT and OT stacks. Where ORAN introduces IT-grade servers into cell towers, asset inventory and vulnerability scans must now include BMC chips and container registries alongside baseband cards. This convergence compels telecom operators to adopt the same anomaly detection and zero-trust fabrics long championed by utilities, placing them squarely within the broader critical infrastructure protection market focus.
Geography Analysis
North America Critical Infrastructure Protection (CIP) Market
North America maintained 40.47% of 2025 global revenue, bolstered by federal grants, USD 60 billion utility security budgets, and deep vendor ecosystems. Performance-goal deadlines spark purchase orders that intertwine perimeter upgrades with OT-firewall refresh cycles and cloud-delivered threat intelligence. Canada’s Critical Cyber Systems Protection Act extends mandatory audits to telecommunications and energy firms, accelerating deployments of continuous monitoring consoles, while Mexican regulators now require LNG pipeline operators to implement vulnerability management and incident-reporting frameworks. This continental policy alignment sustains volume orders for asset discovery and managed detection subscriptions.
APAC Critical Infrastructure Protection (CIP) Market
Asia-Pacific is forecast to post the quickest 4.05% CAGR through 2031 as China, India, Japan, and South Korea embed security clauses inside smart-city, rail, and manufacturing blueprints. Beijing’s 2025 industrial-control action plan mandates vulnerability scans and network segmentation across steel and petrochemical lines, channeling spend into multi-vendor packet brokers and OT-SOC buildouts. India’s substation directive drives joint tenders pairing domestic EPC firms with global anomaly-detection vendors, while Japan’s updated guidelines elevate supply-chain integrity to board-level KPI status. Regional threat-intelligence sharing through South Korea’s ICS program further encourages automation of detection, producing a rising tide for specialized platforms.
EMEA and South America Critical Infrastructure Protection (CIP) Market
Europe’s NIS2 compliance wave sweeps medium-sized utilities and transport operators into the investment cycle, and Germany’s sector catalog aligns national guidance with IEC 62443, removing ambiguity that once delayed procurement. The Middle East augments its share through sovereign-wealth outlays on port, airport, and desalination security, typified by Saudi Arabia’s USD 2.1 billion allocation to NEOM’s converged surveillance and OT-segmentation package. The United Arab Emirates adds telecom license mandates that cement industrial firewall demand. In contrast, South America and Africa lag due to fragmented rules and constrained budgets, yet Brazil’s baseline requirements and South Africa’s cybercrime statutes sow the seeds for gradual uptake as vendors introduce scalable, pay-as-you-grow service tiers.

Competitive Landscape
Market concentration remains moderate as automation incumbents leverage enormous installed controller bases while cybersecurity specialists innovate on passive discovery and cloud delivery. Siemens, Schneider Electric, Honeywell, ABB, and Rockwell Automation now bundle threat-detection agents directly into PLC firmware upgrades, locking in service renewals and cementing customer stickiness. Simultaneously, pure-plays such as Claroty, Dragos, and Nozomi Networks exploit protocol expertise to secure greenfield smart-grid and edge-telecom deployments, often partnering with hyperscale clouds for rapid rollout.
Strategic moves underscore convergence. Siemens launched its Industrial Security Services through the Xcelerator platform, merging engineering simulation and 24 hour monitoring under one subscription. Schneider Electric finished absorbing AVEVA, enabling asset design data to feed into runtime anomaly engines without format translation. At the firewall layer, Fortinet certified ruggedized appliances to IEC 61850, while Palo Alto Networks added inline Modbus prevention, proving IT vendors can meet OT latency constraints. Defense contractors Lockheed Martin and BAE Systems continue to win classified infrastructure bundles that fuse radar perimeter sensors, industrial SOC staffing, and threat-intelligence funnels, trading on intelligence clearances rather than pure technology differentiation.
Competitive advantage now hinges on automated asset inventory, encrypted protocol inspection, and IEC 62443 certification pipelines. Claroty secured a U.S. patent for continuous asset discovery in 2025, raising the bar for intellectual property protection. Dragos integrated its threat feed with Microsoft Azure Sentinel, lowering entry cost for utilities lacking on-premise SOC racks. Vendors also compete on services elasticity, offering modular MDR tiers that scale from ten-substation pilots to nationwide telco footprints without revisiting procurement. White-space persists in small water utilities and regional airports, where turnkey subscription bundles challenge traditional capex modalities and expand the reachable critical infrastructure protection market share of managed service providers.
Critical Infrastructure Protection (CIP) Industry Leaders
Bae Systems PLC
Honeywell International Inc.
Airbus SE
Hexagon AB
IBM Corporation
- *Disclaimer: Major Players sorted in no particular order
Critical Infrastructure Protection (CIP) Market Companies Covered in this Report
- ABB Ltd.
- Airbus SE
- BAE Systems PLC
- Booz Allen Hamilton
- Claroty Ltd.
- Cisco Systems Inc.
- Darktrace PLC
- Dragos Inc.
- Fortinet Inc.
- General Dynamics Corporation
- Hexagon AB
- Honeywell International Inc.
- IBM Corporation
- Johnson Controls International
- Kaspersky Lab Inc.
- Lockheed Martin Corporation
- Northrop Grumman Corporation
- Palo Alto Networks Inc.
- Raytheon Technologies Corporation
- Schneider Electric SE
- Siemens AG
- Thales Group
- Trellix
- Waterfall Security Solutions Ltd.

Recent Industry Developments in Critical Infrastructure Protection (CIP) Market
- February 2026: Siemens launched Industrial Security Services that couple on-premise sensors with cloud analytics to protect PLCs and SCADA networks.
- January 2026: Palo Alto Networks expanded its OT suite with inline prevention for Modbus and DNP3 traffic after a year-long pilot among U.S. electric cooperatives.
- December 2025: Honeywell committed USD 180 million to enlarge its Bengaluru cybersecurity R&D hub, adding 400 engineers focused on industrial threat detection.
- November 2025: Fortinet shipped a ruggedized next-generation firewall certified for IEC 61850 substations, securing first deployments in Germany and Australia.


Global Critical Infrastructure Protection (CIP) Market Report Scope
Critical infrastructure is the vigilance and response to serious incidents that involve the key infrastructure of a region, nation, or organization. The rising need to protect sensitive infrastructures from attacks is leading to the adoption of critical infrastructure protection solutions. Critical infrastructure protection provides controls to stabilize the device, secure communication between devices, and manage and monitor the connected devices. It is adapted to control the threat of cybercrime and physical tampering with the key infrastructure.
The Critical Infrastructure Protection Market Report is Segmented by Component (Solutions, Services), Security Type (Physical Safety and Security, Cybersecurity), Deployment Mode (On-Premise, Cloud and X-as-a-Service), Vertical (Energy and Power, BFSI, Transportation, Telecommunications, Government and Defense, Chemical and Manufacturing, Healthcare and Life Sciences, Sensitive Infrastructure and Data Centers), and Geography (North America, South America, Europe, Asia-Pacific, Middle East and Africa). The Market Forecasts are Provided in Terms of Value (USD).
Segmentation Overview
By Component
| Solutions |
| Services |
By Security Type
| Physical Safety and Security | Screening and Scanning | Video Surveillance |
| Access Control | ||
| PSIM and PIAM | ||
| CBRNE Detection | ||
| Cybersecurity | Network Security | |
| SCADA / OT Security | ||
| Identity and Access Management | ||
| Data and Application Security | ||
| Secure Communications |
By Deployment Mode
| On-Premise |
| Cloud / X-as-a-Service |
By Vertical
| Energy and Power |
| BFSI |
| Transportation |
| Telecommunications |
| Government and Defense |
| Chemical and Manufacturing |
| Healthcare and Life Sciences |
| Sensitive Infrastructure and Data Centers |
By Geography
| North America | United States | |
| Canada | ||
| Mexico | ||
| South America | Brazil | |
| Argentina | ||
| Rest of South America | ||
| Europe | United Kingdom | |
| Germany | ||
| France | ||
| Italy | ||
| Spain | ||
| Rest of Europe | ||
| Asia-Pacific | China | |
| Japan | ||
| India | ||
| South Korea | ||
| New Zealand | ||
| Rest of Asia-Pacific | ||
| Middle East and Africa | Middle East | GCC |
| Turkey | ||
| Israel | ||
| Rest of Middle East | ||
| Africa | South Africa | |
| Nigeria | ||
| Egypt | ||
| Rest of Africa | ||
| By Component | Solutions | ||
| Services | |||
| By Security Type | Physical Safety and Security | Screening and Scanning | Video Surveillance |
| Access Control | |||
| PSIM and PIAM | |||
| CBRNE Detection | |||
| Cybersecurity | Network Security | ||
| SCADA / OT Security | |||
| Identity and Access Management | |||
| Data and Application Security | |||
| Secure Communications | |||
| By Deployment Mode | On-Premise | ||
| Cloud / X-as-a-Service | |||
| By Vertical | Energy and Power | ||
| BFSI | |||
| Transportation | |||
| Telecommunications | |||
| Government and Defense | |||
| Chemical and Manufacturing | |||
| Healthcare and Life Sciences | |||
| Sensitive Infrastructure and Data Centers | |||
| By Geography | North America | United States | |
| Canada | |||
| Mexico | |||
| South America | Brazil | ||
| Argentina | |||
| Rest of South America | |||
| Europe | United Kingdom | ||
| Germany | |||
| France | |||
| Italy | |||
| Spain | |||
| Rest of Europe | |||
| Asia-Pacific | China | ||
| Japan | |||
| India | |||
| South Korea | |||
| New Zealand | |||
| Rest of Asia-Pacific | |||
| Middle East and Africa | Middle East | GCC | |
| Turkey | |||
| Israel | |||
| Rest of Middle East | |||
| Africa | South Africa | ||
| Nigeria | |||
| Egypt | |||
| Rest of Africa | |||


Key Questions Answered in the Report
What is the current value of the critical infrastructure protection market?
The market stands at USD 158.73 billion in 2026 and is projected to reach USD 190.53 billion by 2031.
Which segment is growing fastest within this space?
Telecommunications is forecast to register the quickest 3.97% CAGR thanks to 5G core and edge roll-outs.
How are regulations influencing buying decisions?
Mandates such as NIS2 in Europe and cross-sector goals in the United States require zero-trust architectures and continuous monitoring, accelerating procurement.
Which region offers the best growth prospects to 2031?
Asia-Pacific is expected to expand at a 4.05% CAGR driven by smart-city, smart-grid, and industrial automation programs.
What technologies differentiate leading vendors?
Passive asset discovery, protocol-aware anomaly detection, cloud-delivered threat intelligence, and IEC 62443 certified products underpin competitive advantage.
Page last updated on:


