Contrast Media Market Size and Share
Market Overview
| Study Period | 2020 - 2031 |
|---|---|
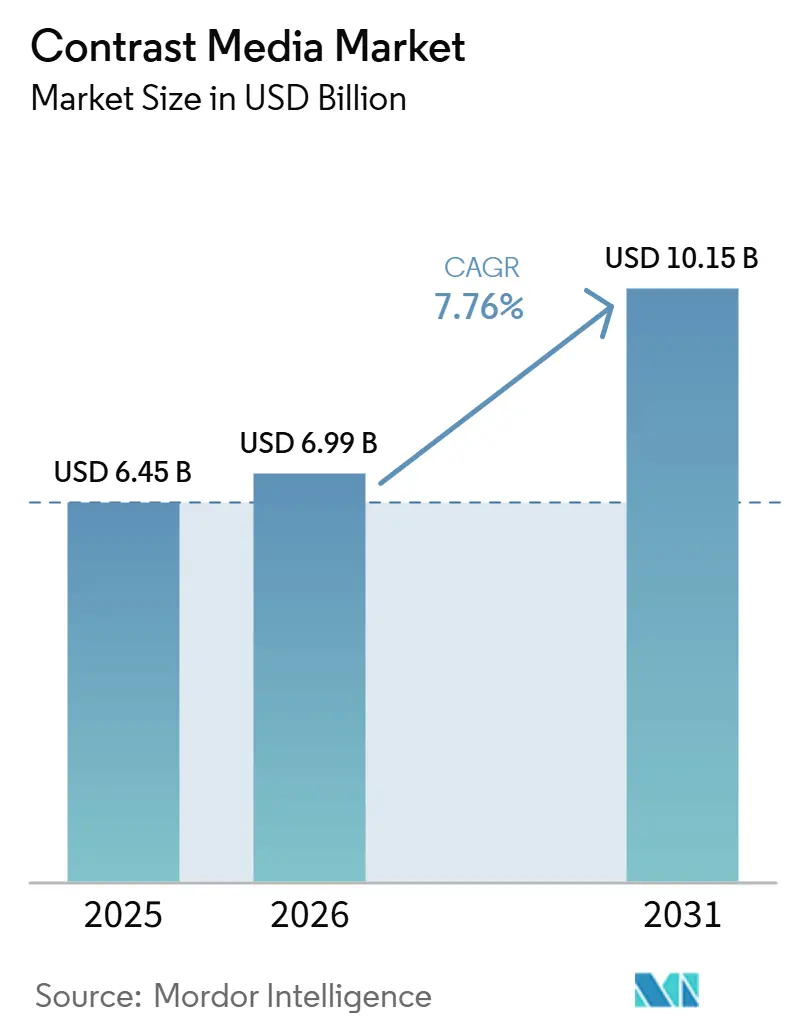
| Market Size (2026) | USD 6.99 Billion |
| Market Size (2031) | USD 10.15 Billion |
| Growth Rate (2026 - 2031) | 7.76% CAGR |
| Fastest Growing Market | Asia-Pacific |
| Largest Market | North America |
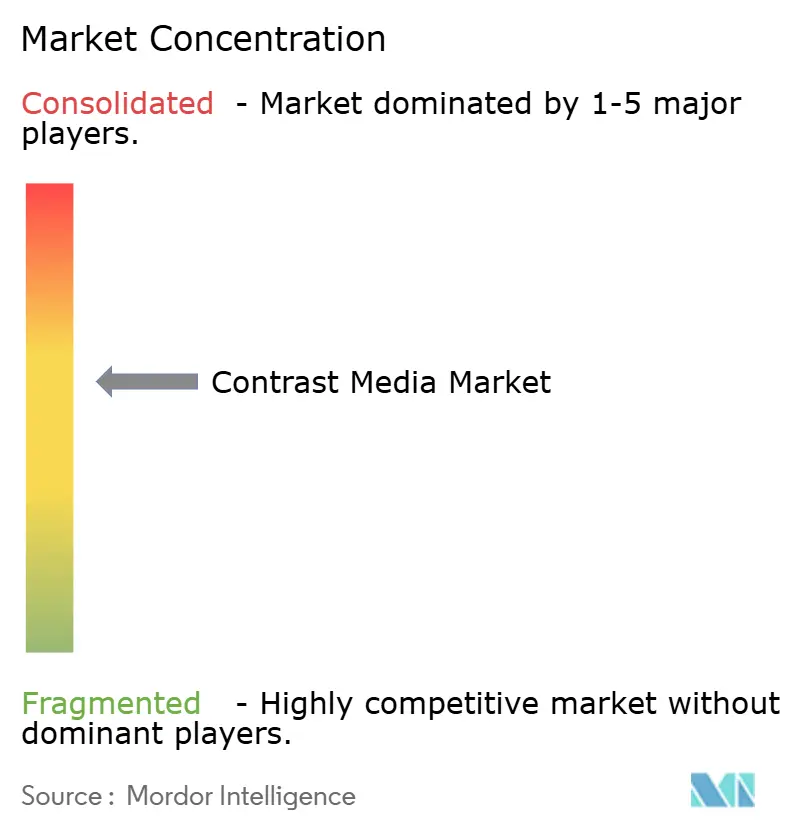
| Market Concentration | Medium |
Major Players *Disclaimer: Major Players sorted in no particular order Image © Mordor Intelligence. Reuse requires attribution under CC BY 4.0. | |
Contrast Media Market Analysis by Mordor Intelligence
The Contrast Media Market size is expected to grow from USD 6.45 billion in 2025 to USD 6.99 billion in 2026 and is forecast to reach USD 10.15 billion by 2031 at 7.76% CAGR over 2026-2031.
Continued growth is tied to the worldwide rise in chronic illnesses, faster regulatory clearance of low-risk formulations, and the spread of artificial-intelligence injectors that trim waste without harming diagnostic quality. Iodinated agents keep the largest position because computed tomography (CT) scanners handled more than 100 million procedures in the United States in 2024. The fast-growing corner is microbubble and other emerging agents, expanding as ultrasound imaging is adopted in point-of-care settings where CT capacity is limited. Contract bundling between providers and vendors, along with rising adoption of photon-counting CT and dose-tracking software, is reshaping volume and pricing dynamics across the contrast media market.
Key Report Takeaways
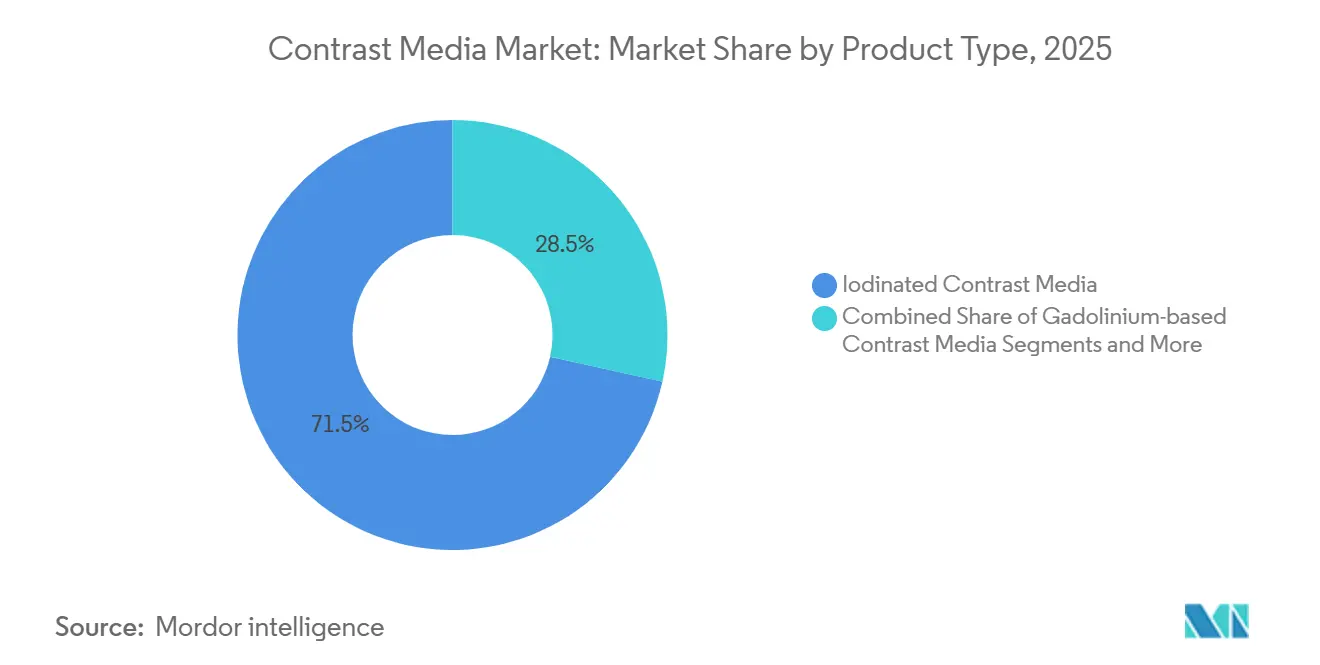
- By product type, iodinated agents held 71.52% of the contrast media market share in 2025, while microbubble and emerging agents are forecast to grow at a 10.23% CAGR through 2031.
- By modality, X-ray and CT accounted for 58.35% of the contrast media market size in 2025, and ultrasound is set to climb at a 9.14% CAGR to 2031.
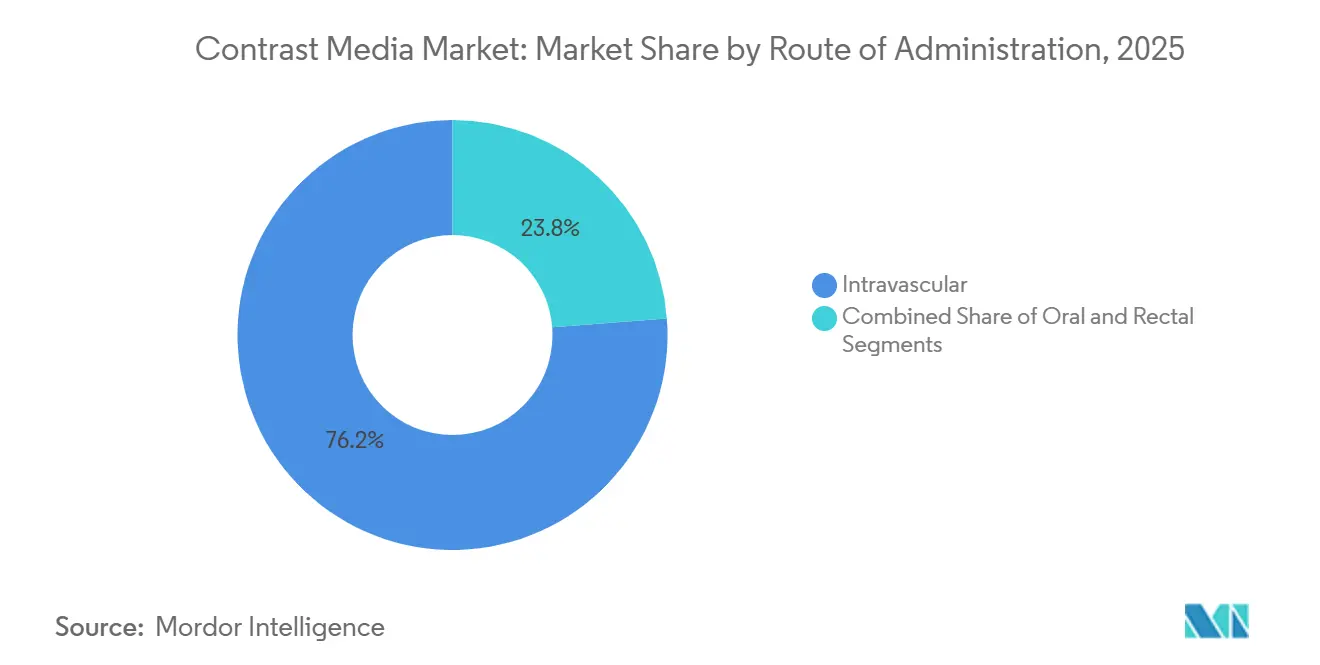
- By route of administration, intravascular contrast maintained 76.23% share of the contrast media market in 2025; rectal administration shows the highest projected CAGR at 8.47% through 2031.
- By application, cardiovascular imaging led with 31.42% of the contrast media market in 2025, while oncology imaging is forecast to expand at 10.92% CAGR to 2031.
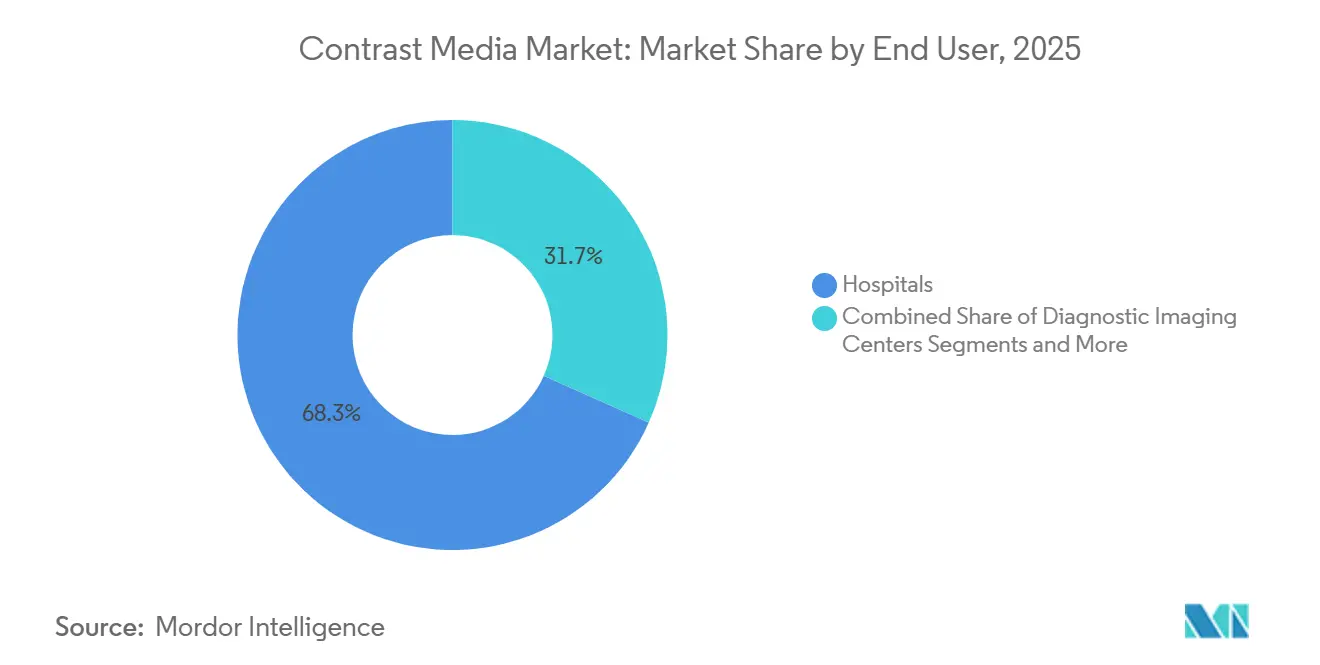
- By end user, hospitals captured 68.32% of demand in 2025; diagnostic imaging centers are advancing at a 9.57% CAGR through 2031.
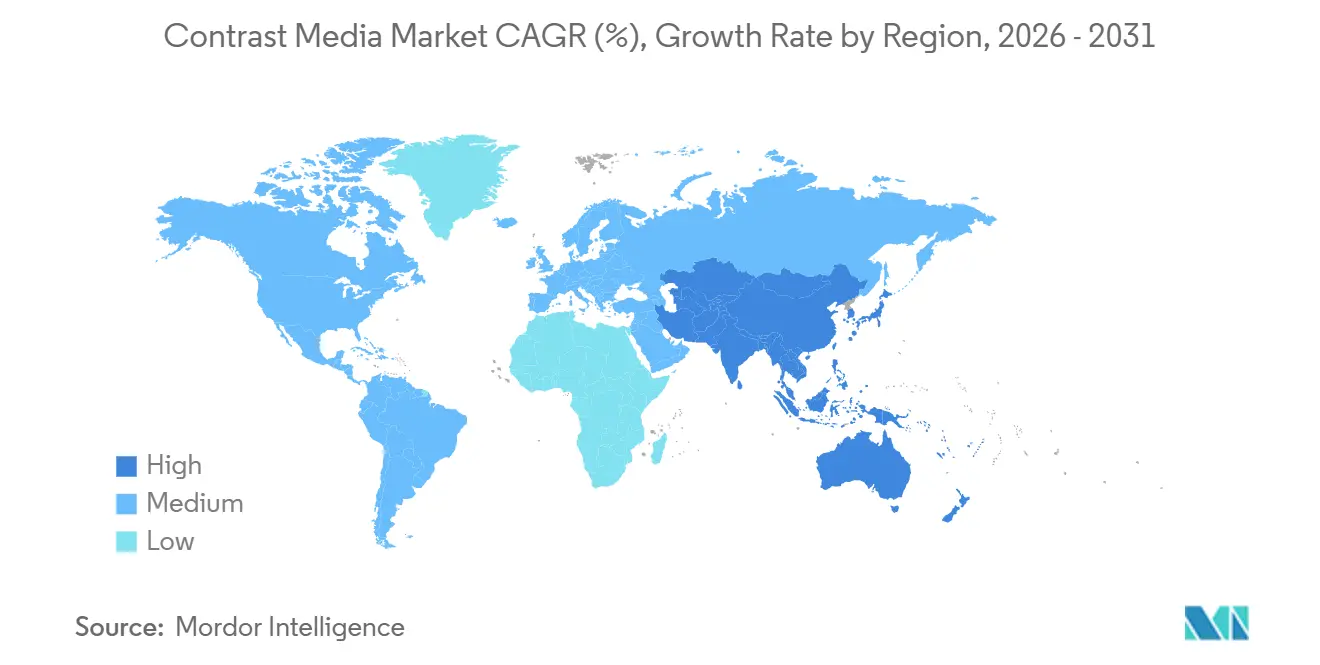
- By geography, North America commanded 38.66% of revenue in 2025, yet Asia-Pacific is forecast to grow fastest at a 9.38% CAGR to 2031.
Note: Market size and forecast figures in this report are generated using Mordor Intelligence’s proprietary estimation framework, updated with the latest available data and insights as of January 2026.
Global Contrast Media Market Trends and Insights
Drivers Impact Analysis*
| Driver | (~) % Impact on CAGR Forecast | Geographic Relevance | Impact Timeline |
|---|---|---|---|
| Rising prevalence of chronic diseases (cancer & cardiovascular disorders) | +1.8% | Global, with highest intensity in North America and Europe | Long term (≥ 4 years) |
| Growing global diagnostic imaging procedure volumes | +1.5% | Global, with accelerated growth in Asia-Pacific and Middle East | Medium term (2-4 years) |
| Technological advances in high-resolution CT & MRI scanners | +1.2% | North America, Europe, and urban Asia-Pacific hubs | Medium term (2-4 years) |
| Regulatory approvals of safer low-/iso-osmolar agents | +0.9% | Global, led by FDA and EMA jurisdictions | Short term (≤ 2 years) |
| AI-guided injector protocols boosting dose optimization | +0.7% | North America and select European markets | Short term (≤ 2 years) |
| Emergence of renal-safe iron-oxide nanoparticle agents | +0.6% | Europe and North America, with pilot programs in Japan | Long term (≥ 4 years) |
| Source: Mordor Intelligence | |||


Rising Prevalence of Chronic Diseases Drives Imaging Demand
Global cancer incidence reached 20 million new cases in 2024, while cardiovascular disease caused 18.6 million deaths.[1]World Health Organization, Global Cancer Burden Growing, Amidst Mounting Need for Services,” World Health Organization, who.intSerial contrast-enhanced imaging is now embedded in oncology and cardiology guidelines, resulting in multiple scans per patient each year. Coronary CT angiography replaces invasive catheterization in 40% of stable angina cases, consuming 80–120 milliliters of iodinated agent per study. Populations in Japan and Germany each have more than one-fifth of citizens over age 65, which boosts procedure volumes. Even when per-scan volumes decline, total milliliter demand rises because the number of examinations grows faster than dose reductions.
Growing Global Diagnostic Imaging Procedure Volumes
Radiology departments performed 5.2 billion imaging examinations worldwide in 2024, up from 4.8 billion one year earlier. China extended reimbursement for contrast-enhanced ultrasound, opening access for 300 million rural residents, and India added 15,000 imaging centers through Ayushman Bharat by 2025. Medicare Advantage plans in the United States cover annual lung CT screening for 14 million high-risk smokers, while Gulf Cooperation Council nations increased contrast imports by 22% in 2024 to meet medical-tourism demand.
Technological Advances in High-Resolution CT and MRI Scanners
Photon-counting CT systems introduced in 2024 achieve sub-0.2-millimeter resolution and allow 30–40% lower contrast dosing without harming image quality.[2]Siemens Healthineers,Siemens Healthineers Expands Photon-Counting CT Portfolio,” Siemens Healthineers Press Release, siemens-healthineers.com GE HealthCare’s 3-tesla MRI with compressed-sensing cuts scan time by half, boosting throughput. Canon’s deep-learning reconstruction software reduces radiation by 25%, enabling lower contrast volumes in pediatric and renal-impaired cases. Although unit demand per scan falls, easier and safer imaging expands indications, lifting overall procedure counts and supporting the contrast media market.
Regulatory Approvals of Safer Low- or Iso-Osmolar Agents
The FDA cleared Bracco’s iso-osmolar iodixanol for pediatric cardiac catheterization in 2025. The European Medicines Agency granted conditional approval for Guerbet’s macrocyclic gadolinium agent in 2023.[3]Guerbet Communications Team, “Guerbet Announces Marketing Authorisation Approval of Elucirem (Gadopiclenol) in the European Union,” Guerbet, guerbet.com Japan fast-tracked a low-osmolar iopamidol variant in 2024. Safety-focused formulary committees reward these improvements with 10–15% price premiums, shortening the life of higher-risk ionic agents still used in about 8% of doses.
Restraints Impact Analysis*
| Restraint | (~) % Impact on CAGR Forecast | Geographic Relevance | Impact Timeline |
|---|---|---|---|
| Gadolinium deposition & contrast-induced nephropathy concerns | -0.8% | Global, with heightened scrutiny in North America and Europe | Medium term (2-4 years) |
| High capital cost of advanced imaging equipment & agents | -0.6% | Emerging markets in Asia-Pacific, Middle East & Africa, and South America | Long term (≥ 4 years) |
| Iodine feedstock price volatility & supply disruptions | -0.5% | Global, with acute impact in regions dependent on Chilean iodine exports | Short term (≤ 2 years) |
| Rise of non-contrast imaging modalities (spectral CT, deep-learning reconstruction) | -0.7% | North America and Europe, with gradual adoption in urban Asia-Pacific centers | Medium term (2-4 years) |
| Source: Mordor Intelligence | |||
Gadolinium Deposition and Contrast-Induced Nephropathy Concerns
Autopsy findings published in 2024 revealed gadolinium deposits in brain tissue, prompting the FDA to demand label changes. Utilization of gadolinium-based agents fell 12% for non-critical cases. Iodinated agents trigger acute kidney injury in up to 5% of high-risk patients, leading to mandatory renal screening that delays or cancels 8% of procedures. European guidelines now recommend prophylactic hydration, adding USD 80–150 per case and discouraging borderline orders. U.S. malpractice insurers raised premiums for radiologists with above-average adverse events, further tightening use.
High Capital Cost of Advanced Imaging Equipment and Agents
Photon-counting CT systems cost up to USD 3 million, double conventional models, which strains budgets of community hospitals. Only 22% of India’s district hospitals have CT capability, often relying on refurbished units lacking automated injectors. Premium iso-osmolar agents cost 40–60% more than ionic formulations, yet reimbursements in many emerging markets remain pegged to legacy pricing. Brazil’s public system pays USD 12 per contrast-CT, below the USD 18–22 cost of premium agents. Leasing and pay-per-use schemes are emerging but cover less than 15% of installed base in low-income regions.
*Our forecasts treat driver/restraint impacts as directional, not additive. The impact forecasts reflect baseline growth, mix effects, and variable interactions.
Segment Analysis
By Product Type: Iodinated Agents Sustain Leadership
Iodinated agents represented 71.52% of the contrast media market in 2025, confirming their primacy across CT angiography, urography, and gastrointestinal studies. Non-ionic formulations command the segment because low osmolality limits injection discomfort and adverse reactions. Barium compounds remain useful in fluoroscopic esophageal and colon exams, yet their share erodes as CT colonography adoption rises. Gadolinium agents remain indispensable for brain and spine imaging, though deposition concerns suppress discretionary use. The fastest expansion belongs to microbubble and emerging agents, which post a 10.23% CAGR through 2031 as ultrasound gains favoritism in resource-constrained settings.
Microbubble agents thrive in point-of-care echocardiography, where portable ultrasound detects wall-motion abnormalities without radiation. Lantheus’s Definity enjoyed broader adoption in 2024 when stress echocardiography started rivaling nuclear perfusion imaging in accuracy. Ionic iodinated products are being phased out in high-income nations but still cover 12% of demand in price-sensitive areas. Nanoparticle iron-oxide agents could reshape MRI economics by serving the 15 million renal-impaired patients currently left without safe options, although scale-up challenges persist.


By Modality: CT Leads, Ultrasound Surges
X-ray and CT accounted for 58.35% of the contrast media market in 2025, grounded in an installed base of 70,000 CT scanners worldwide. MRI holds roughly 30% share, and ultrasound is growing at a 9.14% CAGR. Portable ultrasound devices now sell for less than USD 5,000, making contrast-enhanced ultrasound feasible in outpatient and rural clinics. Ultrasound’s rise in hepatology parallels new guidelines that endorse it for liver lesion characterization, reducing costs and removing nephrotoxicity risk.
Cardiology benefits as stress echocardiography with microbubbles reaches 89% diagnostic accuracy for coronary disease. MRI growth faces safety questions but remains vital where soft-tissue contrast is critical. Fluoroscopic volumes shrink as cross-sectional imaging supersedes projection radiography. Vendors with portfolios spanning all three modalities are better insulated against shifts in use patterns, while single-modality suppliers experience margin pressure.
By Route of Administration: Intravascular Dominates, Rectal Rises
Intravascular injection held 76.23% of demand in 2025, mirroring the dominance of angiographic and perfusion studies. Rectal administration is the fastest climber at an 8.47% CAGR through 2031 as lower colorectal screening age expands the eligible population by 20 million adults in the United States alone. Oral contrast holds mid-teen share but is declining because water-based alternatives improve bowel wall visualization and patient comfort.
Japan’s reimbursement expansion for CT colonography in 2024 fueled a 35% jump in procedure volumes, adding momentum to rectal contrast use. Intravascular growth lags the overall contrast media market because saturation in developed regions and non-contrast technologies curb per-scan volume. Still, newer functional imaging protocols, such as perfusion CT in stroke triage, keep intravenous contrast indispensable.
By Application: Cardiovascular Leads, Oncology Accelerates
Cardiovascular imaging retained 31.42% of demand in 2025, with coronary CT angiography now first line for stable chest pain in nearly half of cases across North America and Europe. Oncology scans grow faster at a 10.92% CAGR as precision therapies require baseline and serial assessments every 8–12 weeks. Neurological imaging maintains mid-teen share, supported by advanced MRI sequences that complement gadolinium use.
Checkpoint inhibitor therapy necessitates contrast-enhanced monitoring for pseudoprogression. Musculoskeletal imaging expands only modestly, as many joints are adequately assessed without contrast. Nephrological imaging creates demand for iso-osmolar agents despite added nephrotoxicity precautions. If current trajectories hold, oncology could overtake cardiovascular volumes before 2030.
By End User: Hospitals Prevail, Imaging Centers Expand
Hospitals absorbed 68.32% of contrast consumption in 2025 because inpatient and emergency settings require complex, high-dose procedures. Imaging centers advance at a 9.57% CAGR, helped by private-equity funding that opened 340 new outpatient sites in 2024. These centers draw volumes from hospitals by offering lower copays and shorter wait times, especially for elective CT and MRI.
Medicare reimburses freestanding facilities 40–50% less than hospital outpatient departments, encouraging payer steering. RadNet, the largest U.S. chain, grew volumes 18% in 2024 through insurer partnerships that guarantee referrals. Hospitals still control trauma, stroke, and interventional cardiology imaging, yet decentralized care will continue to chip away at their share.
Geography Analysis
North America accounted for 38.66% of revenue in 2025, supported by the highest per-capita imaging rates and reimbursement policies that classify contrast as a pass-through expense. The United States alone conducts an average of 1.2 contrast-enhanced studies per resident each year, while Canada’s single-payer system constrains usage through formulary limits. Mexico, though smaller, is rising as private insurance spreads and new hospitals open in major cities.
Asia-Pacific is set to post a 9.38% CAGR through 2031, reflecting large-scale government investments. China allocated USD 4.2 billion in 2024 to install CT and MRI in county hospitals, targeting 90% coverage by 2027. India’s public scheme expanded reimbursements for CT angiography, unlocking a massive population base previously limited to invasive tests. Japan’s mature market stays stable, but high per-capita consumption endures due to cultural preference for comprehensive checkups. Australia and South Korea embrace photon-counting CT and AI injectors, raising efficiency and keeping adoption at the forefront.
Europe shows mixed dynamics. Germany pairs high volumes with strict safety standards favoring macrocyclic gadolinium despite its price premium. France pushed through a 12% price cut for iodinated agents, squeezing supplier margins. The UK National Health Service restricts gadolinium to oncology and neurology, leading to 30% lower per-capita use than Germany. Italy and Spain broadened outpatient capacity by adding 140 centers in 2024. Middle East and Africa enjoy above-average growth as Gulf nations build medical-tourism hubs, while South America wrestles with affordability even as cancer-screening initiatives raise iodinated contrast volumes.

Competitive Landscape
The top five suppliers include Bayer, GE HealthCare, Bracco, Guerbet, and Siemens Healthineers, and together they hold a significant share of the contrast media market. Each leader pairs agents with injectors, software, and pharmacovigilance to lock in customers. GE’s Optima injector feeds data into predictive-maintenance algorithms, saving downtime and reinforcing equipment sales. Bayer’s Radimetrics platform ties payments to quality metrics such as repeat-scan rates under 2%.
Chinese entrants like Hengrui Medicine widen global price competition by supplying non-ionic iodinated agents at discounts of 30–40%, claiming 22% share in Indonesia and Vietnam in 2024. Biotechnology firms pursue renal-safe nanoparticle agents that bypass kidney excretion, opening access to patients who currently receive no contrast. Suppliers must navigate dose-reduction trends, stock-outs tied to iodine volatility, and heightened safety scrutiny, all while investing in service bundles that offset shrinking per-procedure volumes.
Contrast Media Industry Leaders
Bayer AG
GE HealthCare
Bracco Imaging S.p.A
Guerbet Group
Lantheus Medical Imaging Inc.
- *Disclaimer: Major Players sorted in no particular order

Recent Industry Developments
- November 2025: Bracco Diagnostics won FDA approval for using the Max 3 syringeless injector with VUEWAY gadopiclenol imaging bulk packages, marking the first syringeless MRI injector on the U.S. market.
- August 2025: Bayer announced FDA acceptance of its new gadoquatrane contrast agent NDA for MRI of the central nervous system and body.
- January 2025: GE HealthCare committed USD 138 million to expand its Cork, Ireland contrast-media plant, targeting 25 million additional patient doses per year by 2027.


Research Methodology Framework and Report Scope
Market Definitions and Key Coverage
We, at Mordor Intelligence, define the contrast media market as the worldwide sales value of iodinated, gadolinium-based, barium-based, and micro-bubble agents that clinicians administer to improve visualization in X-ray/CT, MRI, and ultrasound scans performed on human patients across hospitals, diagnostic centers, and ambulatory sites.
Scope exclusions include injectors, tubing, syringes, radiopharmaceutical tracers, and any veterinary use, which are outside this study.
Segmentation Overview
- By Product Type
- Iodinated Contrast Media
- Ionic Iodinated
- Non-ionic Iodinated
- Barium-based Contrast Media
- Gadolinium-based Contrast Media
- Microbubble & Emerging Agents
- Iodinated Contrast Media
- By Modality
- X-ray / CT
- MRI
- Ultrasound
- By Route of Administration
- Intravascular
- Oral
- Rectal
- By Application / Indication
- Cardiovascular Disorders
- Oncology
- Neurological Disorders
- Gastrointestinal Disorders
- Musculoskeletal Disorders
- Nephrological Disorders
- By End User
- Hospitals
- Diagnostic Imaging Centers
- Clinics & Ambulatory Surgery Centers
- Research & Academic Institutes
- By Geography
- North America
- United States
- Canada
- Mexico
- Europe
- Germany
- France
- United Kingdom
- Italy
- Spain
- Rest of Europe
- Asia-Pacific
- China
- Japan
- India
- South Korea
- Australia
- Rest of Asia-Pacific
- Middle East & Africa
- GCC
- South Africa
- Rest of Middle East & Africa
- South America
- Brazil
- Argentina
- Rest of South America
- North America
Detailed Research Methodology and Data Validation
Primary Research
To verify desk findings, we interviewed radiologists, hospital pharmacists, bulk API suppliers, and regional procurement leads across North America, Europe, China, India, and Brazil. These conversations tested adoption assumptions for low-osmolar iodinated agents, emerging micro-bubble approvals, and country-level reimbursement trends, giving us clear checkpoints before the model was frozen.
Desk Research
Our analysts first collate publicly available fundamentals from tier-1 statistics such as WHO procedure rates, OECD Health Data, US FDA recall logs, and Eurostat trade codes that track bulk iodine and gadolinium salts. We then layer evidence from clinical society white papers issued by the American College of Radiology, Radiological Society of North America, and the European Society of Radiology, which clarify usage protocols and dosage shifts. Company 10-Ks, investor decks, and hospital purchasing tenders provide selling prices and brand mix patterns; finally, subscriber databases, including D&B Hoovers for producer revenues and Dow Jones Factiva for shipment news, anchor competitive shares. The sources cited above are illustrative; many additional publications were reviewed before figures were locked.
Market-Sizing & Forecasting
Our base year demand pool originates from a top-down reconstruction of global imaging procedure volumes, adjusted by contrast utilization rates and average selling price (ASP) ladders. Supplier roll-ups and channel checks serve as selective bottom-up counterweights that let us tweak regional outliers. Key variables like CT and MRI scan counts, the shift toward non-ionic formulations, macrocyclic penetration, ASP erosion curves, and chronic disease incidence feed a multivariate regression that projects to 2030. Data gaps, for example, private clinic volumes, are bridged with weighted proxies derived from primary interviews.
Data Validation & Update Cycle
Before sign-off, senior analysts repeat variance and sense-check loops, contrasting model outputs with customs codes, hospital buying indices, and quarterly earnings calls. Reports refresh each year; interim updates trigger when recalls, major approvals, or currency swings alter the demand landscape.
Why Mordor's Contrast Media Baseline Commands Reliability
Published estimates often diverge because firms select different product baskets, price nets, and refresh rhythms.
Key gap drivers here include whether injectors or radiopharmaceuticals are bundled, the base year chosen, ASP deflator choices, and the cadence at which late-breaking approvals are folded back into models.
Benchmark comparison
| Market Size | Anonymized source | Primary gap driver |
|---|---|---|
| USD 6.20 B (2025) | Mordor Intelligence | |
| USD 7.20 B (2024) | Global Consultancy A | bundles injectors and uses list prices without regional discounts |
| USD 6.77 B (2024) | Global Consultancy B | excludes ultrasound agents and freezes exchange rates at 2023 averages |
| USD 6.30 B (2023) | Trade Journal C | earlier base year and conservative scan-volume growth assumptions |
The comparison shows how our disciplined scope choices, rolling currency updates, and dual-path validation deliver a balanced, transparent baseline that decision-makers can trace back to clear variables and repeatable steps.


Key Questions Answered in the Report
What growth rate is expected for the contrast media market to 2031?
The global contrast media market is projected to expand at a 7.76% CAGR, rising from USD 6.99 billion in 2026 to USD 10.15 billion in 2031.
Which product category holds the largest share today?
Iodinated agents led with 71.52% share in 2025 due to widespread CT use.
Why are microbubble agents growing the fastest?
They support contrast-enhanced ultrasound in point-of-care settings, generating a 10.23% projected CAGR through 2031 without radiation exposure.
Which region is forecast to grow quickest?
Asia-Pacific is set to lead with a 9.38% CAGR as China and India build radiology capacity.
How does AI affect contrast usage?
AI-guided injectors cut per-exam volumes by about 18% yet lift overall procedure numbers through efficiency gains, reshaping supplier revenue models.
What challenge do suppliers face with iodine sourcing?
Dependence on Chile and Japan creates price swings and supply risks that can raise production costs and delay contracts.
Page last updated on:


