
Market Overview
| Study Period | 2021 - 2031 |
|---|---|
| Market Size (2026) | USD 8.46 Billion |
| Market Size (2031) | USD 11.08 Billion |
| Growth Rate (2026 - 2031) | 5.55 % |
| Fastest Growing Market | Asia-Pacific |
| Largest Market | Asia Pacific |
| Market Concentration | Medium |
Major Players *Disclaimer: Major Players sorted in no particular order Image © Mordor Intelligence. Reuse requires attribution under CC BY 4.0. | |
Centrifugal Compressor Market Analysis by Mordor Intelligence
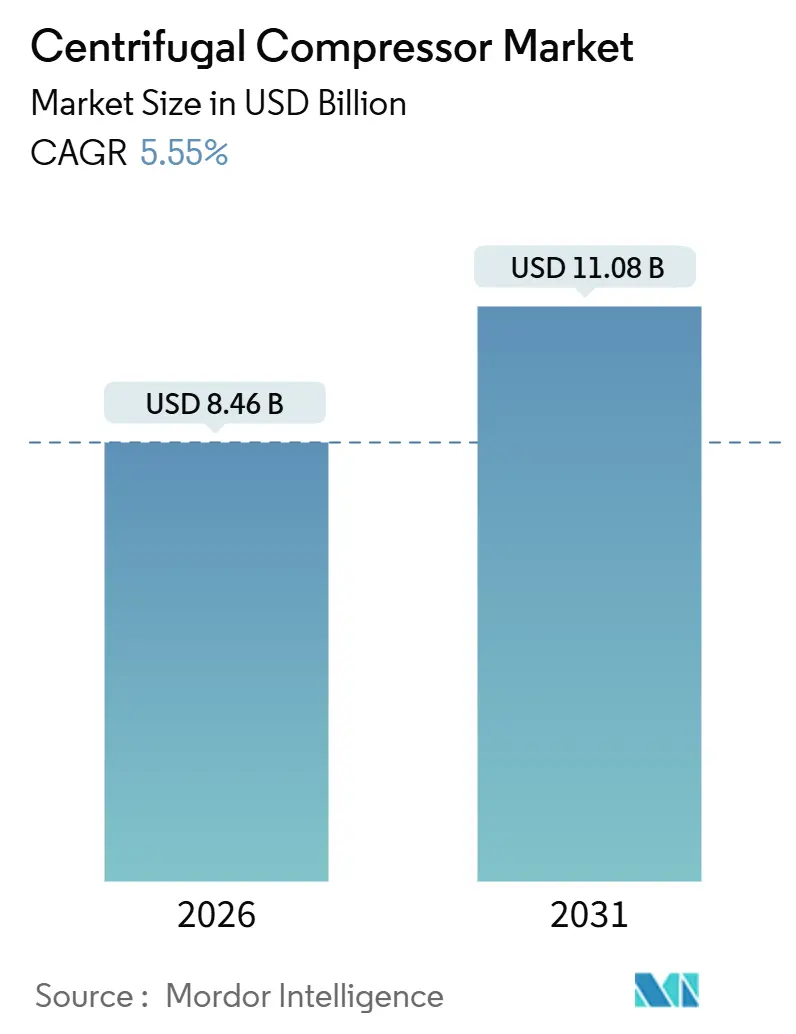
The Centrifugal Compressor Market size is estimated at USD 8.46 billion in 2026, and is expected to reach USD 11.08 billion by 2031, at a CAGR of 5.55% during the forecast period (2026-2031).
The centrifugal compressor market is benefiting from persistent demand in natural-gas transmission, LNG liquefaction, and CCGT power generation, applications that reward high-volume, continuous-duty compression. Growth is less about new greenfield plants and more about stricter energy-efficiency retrofits in Europe and China, the build-out of hydrogen hubs that need oil-free trains, and predictive-maintenance platforms that shorten overhaul cycles.[1] Asia-Pacific remains pivotal as China’s petrochemical mega-complexes and India’s offshore gas projects keep capacity additions brisk, while North America’s pipeline expansions and LNG export terminals underpin equipment replacement orders.[2] Technology preferences are also shifting: integrally geared architectures are expanding as operators prioritize smaller footprints in modular LNG, and single-stage units are gaining traction in data-center cooling and food processing, where lower pressure ratios suffice.
Key Report Takeaways
- By compressor design, straight-through architectures commanded 88.4% of centrifugal compressor market share in 2025; integrally geared units are projected to grow at a 7.3% CAGR through 2031.
- By stage, multi-stage units held 60.6% of the centrifugal compressor market size in 2025, while single-stage designs are expected to advance at a 6.8% CAGR.
- By cooling method, air-cooled systems captured 69.1% revenue share in 2025; water-cooled variants are forecast to expand at a 6.5% CAGR through 2031.
- By end-user, oil and gas represented 37.5% of 2025 demand, yet petrochemicals and chemicals will post the fastest 7.0% CAGR to 2031.
- By geography, Asia-Pacific led with 38.3% revenue in 2025; the region is anticipated to grow at a 6.2% CAGR through 2031.
Note: Market size and forecast figures in this report are generated using Mordor Intelligence’s proprietary estimation framework, updated with the latest available data and insights as of January 2026.
Market Trends and Insights
Drivers Impact Analysis of Centrifugal Compressor Market*
| Driver | (~) % Impact on CAGR Forecast | Geographic Relevance | Impact Timeline |
|---|---|---|---|
| Surging natural-gas pipeline build-outs | 1.2% | North America, Middle East, Asia-Pacific | Medium term (2-4 years) |
| LNG liquefaction & regas capacity additions | 1.5% | Global, with concentration in U.S. Gulf Coast, Qatar, Australia | Long term (≥ 4 years) |
| Industrial CCGT capacity expansion | 0.9% | Asia-Pacific, North America, Europe | Medium term (2-4 years) |
| Stricter energy-efficiency retrofits | 0.7% | Europe, North America, China | Short term (≤ 2 years) |
| Hydrogen hub demand for oil-free compression | 0.6% | Europe, North America, Japan | Long term (≥ 4 years) |
| Predictive-maintenance led replacement cycles | 0.5% | Global | Short term (≤ 2 years) |
| Source: Mordor Intelligence | |||
Surging Natural-Gas Pipeline Build-Outs
North American projects are moving from mega trunk lines toward laterals that link Permian and Appalachian fields to Gulf Coast LNG terminals. Seven U.S. pipeline approvals in 2024 alone added 3.2 bcf/d of capacity, each requiring multiple centrifugal compressor stations.[3] Kinder Morgan’s Texas-Louisiana line deployed six 22,500-horsepower units able to handle fluctuating inlet pressures without surge losses. In Saudi Arabia, Phase IV of the Master Gas System will add 3 bcf/d by 2027 using compact integrally geared machines to save plot space. Middle-Eastern operators favor modular skids that cut field-installation time from 18 months to 12 months, improving tariff recovery timelines. As these networks increase mileage, rotational equipment replacement cycles shorten, feeding the centrifugal compressor market.
LNG Liquefaction & Regas Capacity Additions
Global liquefaction capacity is on pace to grow by 300 bcm per year between 2024 and 2030, with each train relying on 4–6 centrifugal compressors to chill gas to –162 °C. Venture Global’s Plaquemines project installed 72 compressors across 18 modular trains, delivering 20 mtpa of export capacity. Qatar’s North Field East awarded Mitsubishi Heavy Industries a USD 1.8 billion order for 96 units that offer 8% lower power draw in part-load. On the demand side, Europe brought three FSRUs online in 2024, each using two high-pressure send-out compressors to inject gas at 70 bar. The capital-intensive, 20-year nature of LNG contracts makes these compressors long-cycle assets immune to short-term price swings.
Industrial CCGT Capacity Expansion
Eighteen gigawatts of new CCGT capacity were under construction in the United States by mid-2025, with every plant installing 2–3 centrifugal compressors for fuel-gas boosting. GE Vernova’s USD 450 million order in South Korea highlights compressors that raise pipeline gas from 15 bar to 40 bar to match turbine requirements.[4] China added 12 GW of CCGT in 2024, adopting integrally geared fuel-gas compressors that helped reach 62% combined-cycle efficiency. Rapid-ramp capability, 10% per minute, lets centrifugal machines balance intermittent renewables, a flexibility reciprocating units lack. Retrofitted coal plants such as Georgia Power’s McDonough now pair new turbines with three modern compressors, cutting CO₂ emissions by 60%.
Hydrogen Hub Demand for Oil-Free Compression
The U.S. DOE’s USD 7 billion hydrogen-hub program will deploy roughly 200 oil-free compressor trains by 2030, elevating electrolyzer output from 30 bar to 100 bar pipeline pressure. Kawasaki’s 10-MW demonstration compressor achieved 82% polytropic efficiency without the filters normally required for oil-lubricated units. Atlas Copco’s ZH+ series, launched in 2025, meets ISO 8573-1 Class Zero via magnetic couplings that remove lubricant risk. Siemens Energy and Air Liquide are developing 20-MW geared machines for 350 bar export pressures, bypassing the energy penalties of liquefaction. Modular staging allows operators to add impellers as hydrogen purity and demand evolve, unlike fixed-stroke reciprocating designs.
Restraints Impact Analysis of Centrifugal Compressor Market*
| Restraint | (~) % Impact on CAGR Forecast | Geographic Relevance | Impact Timeline |
|---|---|---|---|
| High capex vs. reciprocating alternatives | -0.8% | Global, particularly in cost-sensitive emerging markets | Short term (≤ 2 years) |
| Upstream spend cycles tied to volatile oil prices | -0.6% | North America, Middle East, Latin America | Medium term (2-4 years) |
| Alloy-impeller supply bottlenecks | -0.4% | Global, with acute impact in high-pressure sour-gas applications | Short term (≤ 2 years) |
| Rise of modular screw-compressor packages | -0.3% | Europe, North America | Medium term (2-4 years) |
| Source: Mordor Intelligence | |||
High Capex vs. Reciprocating Alternatives
Installed costs range from USD 800 to USD 2,500 per horsepower for centrifugal machines, versus USD 600–900 for reciprocating units in mid-power ranges. Small-scale biogas and landfill-gas projects with 4,000–6,000 operating-hours per year opt for pistons because their intermittent duty does not justify centrifugal premiums. Add-on expenses such as a variable-frequency drive, anti-surge controls, and vibration monitoring add another USD 400,000–600,000. Leasing options favor reciprocating equipment in India and Southeast Asia, where financiers see lower residual-value risk. Economics swing in favor of centrifugal designs only when annual run-hours exceed 7,000 and labor costs top USD 80 per hour, thresholds still rare in many emerging regions.
Alloy-Impeller Supply Bottlenecks
Titanium and nickel-alloy impellers face 16-month lead times as aerospace orders divert capacity, up from 10 months in 2022. A 2024 recall of nickel impellers with micro-cracks delayed four Middle-East gas plants by up to nine months and triggered USD 50 million in penalties. Siemens Energy invested USD 120 million to add 3D-printing lines that will cut lead times 40% by 2027. Until then, developers are pre-ordering impellers 24 months ahead of delivery, limiting flexibility to change specifications mid-project. OEMs are qualifying 17-4 PH stainless steel for lower-pressure stages, but high-pressure hydrogen service still mandates Inconel 718.
*Our forecasts treat driver/restraint impacts as directional, not additive. The impact forecasts reflect baseline growth, mix effects, and variable interactions.
Centrifugal Compressor Market Segment Analysis
By Compressor Design:
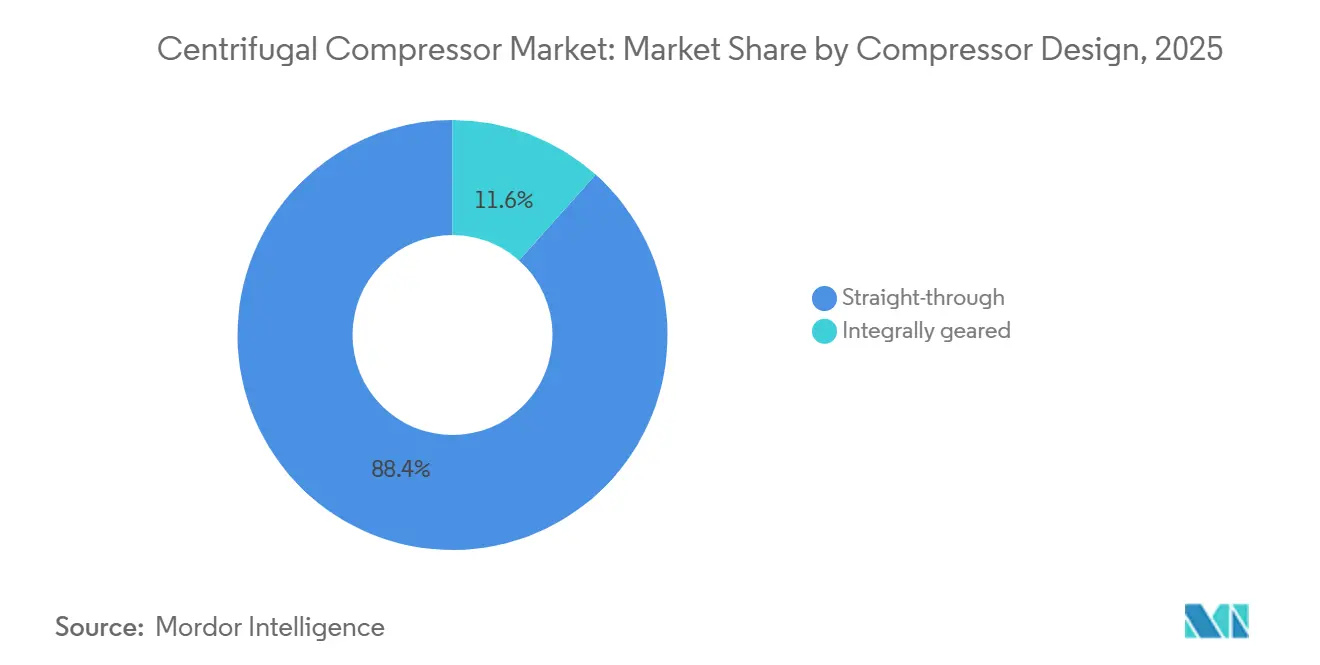
Integrally Geared Gains in Modular LNGStraight-through machines dominated with 88.4% centrifugal compressor market share in 2025; pipeline and gas-gathering operators value their simpler shaft line and easier bearing maintenance. Integrally geared models are forecast to expand at a 7.3% CAGR because a 30%–40% footprint reduction suits floating LNG and offshore platforms where deck space commands premiums.
The centrifugal compressor market reflects that API 617-2024 vibration limits encourage gearbox retrofits of 1990s-vintage units to avoid costly shaft modifications. European and Asian buyers facing land constraints prefer geared layouts that cut noise by 6 dB and plot area by 35%. Gearbox cost premiums are narrowing as powder-metallurgy gears extend overhaul intervals from 40,000 hours to 60,000 hours, reducing lifecycle costs by 12%.

By Stage:
Single-Stage Simplicity in Low-Ratio ApplicationsMulti-stage equipment captured 60.6% of the centrifugal compressor market size in 2025 because long-haul pipelines and ammonia plants need 4:1 or higher pressure ratios. Yet single-stage configurations are expected to advance at a 6.8% CAGR through 2031, buoyed by data-center cooling and food processing that demand ratios below 3:1.
Computational fluid dynamics now yields 3D curved blades that push single-stage ratios to 3.8:1, eliminating intercoolers and saving USD 300,000–400,000 per train. In mining, Brazilian pellet plants selected 12 single-stage units for 20% lower maintenance due to no interstage seals. The centrifugal compressor market benefits when ISO 8573-1 Class Zero certification drives food-grade nitrogen and carbonation service away from oil-flooded pistons.
By Cooling Method:
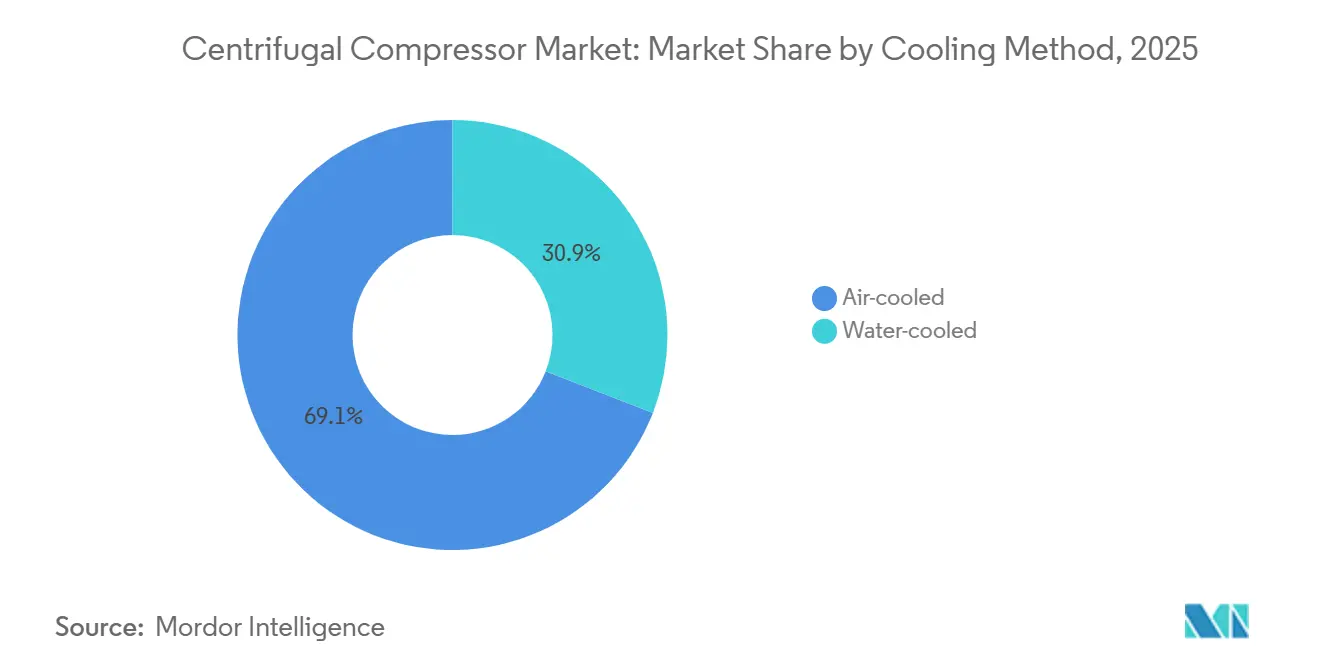
Water Scarcity Sustains Air-Cooled DominanceAir-cooled configurations held 69.1% of 2025 revenue thanks to offshore installations and water-scarce shale fields. However, water-cooled variants are set to grow 6.5% annually as Middle-East petrochemical plants leverage seawater intercooling to cut compression power by 3%–5%.
Air-cooled systems still dominate in North American shale plays where permitting water withdrawals adds cost and time. The centrifugal compressor market is seeing microchannel heat exchangers shave 40% exchanger weight, narrowing the efficiency gap with water-cooling to under 3% in moderate climates. Offshore FLNG vessels such as Shell’s Prelude accept a 4% power penalty in favor of corrosion-free air coolers.
By End-User Industry:
Petrochemicals Outpace Oil & GasOil and gas users retained 37.5% demand in 2025, yet petrochemicals will lead growth at a 7.0% CAGR as ethylene-cracker expansions rely on multi-train compression. ExxonMobil’s Beaumont project added 1.3 mtpa polyethylene capacity with eight geared compressors that handle –40 °C suction temperatures.
Metals, mining, and food processing collectively account for roughly 18% of 2025 volume as ISO food-safety and cleanroom rules mandate oil-free Class Zero air. Centrifugal compressor market size gains will concentrate in the Middle East and China, where each tonne of new ethylene capacity needs up to 1.2 horsepower of refrigerant compression.
Geography Analysis
APAC Centrifugal Compressor Market
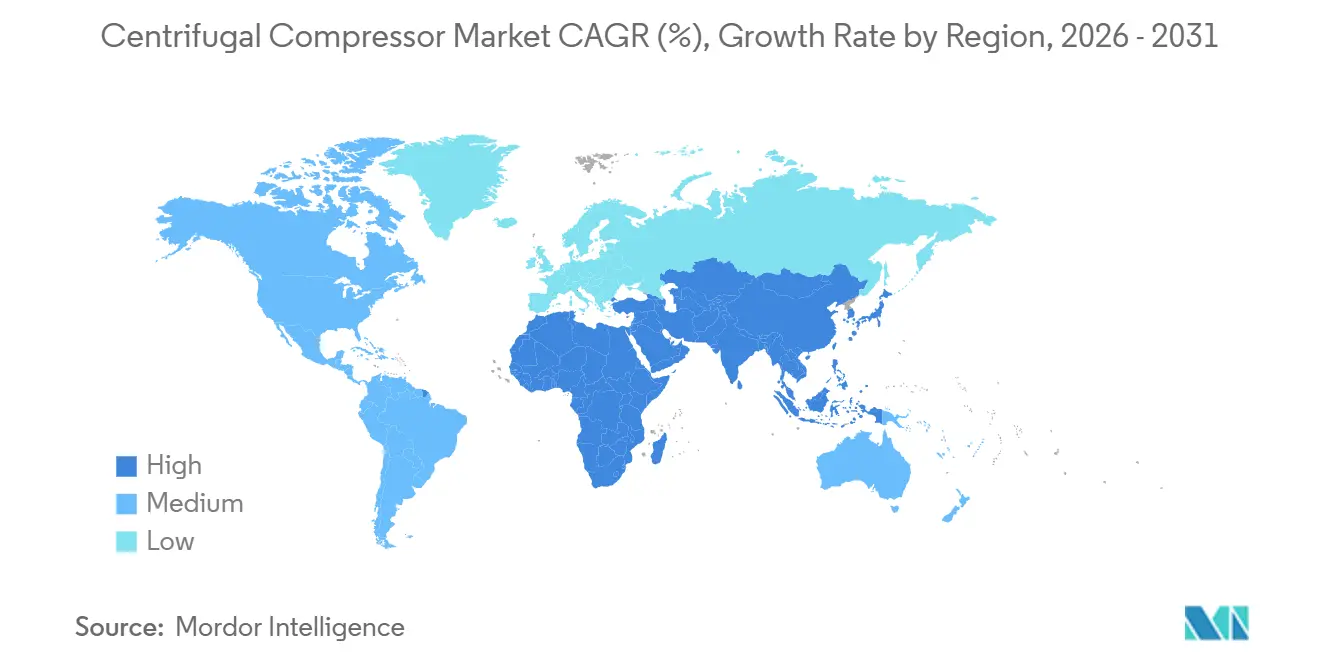
Asia-Pacific retained 38.3% of 2025 revenue and is forecast to advance at a 6.2% CAGR as China commissioned six petrochemical complexes deploying more than 80 compressors. India’s KG Basin subsea compression order for 12 units at 15 MW each highlights offshore monetization trends. Japan and South Korea are swapping out lubricant-risk units with oil-free machines to meet 10 ppm sulfur marine fuel mandates.
North America Centrifugal Compressor Market
North America contributed close to 30% of global demand in 2025, supported by Permian pipelines and Gulf Coast liquefaction. Plaquemines LNG and Corpus Christi Stage 3 together placed 48 orders for mixed-refrigerant compressors. Canada’s LNG Canada awarded a USD 1.55 billion compressor-turbine package that can handle 15% hydrogen blends. Mexico’s Wahalajara system commissioned four high-pressure stations to move gas 500 km to Guadalajara.
EMEA and South America Centrifugal Compressor Market
Europe held nearly one-fifth of the centrifugal compressor market; three German FSRUs now inject regasified LNG at 70 bar. Industrial retrofits under ISO 50001 are replacing pre-2010 machines and unlocking EU Innovation Fund grants. The Middle East and Africa, roughly 13% of 2025 demand, hinge on Qatar’s North Field expansion and ADNOC’s Ruwais refinery upgrade, which installed 16 hydrogen recycle units. South America remains small at 4%–5% but notable for Petrobras’ USD 320 million subsea compression order supporting Búzios field pressure maintenance.
Regulatory Landscape
Centrifugal compressors in oil and gas and industrial facilities face tighter emissions and energy-performance compliance requirements. In the United States, EPA rules under 40 CFR Part 60 for the oil and gas sector (including provisions updated in 2024) raise monitoring and control expectations for emissions from affected facilities that include centrifugal-compressor-related equipment and operating conditions, which increases focus on higher-integrity sealing, monitoring, and station retrofits.
On the efficiency side, the US Department of Energy continued formalizing test and compliance frameworks for compressors through its Energy Conservation Program (including 10 CFR 431.345 and the related Federal Register test-procedure activity in January 2025). This raises the emphasis on documented performance and encourages OEMs to standardize verification. In Europe, the Ecodesign framework broadened performance and repairability requirements for centrifugal fan-type equipment through Commission Regulation (EU) 2024/1834 (in force from July 2026) and related amendments, reinforcing lifecycle compliance themes that carry into adjacent rotating equipment procurement and retrofit planning.
Competitive Landscape
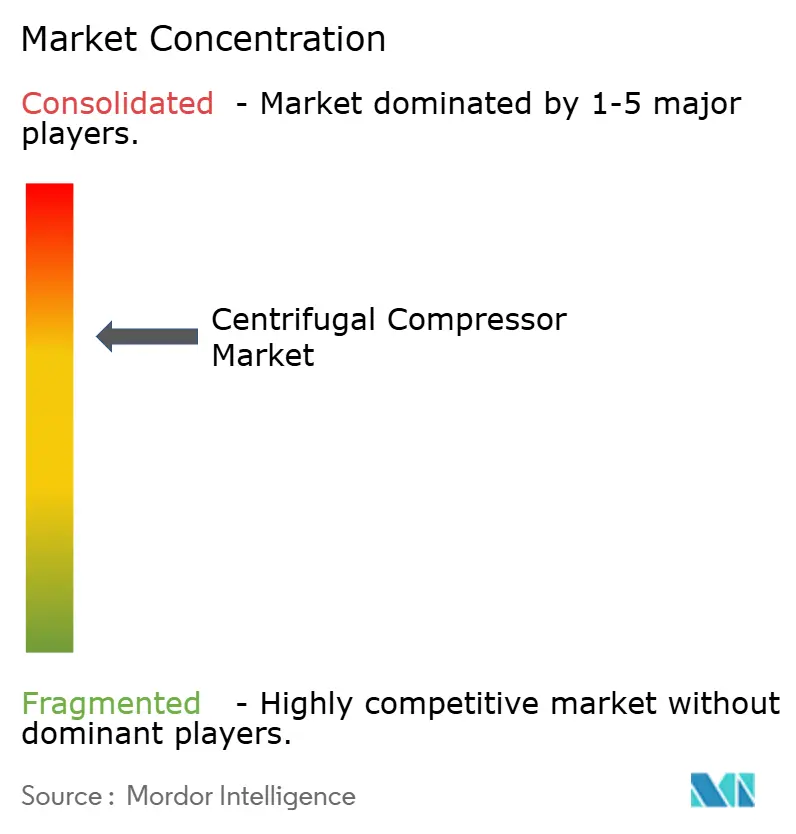
Five suppliers, Siemens Energy, Baker Hughes, Atlas Copco, Mitsubishi Heavy Industries, and Howden, held about 45%-50% of 2025 revenue, leaving regional players room to win local projects. Differentiation now centers on digital twins and predictive analytics that cut unplanned downtime by up to 30%. Hydrogen compression and retrofit impeller upgrades remain white-space opportunities promising 15%-20% power savings and quick payback in North American gas plants.
Chart Industries’ 2024 purchase of Howden for USD 4.5 billion melds cryogenic heat exchangers with compressors, letting the firm offer single-source LNG trains. Additive manufacturing of titanium impellers is slicing lead times in half and boosting isentropic efficiency 2%-3%. API 617-8th Edition vibration and seal limits raise barriers, nudging smaller makers toward standardized, lower-pressure lines. An installed-base-heavy business spurs service revenues; Atlas Copco’s 180 global centers guarantee 48-hour spare-parts delivery, a logistical moat that newcomers struggle to match.
Centrifugal Compressor Industry Leaders
-
Atlas Copco AB
-
Siemens Energy AG
-
Ingersoll Rand Inc.
-
Baker Hughes Company
-
Mitsubishi Heavy Industries Ltd
- *Disclaimer: Major Players sorted in no particular order
Centrifugal Compressor Market Companies Covered in this Report
- Atlas Copco AB
- Ingersoll Rand Inc.
- Siemens Energy AG
- Baker Hughes Co.
- Mitsubishi Heavy Industries Ltd
- Sundyne LLC
- Elliott Group
- Howden Group
- MAN Energy Solutions
- Kobe Steel Ltd
- HMS Group
- Borsig GmbH
- Hitachi Ltd
- Kirloskar Pneumatic Co.
- FS-Elliott
- Gardner Denver Nash
- Shenyang Blower Works Group
- Boldrocchi
- IHI Rotating Machinery
- Sulzer Ltd
Market Opportunities and Future Outlook
Hydrogen and decarbonization-linked compression is the clearest whitespace where buyers are looking for oil-free trains, higher discharge pressures, and verifiable purity control. Kawasaki Heavy Industries began demonstrating its KM Comp-H2 centrifugal hydrogen compressor for hydrogen liquefaction using 100% pure hydrogen at its Harima Works in Japan (March 2026), which supports the view that OEM and end-user validation is moving beyond traditional oil-lubricated approaches for hydrogen service.
Large LNG and gas-infrastructure awards are also shaping near-term order books, creating pull for integrally geared, modularized, and digitally monitored trains that reduce commissioning time and improve part-load efficiency. Baker Hughes was selected to supply two LM6000PF gas turbine-driven centrifugal compressor trains for the ST LNG offshore export terminal project in Texas (March 2026) and later won a contract to supply 15 centrifugal compressors for Train 7 of the Sabine Pass LNG expansion in Louisiana (July 2026), pointing to continued procurement activity around export capacity additions. On the supply side, SIAD Group started building an 18 million euro compressor manufacturing facility in Seriate, Italy (March 2026, scheduled for mid-2026 completion), supporting capacity additions and localization tied to industrial upgrades and energy-transition projects.
Recent Industry Developments in Centrifugal Compressor Market
- July 2026: Atlas Copco Group completed the acquisition of a compressor distributor in northern Portugal, expanding local sales and service coverage. The acquisition improves aftermarket responsiveness for installed centrifugal compressor fleets and strengthens regional channel access for oil-free and industrial compression solutions.
- September 2025: Baker Hughes secured an order from Bechtel Energy to supply six centrifugal compressors for Train 4 of the Rio Grande LNG Facility expansion. The award reinforces LNG-driven demand for large, continuous-duty compression trains and aligns with packaged turbomachinery configurations tied to export-project schedules.
- October 2024: Atlas Copco expanded its ZH and ZH+ oil-free centrifugal compressor range, adding models in the 630-1600 kW class and highlighting energy-efficiency improvements and smaller footprints. The update increases options for industrial users targeting utility cost reduction and oil-free air requirements in regulated production environments.
Centrifugal Compressor Market Report Scope and Research Methodology
Market Definition and Coverage
For this methodology, the market is defined as revenue from centrifugal compressors supplied for industrial gas compression needs, counted at the point of sale for new units and standard aftermarket services tied to these machines.
Scope exclusions: Excluded from this scope are positive displacement compressor types (such as screw and reciprocating), standalone parts sold outside standard service, and non-industrial HVAC-only compressor demand.
Segments Covered in This Report
- By Compressor Design
- Straight-through
- Integrally geared
- By Stage
- Single-stage
- Multi-stage
- By Cooling Method
- Air-cooled
- Water-cooled
- By End-user Industry
- Oil and Gas
- Petrochemicals and Chemicals
- Power Generation
- Metals and Mining
- Food and Beverage
- Others
- By Geography
- North America
- United States
- Canada
- Mexico
- Europe
- Germany
- United Kingdom
- France
- Spain
- Italy
- NORDIC Countries
- Russia
- Rest of Europe
- Asia-Pacific
- China
- India
- Japan
- South Korea
- ASEAN Countries
- Australia and New Zealand
- Rest of Asia-Pacific
- South America
- Brazil
- Argentina
- Chile
- Rest of South America
- Middle East and Africa
- Saudi Arabia
- United Arab Emirates
- South Africa
- Egypt
- Rest of Middle East and Africa
- North America
Data Sources, Market Sizing, and Validation
Desk Research
Desk research was used to map the demand pool and the supply landscape before modeling started. We reviewed publicly available energy and industrial indicators, such as IEA datasets, EIA statistics, and World Bank macro series, to understand where gas processing, refining, power generation, and related industrial capacity additions are being planned.
To link activity levels with compressor demand, we also used sources such as UN Comtrade trade flows, USGS mineral and metals snapshots, and technical papers in ASME and similar peer reviewed outlets that describe compressor duty cycles and efficiency trends. Company filings, investor presentations, procurement notices, and business press were also used to validate installed base trends and major project timing, while a paid subscription database was used selectively for company financials and patent lookups. These examples are not exhaustive, and additional public sources were consulted to compile inputs, test assumptions, and resolve open questions.
Primary Interviews and Surveys
The primary work was focused on practical checks that usually do not show up cleanly in public datasets, including typical replacement cycles, tender-to-delivery timelines, and how buyers shift between straight-through and integrally geared designs by application. We spoke with OEM-facing channel participants, EPC and plant engineering stakeholders, and end-user maintenance teams across APAC, EMEA, and the Americas, so regional project pipelines and pricing behavior could be compared and used to tighten model assumptions.
Distribution of primary research fieldwork respondents
| Company type | Respondent position | Region |
|---|---|---|
| Top tier: 30% | CXOs: 13% | APAC: 48% |
| Mid tier: 56% | Functional/Unit leaders: 33% | EMEA: 34% |
| Smaller Players: 14% | Managers: 54% | Americas: 18% |
Market-Sizing & Forecasting
We estimated market size using a top-down approach, translating energy and industrial output indicators into likely compressor demand by end-use, and then converting that demand into value using typical price bands by design, stage, and cooling method. To keep totals realistic, we cross-checked results with selective bottom-up approximations, such as sampled ASP times expected unit volumes in key applications, plus supplier and channel checks on large project ordering patterns.
Inputs that tended to matter most for this market included LNG and gas processing capacity additions, refinery and petrochemical project announcements, power generation capacity mix changes, and the prevalence of multi-stage configurations in higher pressure duties. We also tracked replacement and overhaul cycles, since maintenance-led demand can shift differently from newbuild demand during slower investment years. Forecasts were developed using scenario analysis, where project pipeline timing, energy price expectations, and regional industrial growth were stress tested, with interviewer feedback used to confirm which path aligned with how buyers typically schedule orders. The final forecast path was selected only after the assumptions matched the most common buyer behavior described by practitioners.
Where bottom-up checks had gaps, which is common when project details are not disclosed, we filled them using proxy ratios tied to installed base and publicly visible capex cycles, then re-tested outputs against trade flows and announced capacity additions before locking the final number.
Data Validation & Update Cycle
Model outputs were triangulated across at least three views, including demand signals, supply and shipment proxies, and pricing logic, so no single dataset could over-drive the result. Outliers were flagged at the regional and end-use level, then reviewed in a second analyst pass to determine whether the variance could be explained by a project delay, a currency move, or a pricing change.
Reports are refreshed annually, with interim updates when material events occur, such as major capex cancellations, regulation changes affecting emissions and efficiency, or large M&A activity that shifts reported revenues. Before delivery, a fresh review pass is completed so clients receive the latest view based on new public releases and follow-up calls when something appears inconsistent.
Mordor Intelligence's Global Centrifugal Compressors Market Market Size Measured Against Other Published Estimates
Published market sizes for centrifugal compressors can look far apart, even when they appear to cover the same topic, because the counted revenue streams and the base year assumptions are not always aligned. Differences typically come from what is included around services, which compressor families are grouped together, and how project timing and pricing are treated in the base year.
Aftermarket revenue beyond standard service contracts falls outside Mordor Intelligence's scope, and this inclusion choice often explains why some estimates that combine broader parts sales with new unit revenue report a smaller or larger total. Gaps also show up when one publisher anchors demand mainly to general manufacturing output, while another leans more on oil and gas project pipelines and higher pressure duty requirements, which changes the implied unit count and average selling price progression.
Benchmark comparison
| Source | Market Size | Gaps in Research Methodology |
|---|---|---|
| Mordor Intelligence | USD 8.46 B (2026) | |
| Industry Publisher A | USD 4.21 B (2025) | Uses an earlier base year and a type split (oil-filled vs oil-free) that can exclude parts of industrial duty coverage, and it appears to apply a narrower value capture around heavy process applications, which depresses the near-term total. |
| Industry Publisher B | USD 4.54 B (2025) | Centers the sizing on broad product and discharge pressure bands with a 2025 base, and the value conversion can diverge if large project deliveries and higher pressure multi-stage pricing are not timed into the same year as the demand signal. |
Taken together, the spread is mostly explained by scope and timing rather than a disagreement that demand exists. By keeping inclusions clear, tying demand to observable capacity and project signals, and then checking pricing against what buyers say they actually pay, the resulting market size stays traceable and repeatable for planning use.
Key Questions Answered in the Report
What is the current value of the centrifugal compressor market?
The centrifugal compressor market size reached USD 8.46 billion in 2026 and is projected to hit USD 11.08 billion by 2031.
Which region leads global demand?
Asia-Pacific held 38.3% revenue in 2025 and is on track for a 6.2% CAGR through 2031.
Which design type is growing fastest?
Integrally geared configurations are expected to grow at a 7.3% CAGR thanks to footprint savings in modular LNG and floating units.
Why are petrochemical plants adopting centrifugal compressors?
New ethylene crackers need multi-train refrigerant compression, helping petrochemicals post the fastest 7.0% CAGR to 2031.
How do hydrogen hubs influence equipment selection?
Oil-free centrifugal units avoid lubricant contamination, making them the preferred choice for DOE-funded hydrogen hubs.
What are key technology trends?
Additive manufacturing of titanium impellers, magnetic bearings, and variable-geometry diffusers are improving efficiency and cutting lead times.