Market Overview
| Study Period | 2018 - 2031 |
|---|---|
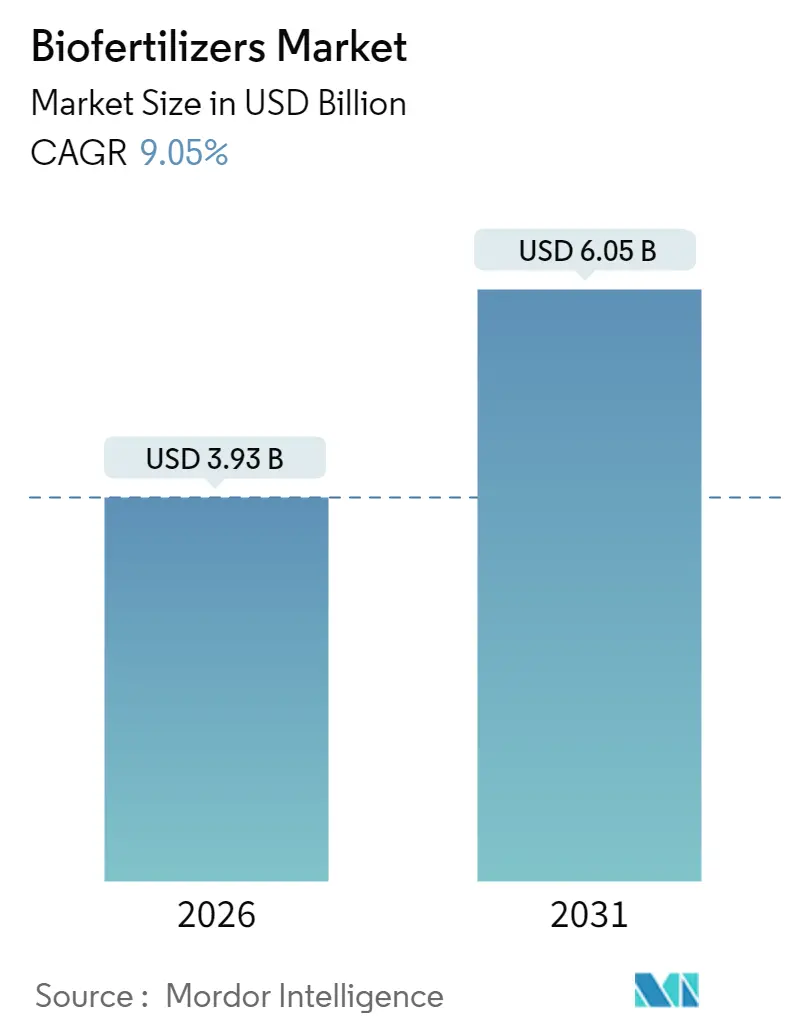
| Market Size (2026) | USD 3.93 Billion |
| Market Size (2031) | USD 6.05 Billion |
| Growth Rate (2026 - 2031) | 9.05% CAGR |
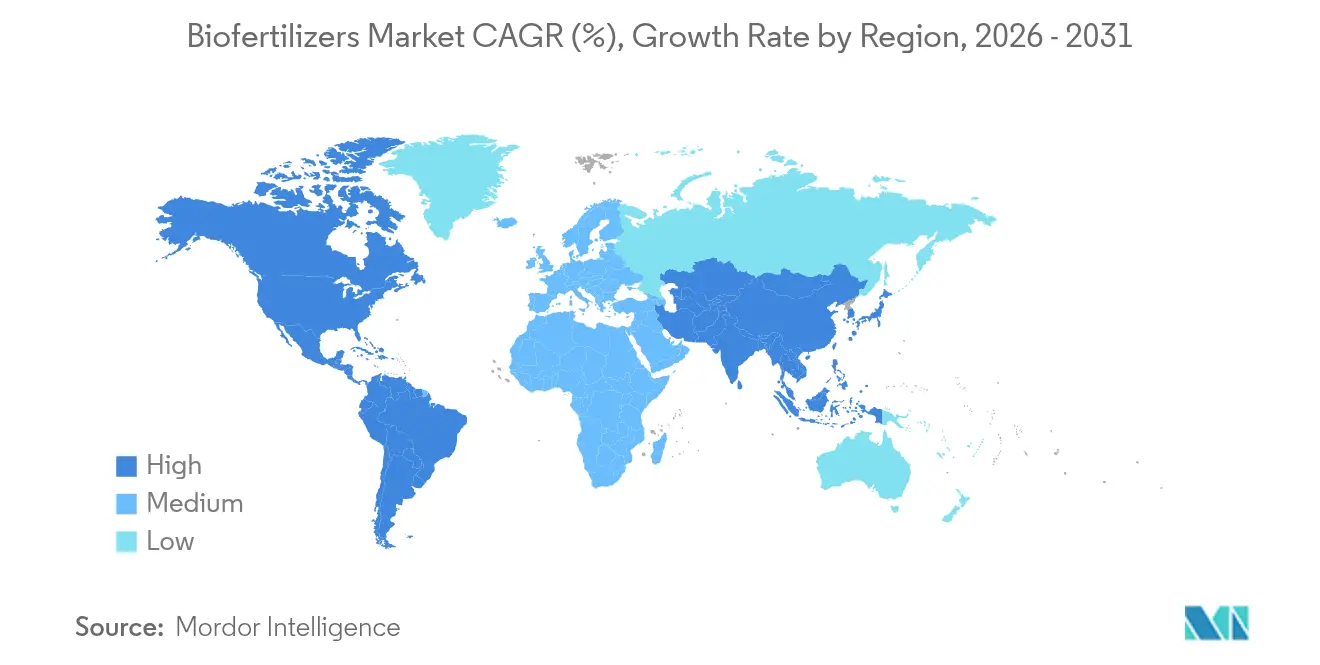
| Fastest Growing Market | Asia Pacific |
| Largest Market | North America |
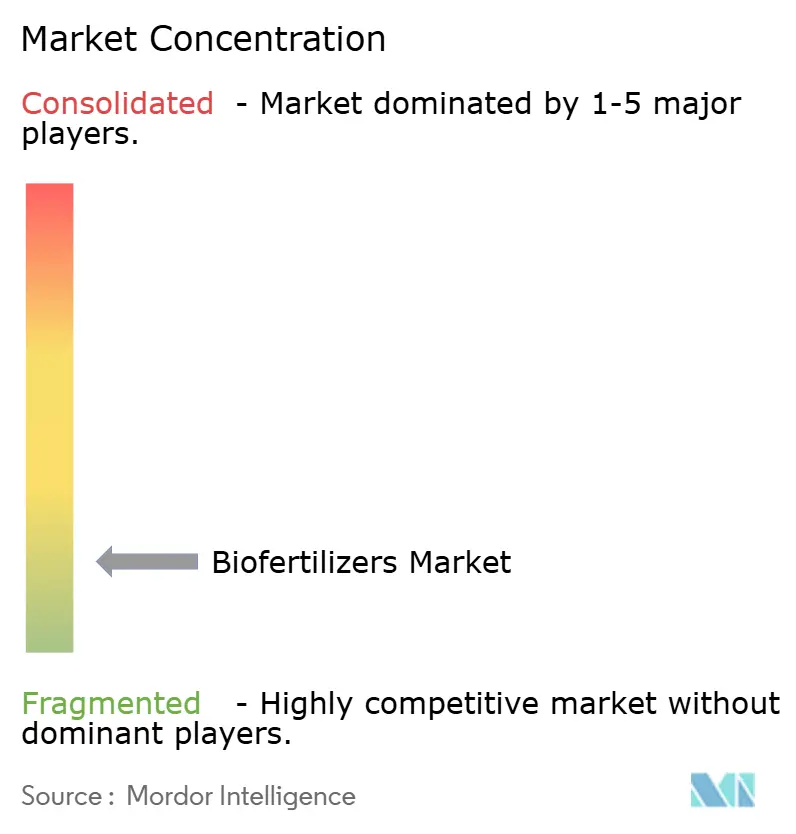
| Market Concentration | Low |
Major Players *Disclaimer: Major Players sorted in no particular order Image © Mordor Intelligence. Reuse requires attribution under CC BY 4.0. | |
Biofertilizers Market Analysis by Mordor Intelligence
The biofertilizers market is expected to grow from USD 3.60 billion in 2025 to USD 3.93 billion in 2026 and is forecast to reach USD 6.05 billion by 2031 at 9.05% CAGR over 2026-2031. Strong momentum in sustainable farming, stricter environmental rules, and premium pricing for certified organic produce reinforce demand. North America leads current revenue with a 36.2% biofertilizers market share in 2024, reflecting mature organic certification systems and government cost-share programs. Asia-Pacific sets the pace on the growth front, propelled by national subsidy schemes in India and China and by large areas transitioning from synthetic to biological inputs. Across all regions, carbon-credit monetization, precision application tools, and bundled microbial consortia are widening profit pools for suppliers and growers alike. Consolidation among agricultural-input majors and local specialists further accelerates technology diffusion while reshaping competitive boundaries.
Key Report Takeaways
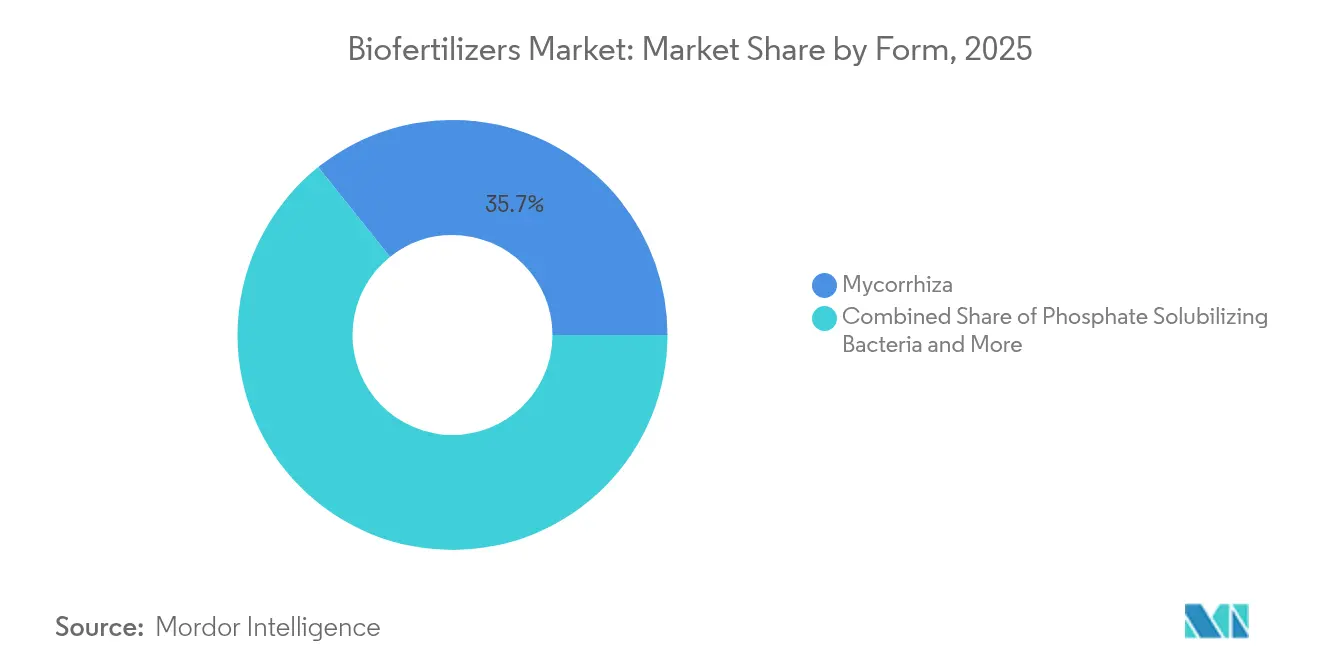
- By form, mycorrhiza products captured 35.74% of the biofertilizers market share in 2025, while rhizobium products are projected to expand at a 10.25% CAGR from 2026 to 2031.
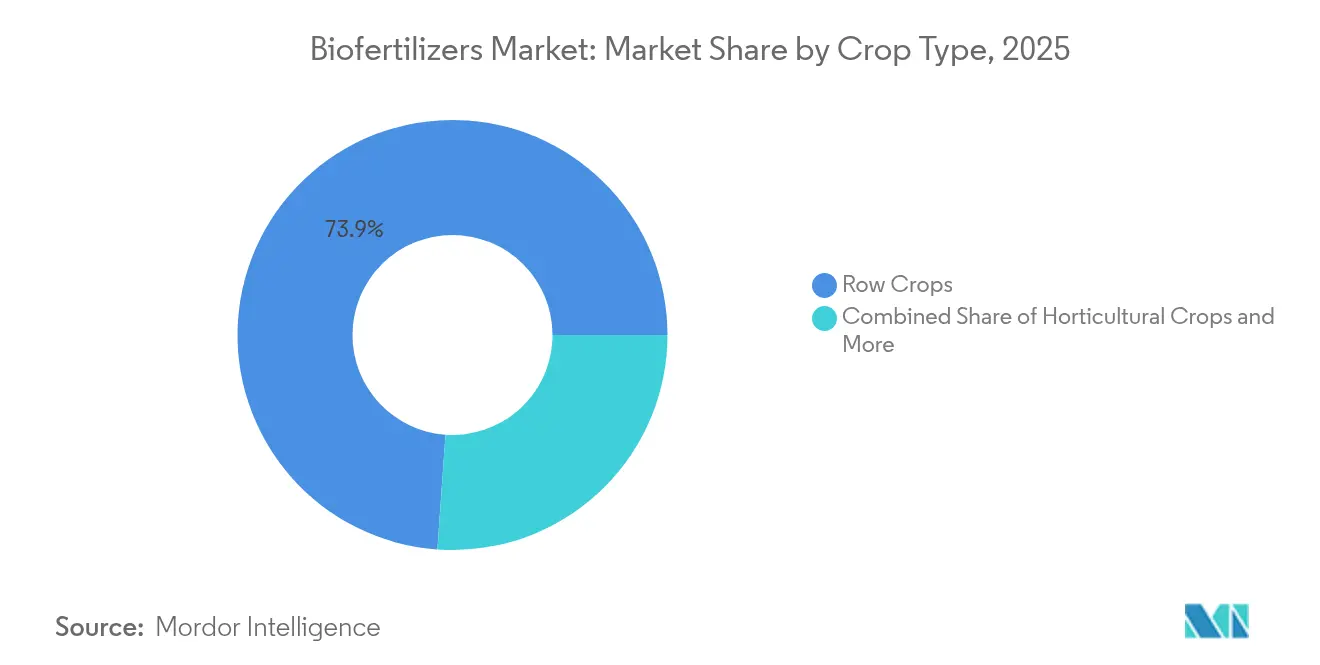
- By crop type, row crops commanded a 73.88% share of the 2025 biofertilizers market size, while horticultural crops are set to grow fastest, registering a 9.78% CAGR through 2031.
- By geography, North America held 35.62% revenue share in 2025, while Asia-Pacific is forecast to deliver the highest regional CAGR at 9.74% to 2031.
Note: Market size and forecast figures in this report are generated using Mordor Intelligence’s proprietary estimation framework, updated with the latest available data and insights as of January 2026.
Global Biofertilizers Market Trends and Insights
Drivers Impact Analysis
| Driver | (~) % Impact on CAGR Forecast | Geographic Relevance | Impact Timeline |
|---|---|---|---|
| Consumer Shift Toward Organic Food Drives Premium Market Expansion | +2.1% | Global, led by North America and Europe | Medium term (2-4 years) |
| Government Subsidies Create Favorable Adoption Economics | +1.8% | Asia-Pacific and Europe, expanding to South America | Short term (≤ 2 years) |
| Environmental Regulations Accelerate Synthetic Input Substitution | +1.5% | Global, strongest in European Union and North America | Long term (≥ 4 years) |
| Certified Organic Acreage Expansion Sustains Demand | +1.3% | North America and Europe, fast growth in Asia-Pacific | Medium term (2-4 years) |
| Carbon-Credit Monetization for Biofertilizer Use | +1.1% | North America and European Union, pilots in Australia and Brazil | Long term (≥ 4 years) |
| Adoption of Microbial Consortia for Drought/Salinity Tolerance | +2.1% | Asia-Pacific core, spillover to Middle East and Africa | Medium term (2-4 years) |
| Source: Mordor Intelligence | |||
Consumer Shift Toward Organic Food Drives Premium Market Expansion
Organic food sales reached USD 134 billion in 2024, posting 15.2% year-over-year growth, and certified produce commands 20–40% price premiums [1]Source: Organic Trade Association, “Industry Survey,” OTA.COM. Retailers now require verified biological input records for shelf space, prompting growers to embrace biofertilizers market solutions for compliance. Europe posts the highest per-capita organic consumption, reinforcing steady demand in Germany and the Netherlands. Brand owners outside traditional organic niches are adopting biological inputs to satisfy public sustainability pledges, thereby enlarging addressable hectares. These convergence dynamics elevate revenue visibility for suppliers and strengthen long-term expansion prospects for the biofertilizers market.
Government Subsidies Create Favorable Adoption Economics
The United States Department of Agriculture (USDA) earmarked USD 300 million in 2024 under the Environmental Quality Incentives Program to reimburse up to 75% of qualifying biofertilizer costs [2]Source: USDA Natural Resources Conservation Service, “EQIP,” NRCS.USDA.GOV. India’s Ministry of Chemicals and Fertilizers launched an INR 41 billion (USD 500 million) promotion scheme the same year. The European Union (EU) allocates EUR 8.1 billion (USD 8.7 billion) annually through eco-schemes that reward verified biological inputs [3]Source: European Commission, “Farm to Fork Strategy,” EC.EUROPA.EU. Brazil, under its National Program for Biological Inputs, offers tax holidays on microbial manufacturing equipment. These incentives narrow payback periods for growers and catalyze double-digit growth in the biofertilizers market.
Environmental Regulations Accelerate Synthetic Input Substitution
The European Union (EU) Farm to Fork Strategy targets a 50% cut in chemical fertilizer use by 2030, turning biological alternatives into essential compliance tools. In the United States, nutrient-runoff regulations in Iowa, Illinois, and Minnesota bolster biological demand. China now caps synthetic nitrogen at 225 kg per hectare, prompting growers to integrate microbial solutions. Complementary carbon-offset rules make biofertilizer-driven soil carbon gains eligible for credits priced near USD 28 per metric ton. Suppliers that link agronomy services with environmental audits stand to secure premium contracts, amplifying the growth trajectory of the biofertilizers market.
Certified Organic Acreage Expansion Sustains Demand
Certified organic farmland touched 75.8 million hectares in 2024, up 8.7% year over year. The United States recorded 5.6 million organic acres, with transition acreage accounting for 18% of new certifications. India added 2.78 million hectares under certification, aided by state-funded free microbial supplies. High-value fruits and vegetables drive incremental uptake because premium prices offset higher per-acre input costs. Blockchain traceability, already deployed by T. Stanes and Company Limited, enhances transparency and secures export premiums, reinforcing solid growth in the biofertilizers market.
Restraints Impact Analysis
| Restraint | (~) % Impact on CAGR Forecast | Geographic Relevance | Impact Timeline |
|---|---|---|---|
| Cold-Chain Infrastructure Limitations Constrain Market Access | −1.4% | Global, acute in tropical and developing regions | Short term (≤ 2 years) |
| Performance Inconsistency Across Agricultural Systems | −1.2% | Global, pronounced in diverse agro-ecologies | Medium term (2-4 years) |
| Rising Competition from Biostimulants and Nano-fertilizers | −0.9% | North America and Europe, spreading to Asia-Pacific | Medium term (2-4 years) |
| Patentability Hurdles for Novel Microbial Strains | −0.7% | Global, strongest in innovation-intensive markets | Long term (≥ 4 years) |
| Source: Mordor Intelligence | |||
Cold-Chain Infrastructure Limitations Constrain Market Access
Biofertilizers must remain between 2 °C and 8 °C, yet viability drops 15–30% monthly at ambient temperatures. Forty percent of developing nations lack adequate cold storage, raising distribution costs by up to four times. Logistics hurdles weaken retail availability and deter small distributors from stocking live microbial products. Freeze-dry and encapsulation methods extend shelf life to almost two years but raise production costs 35–50%. Until the existing cold-chain infrastructure gaps are effectively addressed, this challenge will continue to impede the growth potential of the biofertilizers market.
Performance Inconsistency Across Agricultural Systems
Meta-analyses show 20–60% variation in field performance due to soil pH, organic matter, and temperature extremes. Acidic soils below pH 5.5 hamper microbial survival, while temperatures above 35 °C or below 10 °C cut viability by up to 70%. Farmers facing unpredictable returns hesitate to switch from chemical inputs. Suppliers are expanding site-specific formulations, but higher development costs and longer trial periods temper near-term growth of the biofertilizers market.
Segment Analysis
By Form: Mycorrhiza Dominance Driven by Root Enhancement Benefits
Mycorrhiza products held 35.74% of the biofertilizers market share in 2025. Arbuscular mycorrhizal fungi deliver 20–35% higher phosphorus uptake across corn, soybean, and vegetable plots. Rhizobium formulations lead future expansion at 10.25% CAGR from 2026 to 2031 due to nitrogen fixation that trims synthetic needs by up to 60 kg per hectare. Growing interest in dual-organism blends, validated by the Environmental Protection Agency (EPA) in its rising approvals roster, drives incremental value. Multi-strain research strengthens crop resilience and broadens acreage, reinforcing CAGR forecasts and pulling fresh capital into this slice of the biofertilizers market.
Sustained investment in fermentation technology, coupled with precision carrier materials, is boosting shelf stability and field consistency. Suppliers that integrate agronomy advisory with product supply are earning loyalty among large growers and cooperatives. Granular application data guides next-generation R&D, encouraging custom inoculant packages that match soil profiles. These advances increase average selling prices and deepen the competitive moat around the biofertilizers market size for mycorrhiza and related consortia products.
Note: Segment shares of all individual segments available upon report purchase
Get Detailed Market Forecasts at the Most Granular Levels
Download PDF
By Crop Type: Row Crops Dominance Reflects Scale Economics
Row crops captured 73.88% of the biofertilizers market share in 2025, because corn, soybean, and wheat deliver volume efficiencies for broad-acre application. Precision farming networks enable variable-rate seeding of microbial granules, lowering per-bushel costs and lifting yield variance confidence. Horticultural crops will post the fastest gains at 9.78% CAGR from 2026 to 2031, fueled by premium prices in organic fresh produce and legal cannabis. Growers in strawberries, leafy greens, and tomatoes view biological inputs as mandatory for certification and residue-free branding, funneling growth to this end-use in the biofertilizers market.
Cash crops such as cotton and sugarcane are experimenting with nitrogen-fixing blends to meet emerging sustainability audits from textile and beverage brands. Insurers now factor microbial practices into risk underwriting, rewarding compliant farms with lower premiums. Row-crop dominance is therefore secure, yet diversified growth paths in specialty crops promise to raise the total biofertilizers market size by 2030 through higher revenue per hectare.
Note: Segment shares of all individual segments available upon report purchase
Get Detailed Market Forecasts at the Most Granular Levels
Download PDF
Geography Analysis
North America held a 35.62% share of the biofertilizers market in 2025, with the United States accounting for a significant portion to meet regional demand. Federal incentives, mature cold chains, and robust extension services underpin sustained volume growth. Canada follows with prairie-focused adoption in canola and wheat, while Mexico leverages organic certification for export-oriented horticulture. High research intensity, strong dealer networks, and widespread digital agronomy platforms make North America a launchpad for advanced inoculant technologies within the biofertilizers market.
Asia-Pacific stands out as the fastest-growing territory, advancing at a projected 9.74% CAGR to 2031. India anchors growth through its INR 41 billion subsidy scheme, distributing microbial inputs to 45 million farmers each year. China, representing USD 438.5 million in 2025, pursues a 20% synthetic-fertilizer cut, supported by regional demonstration plots. Japan and Australia invest in high-precision delivery systems, while Vietnam and Indonesia deploy biofertilizers across rice and palm plantations. Upgrades in rural cold storage and state-run extension clinics reduce adoption hurdles, enhancing regional contribution to the global biofertilizers market size.
Europe ranks second by value, buoyed by the European Union (EU) Farm to Fork target and Common Agricultural Policy eco-payments. Germany leads at 23% of regional revenue, followed by France and Italy. Post-Brexit, the United Kingdom channels Environmental Land Management payments into biological input adoption. Eastern European modernization programs are adding demand at double-digit rates. South America, chiefly Brazil and Argentina, leverages large-scale soybean rotations to integrate nitrogen-fixing inoculants, widening the geographic spread of the biofertilizers market.
Get Analysis on Important Geographic Markets
Download PDF
Competitive Landscape
The biofertilizers market remains fragmented, with the top five vendors holding a significant share in 2024. Indian Farmers Fertiliser Cooperative Limited and Gujarat State Fertilizers & Chemicals Limited excel in volume and local distribution. Symborg Inc., Koppert Biological Systems Inc., and T. Stanes and Company Limited differentiate through proprietary strains, consortium blends, and traceability platforms. Low concentration leaves white space for region-specific innovators to capture unmet soil and crop niches.
Mergers and acquisitions are gaining pace as integrated input firms seek biological portfolios. In March 2023, Corteva Agriscience acquired Symborg Inc., bundling microbial science with global sales reach, creating a template for future deals. Investments target fermentation capacity, data analytics, and field-service teams to accelerate adoption. Intellectual property strategies increasingly revolve around formulation know-how and application patents rather than single-organism claims, conforming to restrictive patent regimes while protecting competitive edges.
Regional specialists harness localized microbes and climatic insights to secure niche leadership. Strategic alliances with cooperatives, such as Koppert Biological Systems Inc.’s joint venture with Cooxupé in Brazil, enhance distribution to hard-to-reach grower clusters. Digital advisory platforms, bundled with product sales, raise switching costs and deepen customer lock-in. This multi-tiered competition accelerates innovation and volumes, supporting the long-term expansion of the biofertilizers market.
Biofertilizers Industry Leaders
Gujarat State Fertilizers & Chemicals Ltd
Indian Farmers Fertiliser Cooperative Limited
Koppert Biological Systems Inc.
T.Stanes and Company Limited
Symborg Inc. (Corteva Agriscience)
- *Disclaimer: Major Players sorted in no particular order
Need More Details on Market Players and Competitors?
Download PDF
Recent Industry Developments
- September 2025: ICL has partnered with BioPrime to launch advanced microbial biofertilizers in India using the BioNexus platform. This strategic move aims to improve nutrient use efficiency and reduce fertilizer subsidies by enhancing phosphorus and zinc uptake.
- January 2025: Super Crop Safe Ltd. has launched Super Gold WP+, a bio-fertilizer that boosts root growth and nutrient absorption. It supports sustainable farming by reducing dependence on chemical fertilizers across major agricultural regions in India.
- July 2024: Rovensa Next has launched Wiibio, a biofertiliser with biostimulant properties that regenerates soil and boosts plant development. It enhances microbial activity, root growth, and nutrient uptake for sustainable agriculture.
- March 2024: Novonesis has partnered with FMC Canada to distribute its biosolutions for plant health, including microbial inoculants and biofertilizers, throughout Canada beginning in 2025. This partnership aims to enhance access to sustainable agricultural inputs for Canadian growers.
Global Biofertilizers Market Report Scope
Azospirillum, Azotobacter, Mycorrhiza, Phosphate Solubilizing Bacteria, Rhizobium are covered as segments by Form. Cash Crops, Horticultural Crops, Row Crops are covered as segments by Crop Type. Africa, Asia-Pacific, Europe, Middle East, North America, South America are covered as segments by Region.Form
| Azospirillum |
| Azotobacter |
| Mycorrhiza |
| Phosphate Solubilizing Bacteria |
| Rhizobium |
| Other Biofertilizers |
Crop Type
| Cash Crops |
| Horticultural Crops |
| Row Crops |
Geography
| Africa | By Country | Egypt |
| Nigeria | ||
| South Africa | ||
| Rest of Africa | ||
| Asia-Pacific | By Country | Australia |
| China | ||
| India | ||
| Indonesia | ||
| Japan | ||
| Philippines | ||
| Thailand | ||
| Vietnam | ||
| Rest of Asia-Pacific | ||
| Europe | By Country | France |
| Germany | ||
| Italy | ||
| Netherlands | ||
| Russia | ||
| Spain | ||
| Turkey | ||
| United Kingdom | ||
| Rest of Europe | ||
| Middle East | By Country | Iran |
| Saudi Arabia | ||
| Rest of Middle East | ||
| North America | By Country | Canada |
| Mexico | ||
| United States | ||
| Rest of North America | ||
| South America | By Country | Argentina |
| Brazil | ||
| Rest of South America |
| Form | Azospirillum | ||
| Azotobacter | |||
| Mycorrhiza | |||
| Phosphate Solubilizing Bacteria | |||
| Rhizobium | |||
| Other Biofertilizers | |||
| Crop Type | Cash Crops | ||
| Horticultural Crops | |||
| Row Crops | |||
| Geography | Africa | By Country | Egypt |
| Nigeria | |||
| South Africa | |||
| Rest of Africa | |||
| Asia-Pacific | By Country | Australia | |
| China | |||
| India | |||
| Indonesia | |||
| Japan | |||
| Philippines | |||
| Thailand | |||
| Vietnam | |||
| Rest of Asia-Pacific | |||
| Europe | By Country | France | |
| Germany | |||
| Italy | |||
| Netherlands | |||
| Russia | |||
| Spain | |||
| Turkey | |||
| United Kingdom | |||
| Rest of Europe | |||
| Middle East | By Country | Iran | |
| Saudi Arabia | |||
| Rest of Middle East | |||
| North America | By Country | Canada | |
| Mexico | |||
| United States | |||
| Rest of North America | |||
| South America | By Country | Argentina | |
| Brazil | |||
| Rest of South America | |||
Need A Different Region or Segment?
Customize Now
Market Definition
- AVERAGE DOSAGE RATE - The average application rate is the average volume of biofertilizers applied per hectare of farmland in the respective region/country.
- CROP TYPE - Crop type includes Row crops (Cereals, Pulses, Oilseeds), Horticultural Crops (Fruits and vegetables) and Cash Crops (Plantation Crops, Fibre Crops and Other Industrial Crops)
- FUNCTION - The crop nutrition function of agricultural biological consists of various products that provide essential plant nutrients and enhance soil quality.
- TYPE - Biofertilizers enhance soil quality by increasing the population of beneficial microorganisms. They help crops absorb nutrients from the environment.
| Keyword | Definition |
|---|---|
| Cash Crops | Cash crops are non-consumable crops sold as a whole or part of the crop to manufacture end-products to make a profit. |
| Integrated Pest Management (IPM) | IPM is an environment-friendly and sustainable approach to control pests in various crops. It involves a combination of methods, including biological controls, cultural practices, and selective use of pesticides. |
| Bacterial biocontrol agents | Bacteria used to control pests and diseases in crops. They work by producing toxins harmful to the target pests or competing with them for nutrients and space in the growing environment. Some examples of commonly used bacterial biocontrol agents include Bacillus thuringiensis (Bt), Pseudomonas fluorescens, and Streptomyces spp. |
| Plant Protection Product (PPP) | A plant protection product is a formulation applied to crops to protect from pests, such as weeds, diseases, or insects. They contain one or more active substances with other co-formulants such as solvents, carriers, inert material, wetting agents or adjuvants formulated to give optimum product efficacy. |
| Pathogen | A pathogen is an organism causing disease to its host, with the severity of the disease symptoms. |
| Parasitoids | Parasitoids are insects that lay their eggs on or within the host insect, with their larvae feeding on the host insect. In agriculture, parasitoids can be used as a form of biological pest control, as they help to control pest damage to crops and decrease the need for chemical pesticides. |
| Entomopathogenic Nematodes (EPN) | Entomopathogenic nematodes are parasitic roundworms that infect and kill pests by releasing bacteria from their gut. Entomopathogenic nematodes are a form of biocontrol agents used in agriculture. |
| Vesicular-arbuscular mycorrhiza (VAM) | VAM fungi are mycorrhizal species of fungus. They live in the roots of different higher-order plants. They develop a symbiotic relationship with the plants in the roots of these plants. |
| Fungal biocontrol agents | Fungal biocontrol agents are the beneficial fungi that control plant pests and diseases. They are an alternative to chemical pesticides. They infect and kill the pests or compete with pathogenic fungi for nutrients and space. |
| Biofertilizers | Biofertilizers contain beneficial microorganisms that enhance soil fertility and promote plant growth. |
| Biopesticides | Biopesticides are natural/bio-based compounds used to manage agricultural pests using specific biological effects. |
| Predators | Predators in agriculture are the organisms that feed on pests and help control pest damage to the crops. Some common predator species used in agriculture include ladybugs, lacewings, and predatory mites. |
| Biocontrol agents | Biocontrol agents are living organisms used to control pests and diseases in agriculture. They are alternatives to chemical pesticides and are known for their lesser impact on the environment and human health. |
| Organic Fertilizers | Organic fertilizer is composed of animal or vegetable matter used alone or in combination with one or more non-synthetically derived elements or compounds used for soil fertility and plant growth. |
| Protein hydrolysates (PHs) | Protein hydrolysate-based biostimulants contain free amino acids, oligopeptides, and polypeptides produced by enzymatic or chemical hydrolysis of proteins, primarily from vegetal or animal sources. |
| Biostimulants/Plant Growth Regulators (PGR) | Biostimulants/Plant Growth Regulators (PGR) are substances derived from natural resources to enhance plant growth and health by stimulating plant processes (metabolism). |
| Soil Amendments | Soil Amendments are substances applied to soil that improve soil health, such as soil fertility and soil structure. |
| Seaweed Extract | Seaweed extracts are rich in micro and macronutrients, proteins, polysaccharides, polyphenols, phytohormones, and osmolytes. These substances boost seed germination and crop establishment, total plant growth and productivity. |
| Compounds related to biocontrol and/or promoting growth (CRBPG) | Compounds related to biocontrol or promoting growth (CRBPG) are the ability of a bacteria to produce compounds for phytopathogen biocontrol and plant growth promotion. |
| Symbiotic Nitrogen-Fixing Bacteria | Symbiotic nitrogen-fixing bacteria such as Rhizobium obtain food and shelter from the host, and in return, they help by providing fixed nitrogen to the plants. |
| Nitrogen Fixation | Nitrogen fixation is a chemical process in soil which converts molecular nitrogen into ammonia or related nitrogenous compounds. |
| ARS (Agricultural Research Service) | ARS is the U.S. Department of Agriculture's chief scientific in-house research agency. It aims to find solutions to agricultural problems faced by the farmers in the country. |
| Phytosanitary Regulations | Phytosanitary regulations imposed by the respective government bodies check or prohibit the importation and marketing of certain insects, plant species, or products of these plants to prevent the introduction or spread of new plant pests or pathogens. |
| Ectomycorrhizae (ECM) | Ectomycorrhiza (ECM) is a symbiotic interaction of fungi with the feeder roots of higher plants in which both the plant and the fungi benefit through the association for survival. |
Need More Details on Market Definition?
Ask a Question
Research Methodology
Mordor Intelligence follows a four-step methodology in all our reports.
- Step-1: Identify Key Variables: In order to build a robust forecasting methodology, the variables and factors identified in Step-1 are tested against available historical market numbers. Through an iterative process, the variables required for market forecast are set and the model is built on the basis of these variables.
- Step-2: Build a Market Model: Market-size estimations for the forecast years are in nominal terms. Inflation is not a part of the pricing, and the average selling price (ASP) is kept constant throughout the forecast period.
- Step-3: Validate and Finalize: In this important step, all market numbers, variables and analyst calls are validated through an extensive network of primary research experts from the market studied. The respondents are selected across levels and functions to generate a holistic picture of the market studied.
- Step-4: Research Outputs: Syndicated Reports, Custom Consulting Assignments, Databases & Subscription Platforms.

Get More Details On Research Methodology
Download PDF


