Automatic Liquid Filling Machine Market Size and Share
Market Overview
| Study Period | 2020 - 2031 |
|---|---|
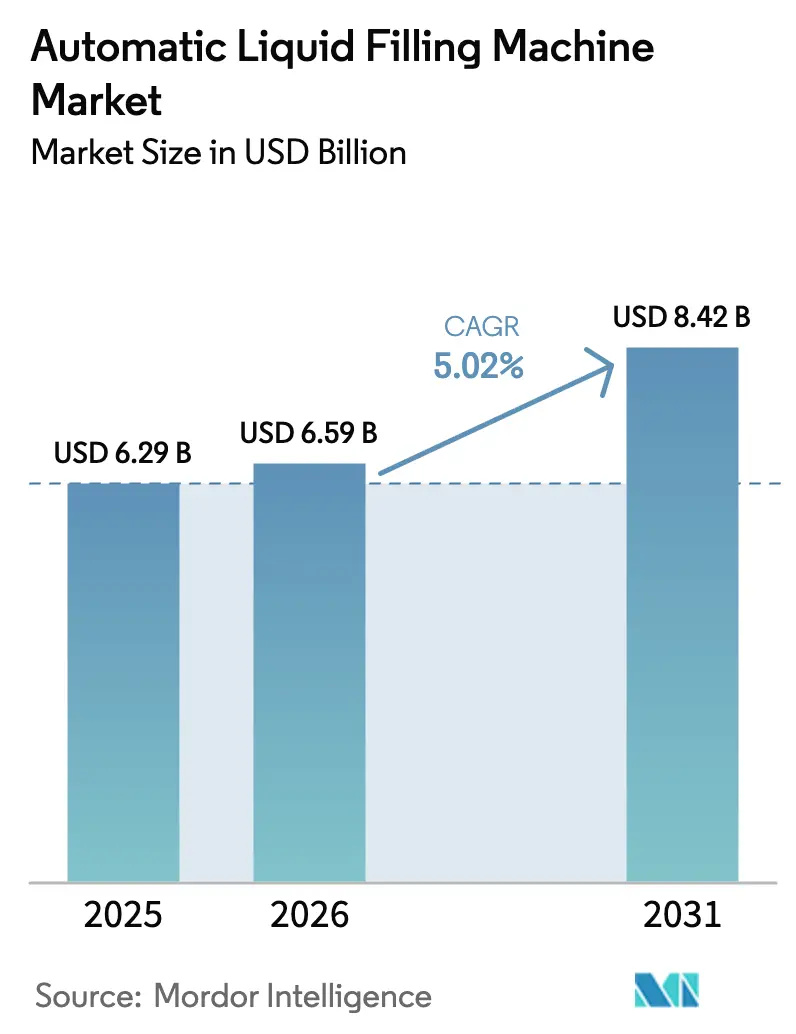
| Market Size (2026) | USD 6.59 Billion |
| Market Size (2031) | USD 8.42 Billion |
| Growth Rate (2026 - 2031) | 5.02% CAGR |
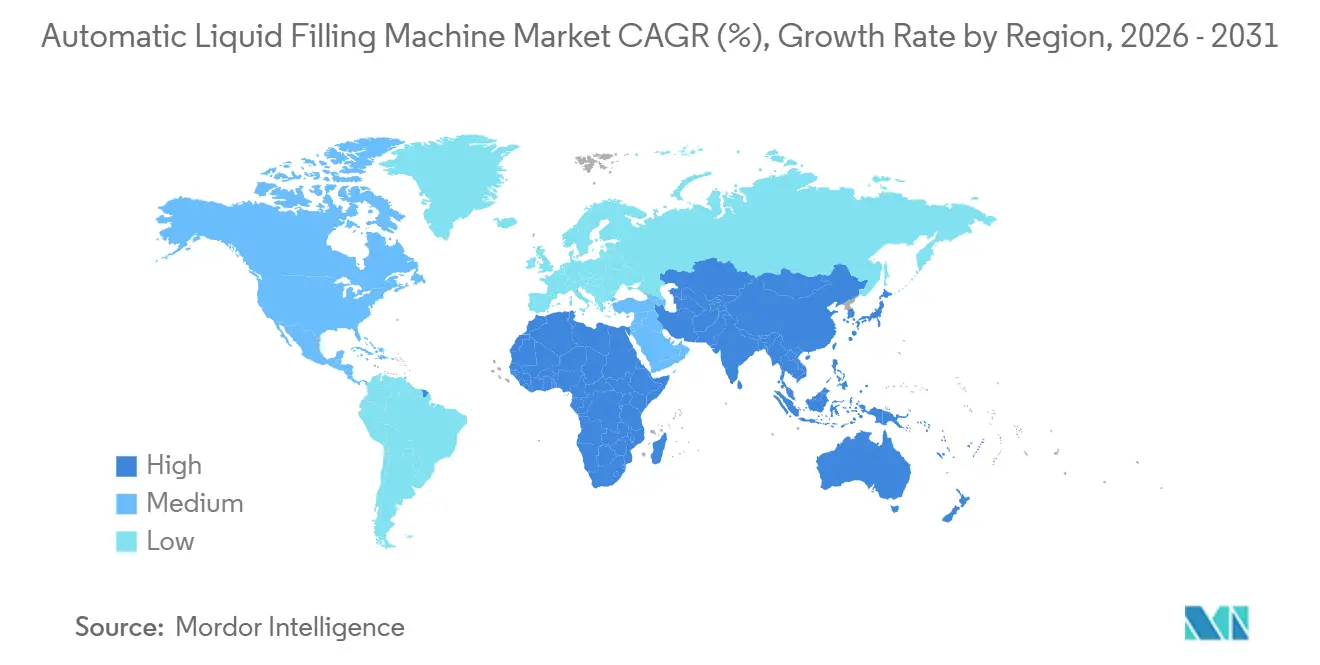
| Fastest Growing Market | Asia Pacific |
| Largest Market | Asia Pacific |
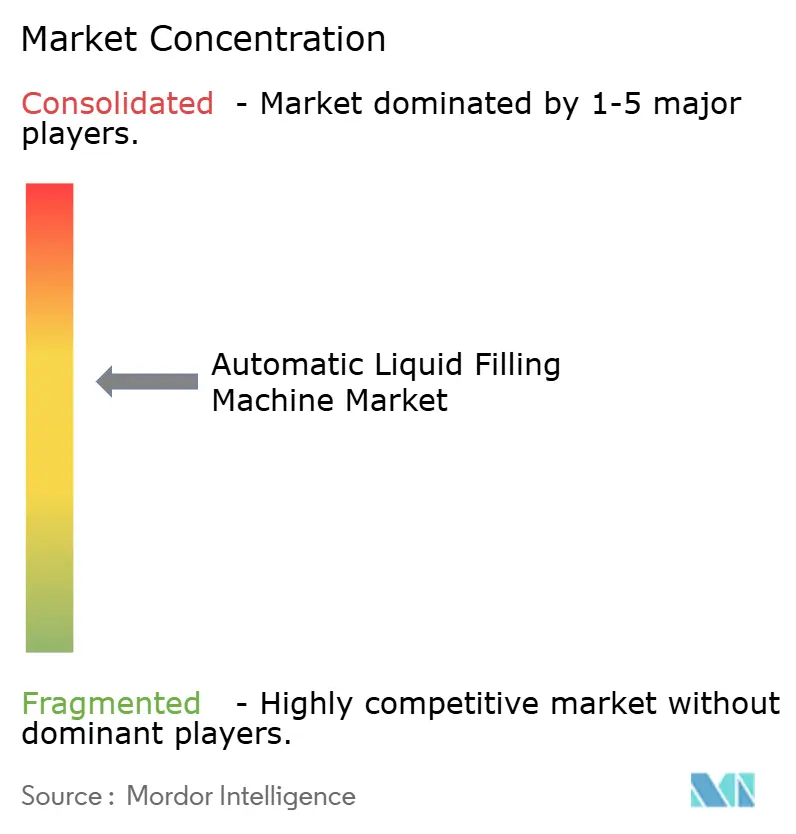
| Market Concentration | Medium |
Major Players *Disclaimer: Major Players sorted in no particular order Image © Mordor Intelligence. Reuse requires attribution under CC BY 4.0. | |
Automatic Liquid Filling Machine Market Analysis by Mordor Intelligence
The automatic liquid filling machine market size was valued at USD 6.29 billion in 2025 and is estimated to grow from USD 6.59 billion in 2026 to reach USD 8.42 billion by 2031, at a CAGR of 5.02% during the forecast period (2026-2031). Demand is accelerating as pharmaceutical firms adopt aseptic processing, beverage brands pivot toward single-serve formats, and contract-packaging partners absorb capital outlays for turnkey equipment. Rotary platforms still dominate high-speed beverage lines, yet isolator-based aseptic systems are scaling quickly as biologics and nutraceutical SKUs migrate to ambient-stable packaging. Digital-twin analytics, edge-based condition monitoring, and blockchain traceability are moving from proof-of-concept to standard equipment specifications, tightening margins for OEMs unable to embed software value. Nickel-price volatility, counterfeit components, and tightening European recycled-content rules are pressuring supply chains, but they are simultaneously nudging buyers toward lightweight PET designs and long-term steel-sourcing contracts.
Key Report Takeaways
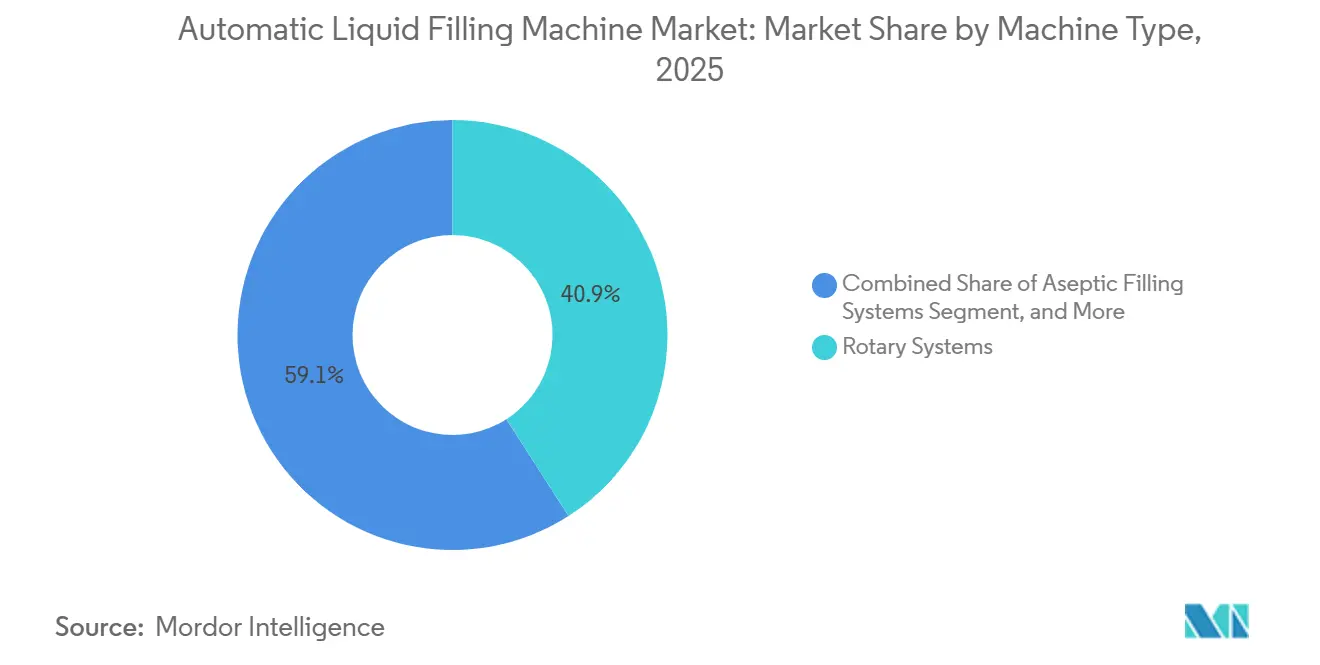
- By machine type, rotary systems commanded 40.93% of the automatic liquid filling machine market share in 2025, while aseptic systems are advancing at a 6.43% CAGR to 2031.
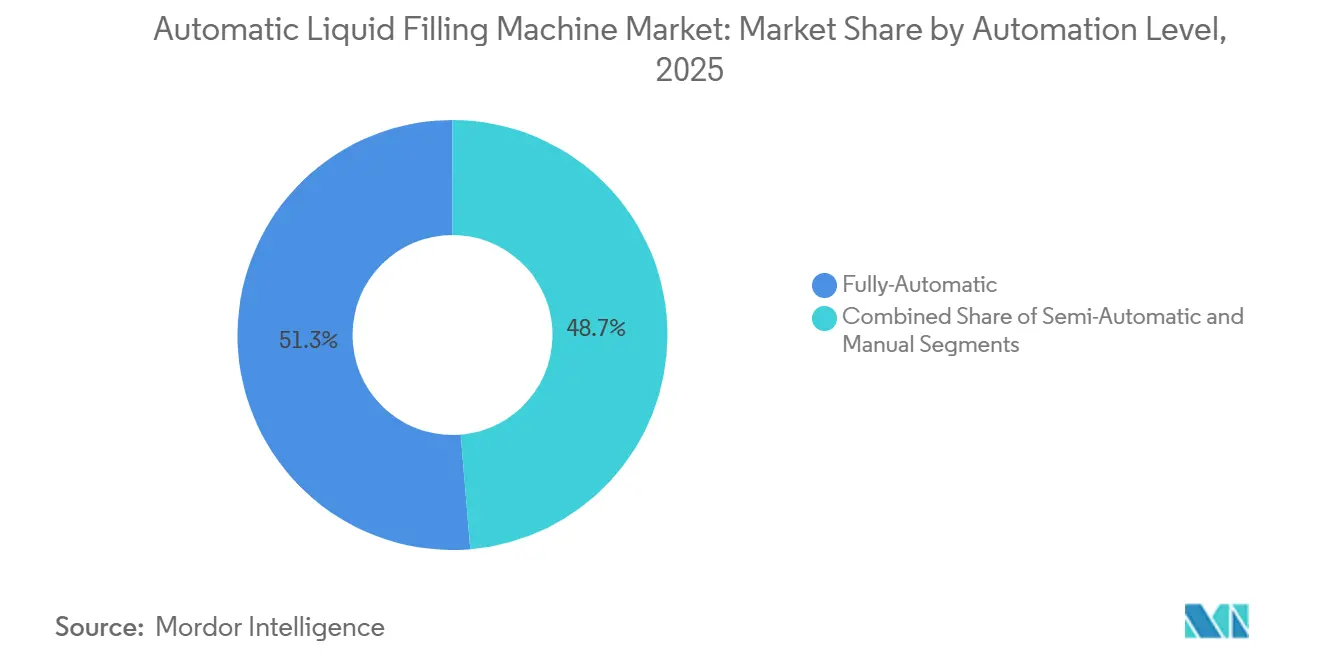
- By automation level, fully-automatic lines held 51.32% market share in 2025 and are projected to expand at a 6.96% CAGR through 2031.
- By filling technology, volumetric platforms accounted for 28.12% share of the automatic liquid filling machine market size in 2025; aseptic and extended-shelf-life configurations are tracking a 6.67% CAGR to 2031.
- By end-user industry, food and beverage captured 45.65% of the share in 2025, while pharmaceutical applications are poised for a 7.12% CAGR expansion through 2031.
- By geography, Asia-Pacific accounted for 39.85% of the market share in 2025 and is on course for a 6.87% CAGR to 2031.
Note: Market size and forecast figures in this report are generated using Mordor Intelligence’s proprietary estimation framework, updated with the latest available data and insights as of January 2026.
Global Automatic Liquid Filling Machine Market Trends and Insights
Drivers Impact Analysis*
| Driver | (~) % Impact on CAGR Forecast | Geographic Relevance | Impact Timeline |
|---|---|---|---|
| Rapid Growth of Single-Serve Packaging Formats | +1.2% | Global, with concentration in North America and Asia-Pacific urban centers | Medium term (2-4 years) |
| Stringent Hygiene Standards Driving Demand for Aseptic Lines | +1.5% | Global, particularly Europe and North America pharmaceutical hubs | Long term (≥ 4 years) |
| Industry 4.0 Retrofits, IoT-Enabled Sensors and Analytics | +1.0% | North America, Europe, and advanced Asia-Pacific manufacturing zones | Medium term (2-4 years) |
| Expansion of Contract Packaging in Emerging Markets | +0.9% | Asia-Pacific core (China, India), spill-over to Middle East and Africa | Long term (≥ 4 years) |
| Sustainability Mandates Favoring Lightweight PET over Glass | +0.8% | Europe (EU PPWR compliance), North America, select Asia-Pacific markets | Long term (≥ 4 years) |
| Shift to Ready-to-Drink Nutraceutical Beverages | +0.7% | Global, with early adoption in North America, Europe, and urban Asia-Pacific | Short term (≤ 2 years) |
| Source: Mordor Intelligence | |||
Stringent Hygiene Standards Driving Demand for Aseptic Lines
Revisions to the United States FDA Annex 1 in 2023 tightened real-time contamination monitoring requirements, pushing pharmaceutical plants to adopt isolator-based fillers that deliver 6-log spore reduction without thermal stress.[1]U.S. Food and Drug Administration, “Guidance for Industry: Sterile Drug Products Produced by Aseptic Processing,” fda.gov In parallel, the European Hygienic Engineering and Design Group updated its 2024 guidelines to mandate tool-free disassembly and sub-0.8 micrometer surface roughness, raising capital outlays but shaving 20% off validation lead times.[2]European Hygienic Engineering and Design Group, “EHEDG Guidelines for Hygienic Equipment Design,” ehedg.org Cold-chain constraints for mRNA vaccines are easing as ambient-stable vial filling gains ground, eliminating refrigerated warehousing costs in remote regions. Beverage processors are also embracing aseptic technology to comply with 3-A sanitary standards that require adenosine triphosphate bioluminescence swabs between shifts. Collectively, these rule changes tip procurement decisions toward turnkey sterile lines, even in segments historically dominated by hot-fill or tunnel-pasteurization equipment.
Industry 4.0 Retrofits, IoT-Enabled Sensors and Analytics
Downtime in pressure-sensitive beverage operations can exceed USD 20,000 per hour, motivating producers to deploy predictive-maintenance suites that flag bearing wear before catastrophic failure. GEA’s digital-twin platform streams torque, vibration, and temperature data from more than 200 embedded sensors and schedules technicians 72 hours ahead of a predicted fault. Aseptic facilities benefit disproportionately, because an unscheduled stop forces a full clean-in-place and sterilization cycle that can idle the line for half a shift. Blockchain-secured batch records are emerging as the serialization backbone for vial and syringe packaging, enabling regulators to scan QR codes and view immutable fill-weight histories. Vision-guided reject systems that run at 1,200 bottles per minute now combine edge AI with hyperspectral cameras to reduce false positives by 15% versus legacy photo-electric sensors.
Sustainability Mandates Favoring Lightweight PET over Glass
Europe’s Packaging and Packaging Waste Regulation sets a 65% recycled-content target for PET bottles by 2030, compelling fillers to handle preforms that are 15% thinner than 2023 baselines.[3]European Commission, “Packaging and Packaging Waste Regulation,” ec.europa.eu Lightweight bottles deform easily under hot-fill vacuum, so OEMs are adding servo-controlled nozzle descent and adaptive grippers that sense wall thickness in real time. Wine and spirits producers, once wary of plastic for branding reasons, now accept PET as consumer research shows 62% of millennials value recyclability over material prestige. Nitrogen-dosing modules restore internal pressure and extend shelf life, thereby enabling ambient distribution of traditionally chilled SKUs and shrinking refrigeration footprints in retail. Extended Producer Responsibility schemes that peg fees to weight provide a further nudge toward thin-wall PET.
Shift to Ready-to-Drink Nutraceutical Beverages
North American launches of collagen, adaptogen, and nootropic drinks exceeded 400 SKUs in 2025, and their heat-sensitive actives rule out conventional hot filling. Fill viscosity varies from water-like electrolyte solutions to gel-thick collagen shots, demanding interchangeable pump heads and ±0.5% dosing precision. Regulatory scrutiny has tightened, with multiple FDA warning letters issued in 2024 for unsubstantiated functional claims, prompting co-packers to install inline near-infrared spectroscopy for potency confirmation. Small-batch aseptic fillers rated below 100 bottles per minute are now a growth niche, especially among startups that lack the volumes to justify high-speed rotary assets.
Restraints Impact Analysis*
| Restraint | (~) % Impact on CAGR Forecast | Geographic Relevance | Impact Timeline |
|---|---|---|---|
| High Up-Front CAPEX for Fully-Automatic Rotary Systems | -0.9% | Global, with acute impact in cost-sensitive emerging markets | Short term (≤ 2 years) |
| Shortage of Skilled Mechatronics Technicians | -0.7% | North America, Europe, advanced Asia-Pacific manufacturing zones | Medium term (2-4 years) |
| Volatility in Stainless-Steel and Electronic-Component Prices | -0.5% | Global, particularly affecting OEMs with fixed-price contracts | Short term (≤ 2 years) |
| Increasing Counterfeit Equipment from Low-Cost Suppliers | -0.3% | Asia-Pacific, Middle East, Africa, and price-sensitive segments globally | Medium term (2-4 years) |
| Source: Mordor Intelligence | |||
High Up-Front CAPEX for Fully-Automatic Rotary Systems
Turnkey rotary aseptic fillers range from USD 1.5 million to USD 4 million, pricing many mid-tier beverage brands out of the market. Lease-financing and equipment-as-a-service contracts blunt the sticker shock but introduce multi-year volume commitments that smaller firms struggle to guarantee. Validation costs in pharmaceutical lines add another 20% to 30% on top of hardware, and currency swings escalate costs where invoices are pegged to EUR or USD. OEMs have responded with modular inline systems priced between USD 300,000 and USD 600,000 that allow incremental capacity adds, but the throughput trade-off remains significant for high-volume SKUs.
Shortage of Skilled Mechatronics Technicians
Industry surveys in 2025 found that 71% of respondents already face production disruptions from unfilled mechatronics roles, and projections indicate 2 million vacancies by 2033. Modern fillers integrate PLC coding, servo tuning, and hygienic design skills not fully addressed in most vocational curricula. Augmented-reality headsets now overlay repair steps to free less-experienced staff for first-line service, yet complex aseptic seal swaps still demand certified experts whose dispatch times have lengthened from 24 hours in 2023 to 72 hours in 2026. This bottleneck erodes overall equipment effectiveness and raises the allure of remote diagnostic suites embedded by top-tier OEMs.
*Our forecasts treat driver/restraint impacts as directional, not additive. The impact forecasts reflect baseline growth, mix effects, and variable interactions.
Segment Analysis
By Machine Type: Aseptic Systems Capture Growth Momentum
Aseptic platforms are advancing at a 6.43% annual clip through 2031 as pharmaceutical and premium-beverage producers opt for ambient-stable SKUs that bypass cold-chain costs, while rotary systems retained 40.93% of automatic liquid filling machine market share in 2025 by virtue of unmatched throughput in carbonated soft drinks. Inline and linear machines remain popular among craft breweries and specialty-food plants operating 20-plus SKUs per week because straight-line layouts reduce footprint by 25% and accelerate sanitation. Monobloc rinse-fill-cap designs appeal to dairy processors whose clean-in-place cycles must finish within 45 minutes to sustain three-shift campaigns.
Isolator-equipped fillers aimed at pre-filled syringes now feature robotic nest loading and automated stopper placement that remove human intervention from Grade A zones. GEA’s modular aseptic platform unveiled in 2025 permits tool-free swaps between rotary-piston and peristaltic heads, trimming validation windows to six weeks. Inline equipment, though slower, satisfies clinical-trial runs of 500 to 1,000 units where the ability to pause mid-batch for sampling is critical. Convergence of ISO 13485, ISO 22716, and FDA 21 CFR Part 11 standards is steering even cosmetic brands toward hygienic-by-design architectures with negligible dead legs and fingertip-safe change parts.


By Filling Technology: Precision and Sterility Converge
Volumetric systems secured 28.12% of the share in 2025 because piston or magnetic flowmeter dosing maintains accuracy when product density varies, whereas gravimetric lines need constant recalibration. Aseptic and extended-shelf-life configurations are charting a 6.67% CAGR as consumer demand for preservative-free beverages coincides with FDA sterile-processing incentives. Pressure and isobaric fillers dominate carbonated-drink plants to conserve CO₂, while gravity equipment is losing ground in wine and spirits to vacuum designs that eliminate foaming and meet ±1 milliliter tolerance contracts.
Overflow fillers still rule clear spirits and cooking oils because the “spill-back” guarantees a level meniscus, a key visual quality cue on retail shelves. Pharmaceutical blow-fill-seal units are carving a niche for single-use ophthalmic droppers by integrating container molding, filling, and sealing in a single sterile chamber, reducing particulate contamination by 90% compared with vial-filling lines. Vacuum technology is expanding in nutraceuticals, where oxygen-sensitive omega-3 oils require nitrogen headspace flushing executed in a single evacuation-and-fill stroke that would otherwise need two steps on traditional gravity machines.
By Automation Level: Full Automation Gains as Labor Tightens
Fully-automatic solutions held 51.32% of the share in 2025 and should expand at 6.96% per year through 2031 as labor scarcity and wage inflation shorten payback to 18 months in Western economies. Semi-automatic lines maintain relevance in artisanal spirits and boutique cosmetics by allowing operators to toggle between bottle sizes without expensive format parts. Manual filling lingers only in premium hand-numbered perfumes or pharmacy compounding, but is fading as even small businesses shift to benchtop semi-automatics that curb repetitive-strain injuries.
In regions where hourly wages stay below USD 5, semi-automatic machines still dominate, yet global brand owners increasingly write automation roadmaps into supplier contracts. Retrofit Industry 4.0 kits priced between USD 50,000 and USD 100,000 can lift a semi-automatic carousel to near-automatic data-logging performance, fulfilling FDA Part 11 batch-record mandates without a full line replacement. As edge analytics become standard, the functional divide between automation tiers is narrowing, but only fully-automatic gear complies effortlessly with electronic audit-trail expectations.
By End-User Industry: Pharmaceuticals Accelerate on Biologics Wave
Food and beverage commanded 45.65% of share in 2025, but pharmaceuticals are registering a 7.12% CAGR through 2031, spurred by the biologics pipeline and demand for pre-filled syringes under ISO 13485 oversight. Cosmetics manufacturers are specifying viscosity-adaptive piston fillers that handle micellar waters through thick body butters without shear damage. Chemicals and lubricants form a steady but slower-growing vertical where ATEX-rated enclosures add 30-40% to capital cost, yet remain mandatory for flammable solvents.
Personalized-medicine trends drive ultra-small-batch aseptic machines rated at 10-50 vials per minute, a territory previously ignored by high-speed OEMs. mRNA vaccines require 2-8 °C environments, so jacketed product bowls and condensation-free nozzle designs are becoming standard. Food-grade nitrogen dosing now appears in dairy alternatives and cold-brew coffee lines, stripping oxygen to achieve clean-label shelf life without chemical preservatives. ISO 22716 cosmetic regulations are pushing indie beauty brands to adopt semi-automatic fillers with electronic batch logging years ahead of earlier projections.
Geography Analysis
Asia-Pacific secured 39.85% of the share in 2025 and is forecast to expand at 6.87% annually to 2031 thanks to China’s dual-circulation manufacturing push and India’s pharmaceutical export ambitions. Contract-packaging clusters around Shanghai and Pune absorbed more than USD 1 billion of filling equipment in 2024 as multinational beverages and injectables localized production. Japan’s aging society is fueling demand for compact aseptic fillers that slot into space-constrained urban plants, while South Korea’s cosmetics giants apply AI vision systems to detect micro-bubbles in cushion compacts, slicing consumer returns by 40%. Australia’s wine exporters are migrating from glass to lightweight PET, driving servo-controlled nozzle retrofits that handle thinner walls without scuffing.
North America maintains a solid base driven by pharma cold-chain expansions and craft-beverage proliferation. FDA Part 11 rules are forcing contract manufacturers to swap legacy semi-automatic machines for fully-automatic models that auto-record fill weights and operator IDs. Canada’s cannabis-infused drinks sector, valued at USD 200 million in 2025, mandates aseptic lines that preserve tetrahydrocannabinol stability via nitrogen headspace flushing, while Mexico’s near-shoring binge attracted USD 500 million in bottling investments by late 2025 to serve both domestic and United States export channels. Safe Quality Food certification is effectively compulsory for co-packers seeking shelf space in leading North American retailers.
Europe posts steady growth led by sustainability and pharmaceutical innovation corridors in Germany, Switzerland, and Ireland. The European Packaging and Packaging Waste Regulation’s recycled-content mandate drives PET lightweighting projects, compelling fillers to integrate near-infrared resin-sorting modules. Germany’s machinery cluster exported USD 1.2 billion of aseptic systems in 2024, with Syntegon and Groninger supplying high-potency biologics facilities abroad. Post-Brexit dual-compliance burdens lengthen validation for United Kingdom fillers, but modular equipment capable of quick reconfiguration is carving a niche in this environment. Middle East and Africa represent high-growth frontiers; Saudi Vision 2030 funnels capital into turnkey beverage plants favoring aseptic formats, and Nigerian dairy cooperatives have begun shifting from manual pouches to semi-automatic fillers to meet surging urban demand.

Competitive Landscape
The automatic liquid filling machine market features moderate concentration. GEA, KHS, and Syntegon dominate premium turnkey segments by bundling filling, capping, labeling, and palletizing under unified warranties, while Filamatic, Accutek, and Inline Filling Systems target craft beverage and clinical-trial niches with modular lines priced about 40% below integrated platforms. ProMach’s 2024 buyout of Zalkin merged capping and filling under one roof, cutting format-changeover downtime by 30% and strengthening its small-lot competitiveness. GEA’s 2025 digital-twin rollout monetizes predictive uptime services valued at roughly USD 500,000 per plant in annual lost-production avoidance.
Patent filings show a pivot to interchangeable sterile-barrier modules that let operators swap filling heads without breaching the aseptic envelope, slashing validation from 12 weeks to six. Chinese entrants sell rotary lines at half the European price, but, lacking CE marks and ISO 9001 traceability, their penetration into regulated food and pharma export markets remains limited. ISO 9001 and EHEDG compliance is therefore becoming table stakes for supplier qualification, even in price-sensitive geographies.
White-space upside persists in Africa and Southeast Asia, where beverage-security mandates encourage local assembly partnerships. Personalized-medicine facilities needing sub-100-unit lot flexibility also represent an under-served micro-segment. As software-driven services account for a growing slice of margin, OEMs unable to add value through predictive analytics or remote validation risk commoditization.
Automatic Liquid Filling Machine Industry Leaders
GEA Group AG
KHS GmbH
ProMach, Inc.
Syntegon Technology GmbH
JBT Corporation
- *Disclaimer: Major Players sorted in no particular order

Recent Industry Developments
- February 2026: Syntegon opened a USD 15 million Waiblingen, Germany, expansion adding 5,000 m² of cleanroom space for aseptic vial-filling lines and a customer-experience center that trims on-site commissioning time by 25%.
- January 2026: KHS partnered with Siemens Digital Industries to embed edge-analytics into Innofill rotary platforms, extending mean time between failures by 35% for 24/7 beverage operations.
- December 2025: JBT Corporation acquired a European aseptic-technology specialist for USD 45 million, integrating hydrogen-peroxide vapor-phase sterilization that achieves 6-log spore reduction on heat-sensitive dairy proteins.
- November 2025: GEA commissioned a USD 20 million pharmaceutical technology center in Ahaus, Germany, showcasing modular aseptic lines with blockchain-enabled batch traceability via QR code.


Global Automatic Liquid Filling Machine Market Report Scope
The automatic liquid filling machine market refers to the global industry segment that manufactures and supplies equipment capable of automatically dispensing liquid products into bottles, jars, or other containers with minimal human intervention. It covers market size, growth projections, technological innovations, regional trends, and competitive dynamics. The study also examines factors influencing adoption, such as hygiene standards, sustainability requirements, and integration with smart manufacturing systems.
The Automatic Liquid Filling Machine Market Report is Segmented by Machine Type (Rotary Systems, Inline/Linear Systems, Monobloc Filling-Capping Systems, and Aseptic Filling Systems), Filling Technology (Volumetric, Gravity, Pressure/Isobaric, Vacuum, Overflow, and Aseptic/ESL), Automation Level (Fully-Automatic, Semi-Automatic, and Manual), End-User Industry (Food and Beverage, Pharmaceuticals, Cosmetics and Personal Care, Chemicals and Lubricants, and Other End-User Industries), and Geography (North America, South America, Europe, Asia-Pacific, and Middle East and Africa). The Market Forecasts are Provided in Terms of Value (USD).
| Rotary Systems |
| Inline / Linear Systems |
| Monobloc Filling-Capping Systems |
| Aseptic Filling Systems |
| Volumetric |
| Gravity |
| Pressure / Isobaric |
| Vacuum |
| Overflow |
| Aseptic / ESL |
| Fully-Automatic |
| Semi-Automatic |
| Manual |
| Food and Beverage |
| Pharmaceuticals |
| Cosmetics and Personal Care |
| Chemicals and Lubricants |
| Other End-User Industries |
| North America | United States | |
| Canada | ||
| Mexico | ||
| South America | Brazil | |
| Argentina | ||
| Chile | ||
| Rest of South America | ||
| Europe | United Kingdom | |
| Germany | ||
| France | ||
| Italy | ||
| Spain | ||
| Rest of Europe | ||
| Asia-Pacific | China | |
| India | ||
| Japan | ||
| South Korea | ||
| Australia | ||
| Rest of Asia-Pacific | ||
| Middle East and Africa | Middle East | Saudi Arabia |
| United Arab Emirates | ||
| Turkey | ||
| Rest of Middle East | ||
| Africa | South Africa | |
| Nigeria | ||
| Rest of Africa | ||
| By Machine Type | Rotary Systems | ||
| Inline / Linear Systems | |||
| Monobloc Filling-Capping Systems | |||
| Aseptic Filling Systems | |||
| By Filling Technology | Volumetric | ||
| Gravity | |||
| Pressure / Isobaric | |||
| Vacuum | |||
| Overflow | |||
| Aseptic / ESL | |||
| By Automation Level | Fully-Automatic | ||
| Semi-Automatic | |||
| Manual | |||
| By End-User Industry | Food and Beverage | ||
| Pharmaceuticals | |||
| Cosmetics and Personal Care | |||
| Chemicals and Lubricants | |||
| Other End-User Industries | |||
| By Geography | North America | United States | |
| Canada | |||
| Mexico | |||
| South America | Brazil | ||
| Argentina | |||
| Chile | |||
| Rest of South America | |||
| Europe | United Kingdom | ||
| Germany | |||
| France | |||
| Italy | |||
| Spain | |||
| Rest of Europe | |||
| Asia-Pacific | China | ||
| India | |||
| Japan | |||
| South Korea | |||
| Australia | |||
| Rest of Asia-Pacific | |||
| Middle East and Africa | Middle East | Saudi Arabia | |
| United Arab Emirates | |||
| Turkey | |||
| Rest of Middle East | |||
| Africa | South Africa | ||
| Nigeria | |||
| Rest of Africa | |||


Key Questions Answered in the Report
How fast is the automatic liquid filling machine market projected to expand from 2026 to 2031?
It is forecast to grow at a 5.02% CAGR, rising from USD 6.59 billion in 2026 to USD 8.42 billion by 2031.
Which machine type is growing the quickest within automatic liquid filling solutions?
Aseptic systems are leading, with a 6.43% annual pace predicted through 2031 as brands seek sterile, ambient-stable packaging.
Why are fully-automatic lines gaining preference over semi-automatic alternatives?
Persistent labor shortages and higher operator wages are shrinking payback periods to around 18 months in high-income regions.
What regional market is expected to deliver the highest growth to 2031?
Asia-Pacific, already holding 39.85% share in 2025, is advancing at a 6.87% CAGR because of contract-packaging hubs in China and India.
Which end-user vertical shows the strongest CAGR outlook?
Pharmaceutical applications are expanding at 7.12% annually, fueled by biologics and pre-filled syringe demand under stringent GMP rules.
How are sustainability regulations influencing equipment design?
Europe’s 65% recycled-PET mandate is driving servo-controlled, lightweight-bottle fillers that handle thinner preforms without sacrificing accuracy.
Page last updated on:


