Powder Filling Equipment Market Size and Share
Market Overview
| Study Period | 2020 - 2031 |
|---|---|
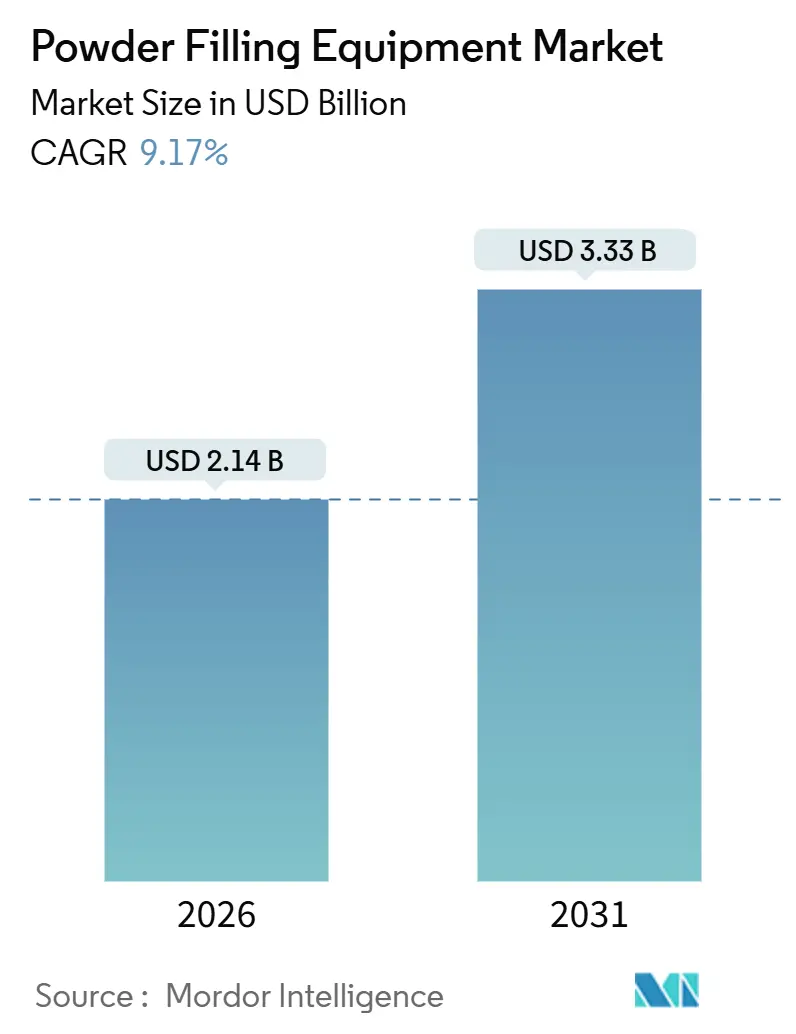
| Market Size (2026) | USD 2.14 Billion |
| Market Size (2031) | USD 3.33 Billion |
| Growth Rate (2026 - 2031) | 9.17% CAGR |
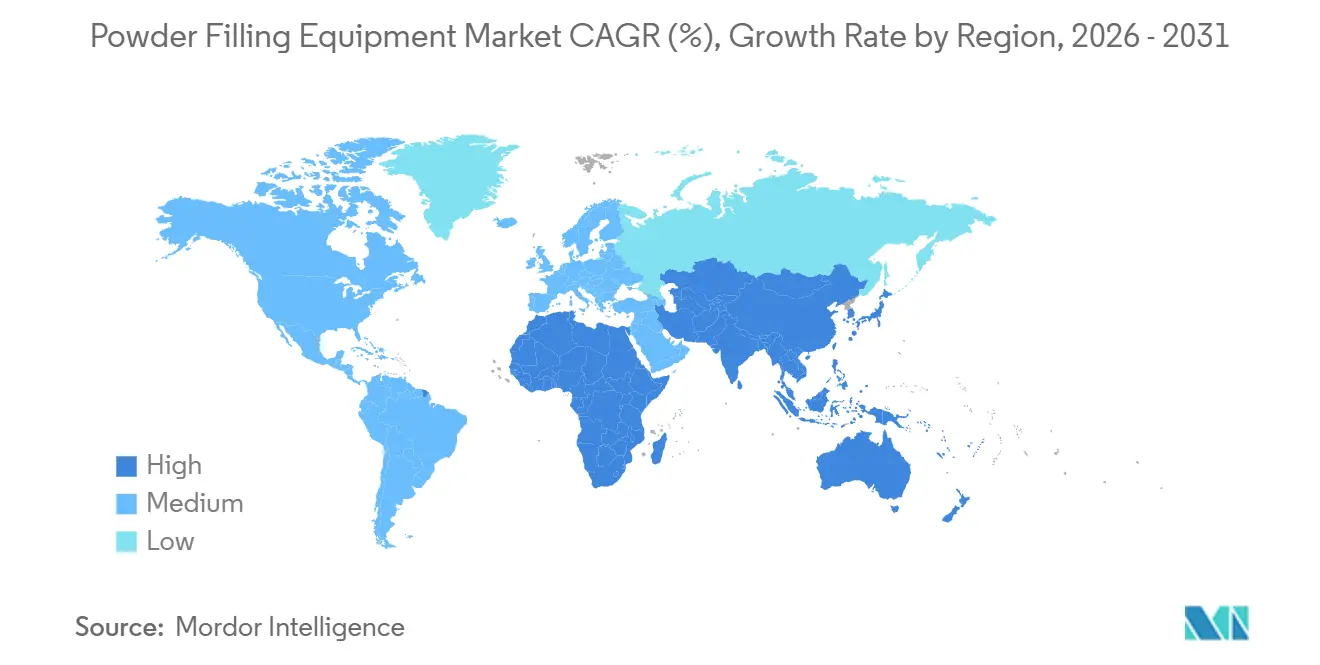
| Fastest Growing Market | Asia Pacific |
| Largest Market | Asia Pacific |
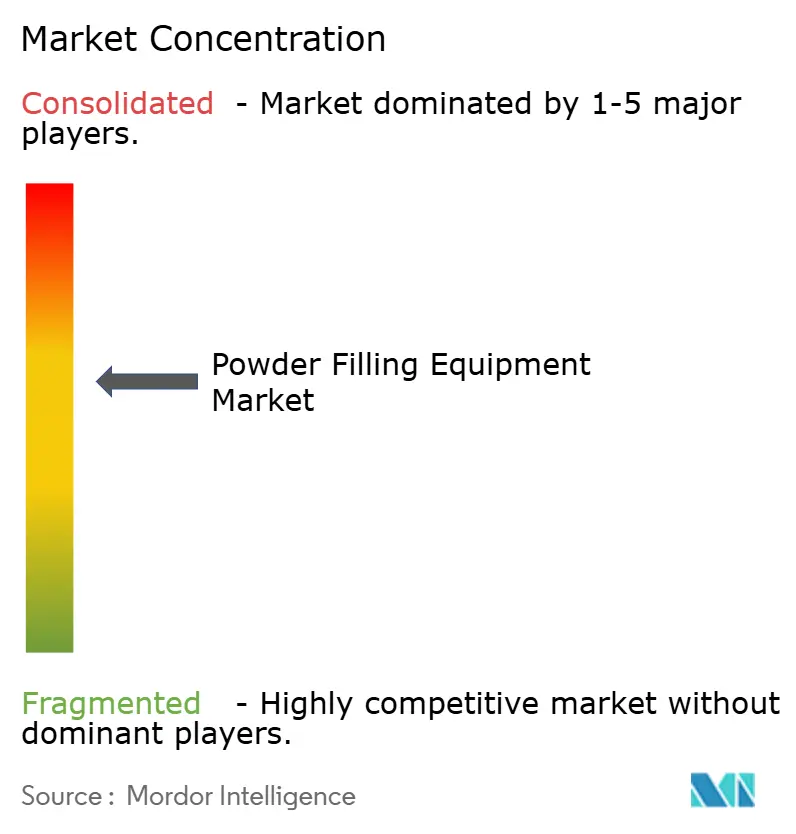
| Market Concentration | Medium |
Major Players
*Disclaimer: Major Players sorted in no particular order Image © Mordor Intelligence. Reuse requires attribution under CC BY 4.0. |
|
Powder Filling Equipment Market Analysis by Mordor Intelligence
The powder filling equipment market size reached USD 2.14 billion in 2026 and is projected to advance to USD 3.33 billion by 2031, reflecting a 9.17% CAGR. Growth stems from pharmaceutical continuous manufacturing mandates, the adoption of single-dose nutraceutical packaging, and capacity additions at contract manufacturing organizations, collectively reshaping capital spending. Regulatory encouragement for real-time release testing increases demand for gravimetric and aseptic fillers, while the European Union's Packaging and Packaging Waste Regulation prompts food, cosmetics, and nutraceutical producers to adopt mono-material sachets, which necessitate the retrofitting of existing lines. The Asia-Pacific region leads new installations, as India, Vietnam, and Indonesia capture formulation and packaging capacity that is migrating from China. Meanwhile, North America and Europe prioritize smart-factory retrofits, which extend the life of installed tablet presses.
Key Report Takeaways
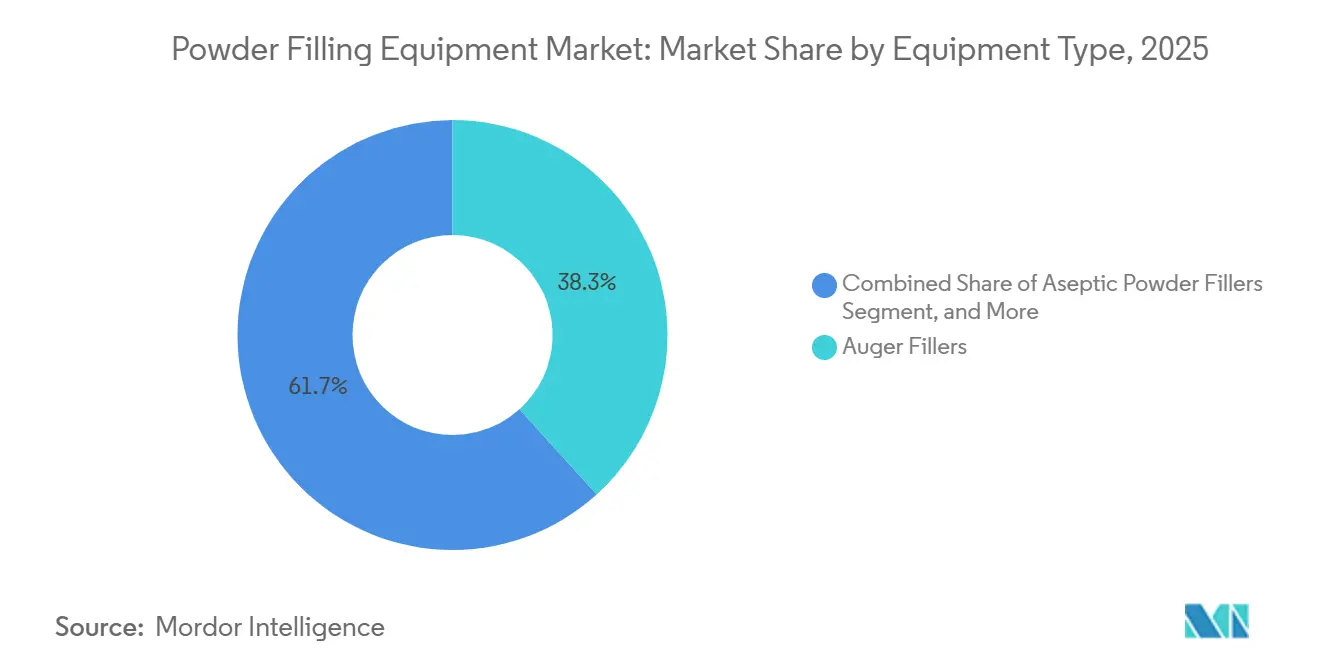
- By equipment type, auger fillers captured 38.29% of the powder filling equipment market share in 2025.
- By filling technology, the powder filling equipment market size for hybrid is projected to grow at a 12.05% CAGR between 2026–2031.
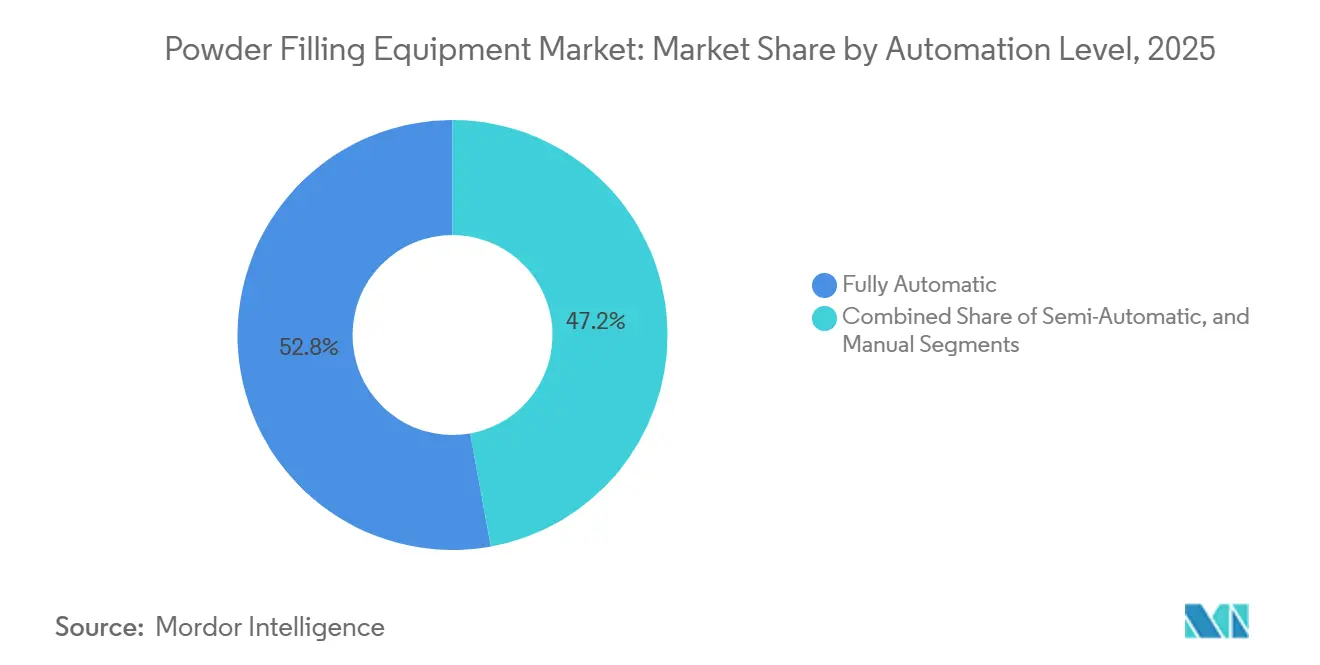
- By automation level, fully automatic lines captured 52.84% of the powder filling equipment market share in 2025.
- By end-user, the powder filling equipment market size for nutraceutical applications is projected to grow at a 12.32% CAGR from 2026 to 2031.
- By geography, the Asia-Pacific captured 34.17% of the powder filling equipment market share in 2025.
Global Powder Filling Equipment Market Trends and Insights
Drivers Impact Analysis*
| Driver | (~) % Impact on CAGR Forecast | Geographic Relevance | Impact Timeline |
|---|---|---|---|
| Surge in demand for single-dose nutraceutical packaging | +1.8% | Global, with early adoption in North America, Europe, and urban Asia-Pacific markets | Medium term (2-4 years) |
| Rapid expansion of Contract Manufacturing Organizations (CMOs) | +2.1% | Asia-Pacific core (India, China, Singapore), spill-over to the Middle East and Eastern Europe | Short term (≤ 2 years) |
| Shift toward fully automated continuous manufacturing lines | +1.5% | North America and EU pharmaceutical hubs, select Asia-Pacific sites | Long term (≥ 4 years) |
| Growth of smart factory retrofit projects in legacy pharma plants | +1.2% | Europe and North America brownfield sites, emerging in Japan and South Korea | Medium term (2-4 years) |
| Rising adoption of recyclable mono-material packaging formats | +1.4% | EU (PPWR mandate), North America (brand-led), Asia-Pacific following | Medium term (2-4 years) |
| Emerging markets' investment in food-fortification programs | +1.1% | Sub-Saharan Africa, South Asia, Southeast Asia, Latin America | Long term (≥ 4 years) |
| Source: Mordor Intelligence | |||
Surge in Demand for Single-Dose Nutraceutical Packaging
E-commerce brands favor lightweight stickpacks and sachets because parcel rates depend on volumetric weight, making portion-controlled formats more economical. Contract manufacturers report a 30% to 40% decrease in customer acquisition costs after switching from 30-day tubs to seven-day trial sachets. Equipment suppliers respond with rapid-changeover auger and net-weight fillers engineered to prevent cross-contamination of hygroscopic collagen peptides, electrolytes, and probiotics. Cold-chain requirements further lift demand for aseptic or modified-atmosphere lines that protect temperature-sensitive microbiota. Cleanroom-grade installations in the United Kingdom illustrate how nutraceutical producers adopt pharmaceutical best practices to secure export approvals and premium pricing. The net effect is a sustained increase in capital expenditure for flexible, high-speed lines that can switch among multiple powder formulations without lengthy downtime.
Rapid Expansion of Contract Manufacturing Organizations
Patent cliffs, biosimilar competition, and innovators’ focus on discovery fuel a wave of outsourcing that sends fill-finish work to the Asia-Pacific region. Multi-site operators announcing nine-figure investments require modular lines that handle batches from 10 kg to 500 kg while meeting FDA 21 CFR Part 11 and EU Annex 1 electronic record standards. India’s labor-cost edge and improving regulatory alignment position the country as the fastest-growing CMO hub, while plants across Singapore and Eastern Europe serve niche biologics and high-potency APIs. CMOs equipped with gravimetric fillers capable of sub-milligram dosing command price premiums of 20% to 30% because orphan-drug sponsors demand extreme accuracy and containment.
Shift Toward Fully Automated Continuous Manufacturing Lines
FDA guidance endorsing real-time release testing legitimizes continuous oral solid dosage production, prompting pharmaceutical manufacturers to retrofit or replace batch equipment. Gravimetric feeders, which provide live load-cell feedback, integrate with in-line blending and tablet presses, reducing work-in-process inventory by up to 80%.[1]Mettler-Toledo International Inc., "How to Use Gravimetric Dosing for Added Efficiency," mt.com Capital outlays range from USD 1 million to USD 3 million per line, yet savings from shorter cycle times and reduced rework yield a payback period of under four years for high-volume generics. Adoption remains concentrated in North America and Europe because emerging markets face shortages of engineers trained in statistical process control, and regulators still rely on conventional end-product testing.
Rising Adoption of Recyclable Mono-Material Packaging Formats
European legislation requires all packaging to be recyclable or reusable by 2030, accelerating migration from multi-layer laminates to mono-material paper or polyethylene sachets. Paper options have a coefficient of friction three to five times higher than polyethylene, which increases the risk of jamming at speeds above 200 units per minute. OEMs now fit vibratory feeders and electrostatic-discharge grounding systems to maintain throughput and comply with bans on per- and polyfluoroalkyl substances. Brands accept material cost increases of EUR 0.02 to EUR 0.05 (USD 0.022 to USD 0.055) per unit in exchange for double-digit gains in consumer perception of sustainability. Vendors proving compatibility with paper-based sachets are gaining preference during European and North American line upgrades.
Restraints Impact Analysis*
| Restraint | (~) % Impact on CAGR Forecast | Geographic Relevance | Impact Timeline |
|---|---|---|---|
| Volatile stainless steel and servo-motor prices | -0.9% | Global, with an acute impact in Asia-Pacific and South America, where currency hedging is limited | Short term (≤ 2 years) |
| High validation costs for pharma Grade A clean-room equipment | -1.2% | North America, Europe, and regulated Asia-Pacific markets (Japan, South Korea, Singapore) | Medium term (2-4 years) |
| Shortage of skilled maintenance technicians | -0.7% | Global, most severe in North America and Western Europe | Long term (≥ 4 years) |
| Stringent energy-efficiency mandates in the EU | -0.5% | EU member states, with early adoption in Germany, France, Netherlands | Medium term (2-4 years) |
| Source: Mordor Intelligence | |||
Volatile Stainless-Steel and Servo-Motor Prices
Nickel supply disruptions and energy-cost inflation drove 18% to 25% swings in 304 and 316 stainless prices between 2024 and early 2025. Servo motors similarly fluctuate due to semiconductor shortages and tightening quotas for rare-earth magnets. End-users facing capital cost hikes of 8% to 12% often defer purchases, lengthening decision cycles, especially in India, Brazil, and Mexico, where hedging tools are limited. European OEMs absorb price spikes through long-term contracts, whereas smaller fabricators pass costs directly to customers, widening pricing dispersion.
High Validation Costs for Pharma Grade A Clean-Room Equipment
Installation, operational, and performance qualifications add USD 150,000 to USD 500,000 per aseptic line, extending commissioning by six to twelve months. Small biotech firms must also invest in isolators, rapid microbial detection systems, and quality assurance staff, which raises the total cost of ownership by 15% to 20% compared to non-sterile alternatives. FDA’s emphasis on design-of-experiments and statistical process control introduces another USD 50,000 to USD 100,000 in upfront engineering costs. European Medicines Agency particle-count limits and real-time environmental monitoring further elevate equipment complexity, deterring generics manufacturers focused on high-volume, low-margin products.
*Our forecasts treat driver/restraint impacts as directional, not additive. The impact forecasts reflect baseline growth, mix effects, and variable interactions.
Segment Analysis
By Equipment Type: Aseptic Fillers Lead Innovation
Auger fillers accounted for 38.29% of the powder filling equipment industry in 2025. Aseptic powder fillers, although smaller in installed base, are forecast to grow at a 11.57% CAGR, as biologics, lyophilized vaccines, and high-potency APIs require sterile filling with Occupational Exposure Band 5 containment. Robotic vial-transfer systems, capable of achieving 3,000 units per hour with 100% in-process weight control, exemplify the shift toward flexible, high-containment platforms that minimize operator exposure.
Modular platforms accommodating interchangeable dosing heads reduce line-changeover from four hours to under one hour, a capability that contract manufacturers value for multi-product campaigns. Regulatory guidelines on process validation favor gravimetric and hybrid systems that provide real-time weight verification and electronic batch records, creating 10% to 15% price premiums for validated equipment. India and China prioritize auger and volumetric fillers for cost-sensitive generics, whereas Japan and South Korea invest in aseptic and gravimetric systems to serve innovator pharmaceutical clients.


By Filling Technology: Hybrid Systems Gain Traction
Gravimetric filling technology accounted for 46.92% of the powder filling equipment market in 2025, driven by the demand for dose accuracy within ±1% and electronic batch record compliance in the pharmaceutical and nutraceutical sectors. Hybrid systems combining volumetric pre-dosing with gravimetric verification are expanding at a 12.05% CAGR, delivering 20% to 30% higher throughput than pure gravimetric fillers while maintaining accuracy within ±2 %. Continuous gravimetric dosing feeders, capable of handling throughputs ranging from 50 grams per hour to 250 kilograms per hour, feature real-time load-cell feedback, demonstrating scalability across laboratory, pilot, and production scales.
Gravimetric fillers excel with low-bulk-density, hygroscopic, or electrostatic powders such as collagen peptides, lyophilized biologics, and titanium dioxide, where volumetric dosing suffers from bridging and rat-holing. Hybrid architecture delivers 80% to 90% of the target weight at high speed via volumetric auger, then completes the fill with gravimetric top-up, reducing cycle time by 15% to 25% compared to pure gravimetric filling. North America and Europe heavily tilt toward gravimetric methods in pharmaceutical applications, while the Asia-Pacific region exhibits a balanced mix, with volumetric systems dominating in the food and cosmetics industries.
By Automation Level: Labor Shortages Propel Full Automation
Fully automatic powder filling lines captured 52.84% of the powder filling equipment market size in 2025 and are forecast to grow at 11.43% CAGR through 2031, propelled by labor shortages in North America and Western Europe, where manufacturing technician vacancies exceed 8% and wage inflation runs at 4% to 6% annually. Semi-automatic systems that require manual container loading and capping serve mid-sized contract manufacturers and emerging-market generics producers, where labor costs remain below USD 5 per hour, and capital constraints limit the use of robotic handling. Manual filling persists in artisanal food, cosmetics, and compounding pharmacy applications where batch sizes fall below 50 kilograms and regulatory requirements are minimal.
A fully automatic line with robotic vial handling, in-line weight verification, and automated reject mechanisms reduces labor requirements by 60% to 75%, while improving the first-pass yield from 92% to 98%. Integrated blister lines, capable of achieving 600 blisters per minute and 350 cartons per minute, demonstrate the operational leverage of integrated automation through Venturi-based vacuum systems, which reduce energy consumption by 45%.[2]Romaco Holding GmbH, "Sustainable - from powder to pallet," Manufacturing Chemist, manufacturingchemist.com Payback periods range from 2.5 to 4 years in high-wage markets, shortening to under two years when factoring in quality improvements and reduced rework. Semi-automatic systems retain a role in contract manufacturing where product mix changes weekly, and the flexibility to manually adjust fill volumes outweighs labor costs.
By End-user Industry: Nutraceuticals Outpace Pharma Growth
Pharmaceuticals accounted for 31.62% of powder filling equipment demand in 2025, driven by the growth in generics volume and the addition of biosimilar fill-finish capacity. However, nutraceuticals are advancing at a 12.32% CAGR, as direct-to-consumer brands adopt single-dose sachets and stickpacks for protein powders, electrolytes, and personalized vitamin blends. Chemicals covering industrial powders, catalysts, and specialty additives remain a stable but slow-growth segment where bulk handling and explosion-proof equipment dominate.
Pharmaceutical demand remains anchored by patent expirations and biosimilar approvals; however, growth is decelerating as innovator companies outsource fill-finish operations to contract manufacturers and focus capital on discovery and clinical development. Food and beverage applications are transitioning from bulk tubs to single-serve sachets, driven by the increasing demand for on-the-go consumption and portion control. Instant coffee capsules and protein powder stickpacks now account for over 30% of category revenue in developed markets.
Geography Analysis
The Asia-Pacific region held a 34.17% market share of the powder filling equipment market in 2025 and is forecast to grow at a 12.84% CAGR through 2031, driven by pharmaceutical export ambitions in India, contract manufacturing expansion in China and Southeast Asia, and food fortification programs in South Asia and Sub-Saharan Africa. India's pharmaceutical sector aims to achieve USD 60 billion to USD 65 billion in exports by 2030, with contract development and manufacturing organizations capturing a growing share of global fill-finish work as China-plus-one supply chain diversification accelerates. China's active pharmaceutical ingredient price war has led to a shift in formulation and packaging capacity to India, Vietnam, and Indonesia, where labor costs are 15% to 25% lower and regulatory frameworks align with International Council for Harmonisation guidelines. Japan and South Korea exhibit slower growth as mature pharmaceutical markets.
North America represented the second-largest regional market in 2025, with growth concentrated in contract manufacturing and nutraceutical segments. FDA priorities for advanced manufacturing and continuous processing create incentives for pharmaceutical companies to retrofit legacy batch lines with gravimetric dosing and real-time release testing, a USD 1 million to USD 3 million investment per line that extends equipment life by five to seven years. The United States also benefits from nearshoring trends, as pharmaceutical and nutraceutical brands establish fill-finish capacity in Texas, North Carolina, and Puerto Rico to reduce reliance on Asian supply chains and shorten lead times. Canada's pharmaceutical sector is smaller but growing, driven by biosimilar approvals and cannabis-derived powder formulations.
The European Union Packaging and Packaging Waste Regulation, as well as the Energy Efficiency Directive, compel food, cosmetics, and pharmaceutical producers to replace multi-layer laminate packaging with mono-material formats and install energy-monitoring systems on their filling lines. Germany, France, and Italy lead in pharmaceutical equipment installations, while the United Kingdom and the Netherlands are hubs for nutraceutical contract manufacturing. Eastern Europe, particularly Poland and the Czech Republic, attracts significant investments in pharmaceutical and food manufacturing due to lower labor costs and proximity to Western European markets. South America's market is emerging, with Brazil and Argentina leading the way in food fortification programs and the production of generic pharmaceuticals. Argentina's Incentive Regime for Large Investments offers customs exemptions and tax benefits for projects exceeding USD 200 million, creating potential for large-scale pharmaceutical and food manufacturing facilities.[3]EY Global, "Argentina publishes decree implementing Incentive Regime for Large Investments," ey.com

Competitive Landscape
The powder filling equipment market remains fragmented, with no single vendor commanding more than 15% of the global share. This is due to customer requirements spanning pharmaceutical cGMP compliance, food safety certifications, and chemical explosion-proof standards, which favor specialized suppliers over generalists. European machinery specialists such as IMA, Syntegon, Marchesini, and Romaco compete on modular line integration, service networks spanning 50-plus countries, and deep expertise in aseptic and high-containment filling, while North American players, including All-Fill, Spee-Dee, and Cozzoli, emphasize compact footprints, rapid changeover, and price points 20% to 30% below European equivalents.
IMA Group reported nine-month 2024 revenue of EUR 1.532 billion (approximately USD 1.678 billion), with strong performance in the pharmaceutical and nutraceutical segments driven by investments in automation and digitalization. White-space opportunities exist in hybrid filling systems that combine volumetric speed with gravimetric accuracy, targeting mid-sized contract manufacturers unwilling to sacrifice throughput for precision. Emerging disruptors leverage robotics and digital twins, with robotic systems achieving near-zero waste for high-value drugs via independent robotic control and 100% in-process weight verification, a capability that commands 25% to 35% premiums over conventional filling lines.
GEA Group's Q3 2024 revenue of EUR 1.33 billion (USD 1.46 billion) reflects its focus on food and beverage applications, where sustainability and energy efficiency are key priorities for multinational brands. JBT Corporation's USD 3.5 billion acquisition of Marel in 2024 consolidates food-processing equipment portfolios and creates cross-selling opportunities in protein powder and instant food applications. Smaller vendors, such as 3P Innovation and Chemspeed Technologies, target laboratory and pilot-scale applications with gravimetric micro-dosing platforms capable of sub-milligram accuracy, serving biotech companies that develop orphan drugs and personalized medicines.
Powder Filling Equipment Industry Leaders
-
IMA S.p.A.
-
Syntegon Technology GmbH
-
Marchesini Group S.p.A.
-
All-Fill, Inc.
-
Spee-Dee Packaging Machinery, Inc.
- *Disclaimer: Major Players sorted in no particular order

Recent Industry Developments
- September 2025: Volkmann GmbH introduced the VFD 100 vibratory feeder, a compact, modular system designed for precise weighing, dosing, and feeding of powders and granulates. The system features integrated load-cell technology, enabling loss-in-weight dosing control and accuracy within a few grams.
- May 2025: Romaco Innojet introduced the IGL 100 granulation line, a production-scale, multipurpose system that combines high-shear mixing, fluid bed drying, fluid bed granulation, fluid bed pellet coating, and hot-melt coating in a single unit.
- April 2025: DEC Group announced the PTS Batchmixer, a fully automated, closed-in-line powder blending system that utilizes vacuum and pressure dense-phase transfer, featuring no rotating or moving parts in the main tank.
- February 2025: Mettler-Toledo published guidance on gravimetric dosing for continuous oral solid dosage manufacturing, highlighting feeders with throughput ranging from 50 grams per hour to 250 kilograms per hour, and emphasizing that micro-component API dosing requires gravimetric accuracy that is unattainable with volumetric alternatives.


Global Powder Filling Equipment Market Report Scope
The powder filling equipment market refers to the segment of industrial machinery designed to accurately dispense and package powdered products into containers such as bottles, jars, pouches, or cans. These machines ensure precise dosing, minimize product wastage, and maintain hygiene standards during the filling process.
The Powder Filling Equipment Market Report is Segmented by Equipment Type (Auger Fillers, Vacuum Fillers, Net-Weight Fillers, Cup Fillers, and Aseptic Powder Fillers), Filling Technology (Volumetric, Gravimetric, and Hybrid), Automation Level (Fully-Automatic, Semi-Automatic, and Manual), End-user Industry (Food and Beverage, Pharmaceuticals, Cosmetics and Personal Care, Nutraceuticals, Chemicals, and Other End-user Industries), and Geography (North America, South America, Europe, Asia-Pacific, Middle East and Africa). The Market Forecasts are Provided in Terms of Value (USD).
| Auger Fillers |
| Vacuum Fillers |
| Net-Weight Fillers |
| Cup Fillers |
| Aseptic Powder Fillers |
| Volumetric |
| Gravimetric |
| Hybrid |
| Fully Automatic |
| Semi-Automatic |
| Manual |
| Food and Beverage |
| Pharmaceuticals |
| Cosmetics and Personal Care |
| Nutraceuticals |
| Chemicals |
| Other End-user Industries |
| North America | United States | |
| Canada | ||
| Mexico | ||
| South America | Brazil | |
| Argentina | ||
| Chile | ||
| Rest of South America | ||
| Europe | United Kingdom | |
| Germany | ||
| France | ||
| Italy | ||
| Spain | ||
| Rest of Europe | ||
| Asia-Pacific | China | |
| India | ||
| Japan | ||
| South Korea | ||
| Australia | ||
| Rest of Asia-Pacific | ||
| Middle East and Africa | Middle East | Saudi Arabia |
| United Arab Emirates | ||
| Turkey | ||
| Rest of Middle East | ||
| Africa | South Africa | |
| Nigeria | ||
| Rest of Africa | ||
| By Equipment Type | Auger Fillers | ||
| Vacuum Fillers | |||
| Net-Weight Fillers | |||
| Cup Fillers | |||
| Aseptic Powder Fillers | |||
| By Filling Technology | Volumetric | ||
| Gravimetric | |||
| Hybrid | |||
| By Automation Level | Fully Automatic | ||
| Semi-Automatic | |||
| Manual | |||
| By End-user Industry | Food and Beverage | ||
| Pharmaceuticals | |||
| Cosmetics and Personal Care | |||
| Nutraceuticals | |||
| Chemicals | |||
| Other End-user Industries | |||
| By Geography | North America | United States | |
| Canada | |||
| Mexico | |||
| South America | Brazil | ||
| Argentina | |||
| Chile | |||
| Rest of South America | |||
| Europe | United Kingdom | ||
| Germany | |||
| France | |||
| Italy | |||
| Spain | |||
| Rest of Europe | |||
| Asia-Pacific | China | ||
| India | |||
| Japan | |||
| South Korea | |||
| Australia | |||
| Rest of Asia-Pacific | |||
| Middle East and Africa | Middle East | Saudi Arabia | |
| United Arab Emirates | |||
| Turkey | |||
| Rest of Middle East | |||
| Africa | South Africa | ||
| Nigeria | |||
| Rest of Africa | |||


Key Questions Answered in the Report
What is the projected value by 2031?
The global powder filling equipment market is forecast to reach USD 3.33 billion by 2031, expanding at a 9.17% CAGR from USD 2.14 billion in 2026.
Which region is growing fastest?
The Asia-Pacific region is projected to grow at a 12.84% CAGR through 2031, outpacing all other regions, driven by pharmaceutical export ambitions in India and the expansion of contract manufacturing across Southeast Asia.
What drives demand for aseptic fillers?
Aseptic powder fillers are forecast to grow at 11.57% CAGR as biologics, lyophilized vaccines, and high-potency APIs require sterile filling with Occupational Exposure Band 5 containment.
Why are fully automatic lines gaining share?
Labor shortages in North America and Western Europe, where manufacturing technician vacancies exceed 8% and wage inflation ranges from 4% to 6% annually, propel fully automatic lines to an 11.43% CAGR.
Which end-user segment is expanding fast?
Nutraceuticals are advancing at a 12.32% CAGR, surpassing pharmaceuticals, as direct-to-consumer brands adopt single-dose sachets and stickpacks for protein powders, electrolytes, and personalized vitamin blends.
What restrains capital investment?
Volatile stainless-steel and servo-motor prices, which experienced swings of 18% to 25% between 2024 and early 2025, add 8% to 12% to equipment capital expenditure and defer purchase decisions.
Page last updated on:


