
Artificial Organ Market Size and Share
Market Overview
| Study Period | 2020 - 2031 |
|---|---|
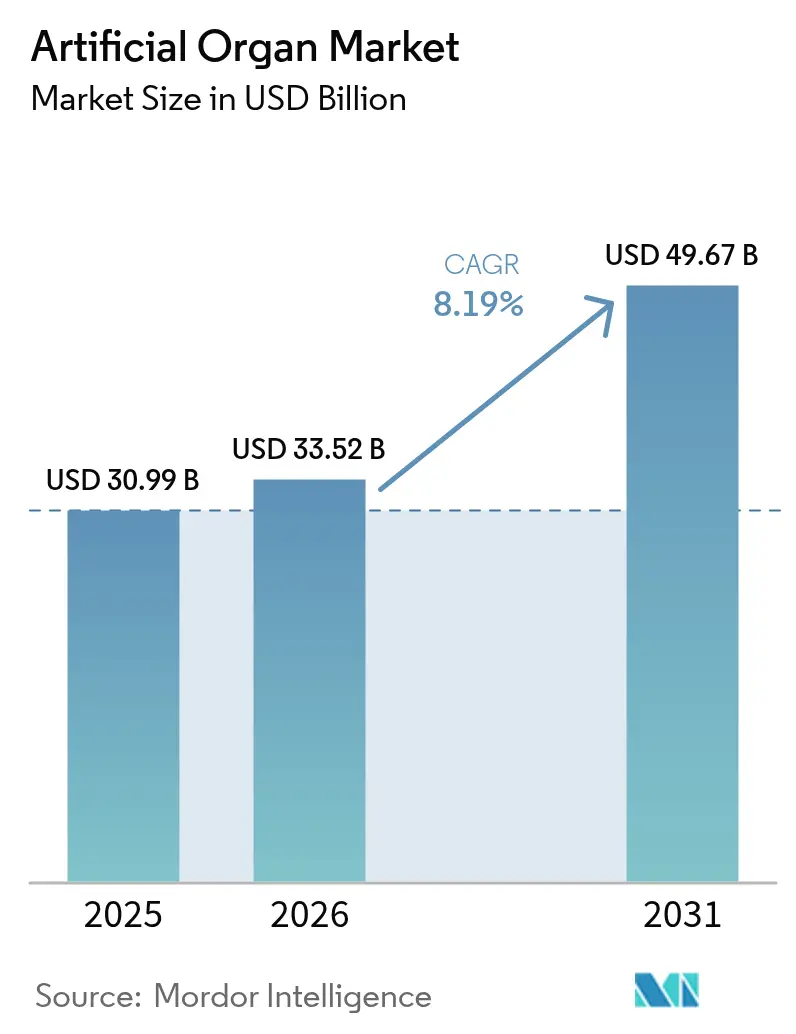
| Market Size (2026) | USD 33.52 Billion |
| Market Size (2031) | USD 49.67 Billion |
| Growth Rate (2026 - 2031) | 8.19 % |
| Fastest Growing Market | Asia Pacific |
| Largest Market | North America |
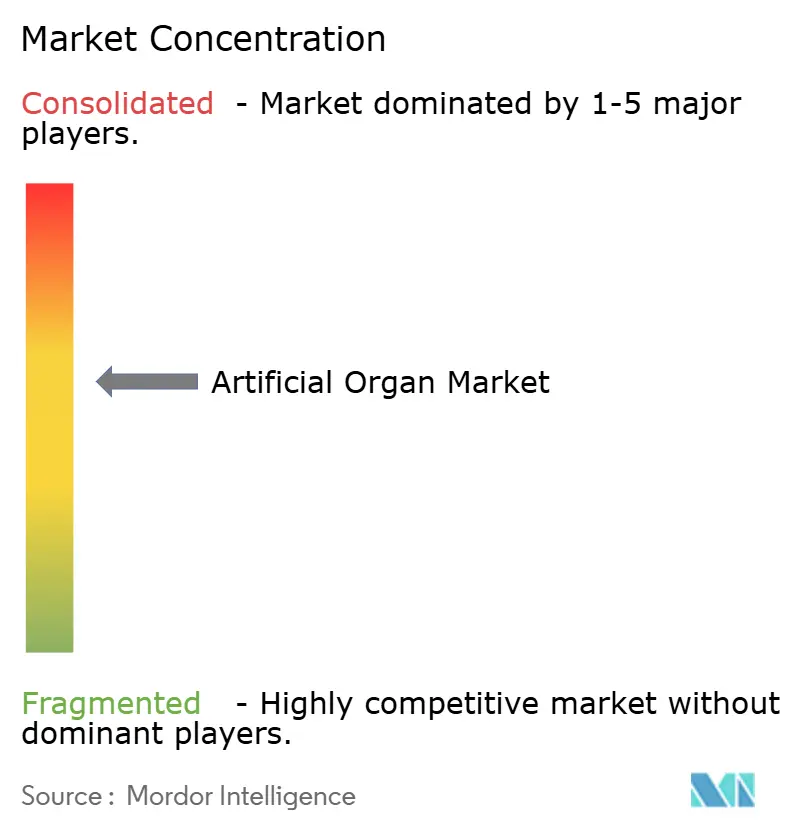
| Market Concentration | Medium |
Major Players
*Disclaimer: Major Players sorted in no particular order Image © Mordor Intelligence. Reuse requires attribution under CC BY 4.0. |
|
Artificial Organ Market Analysis by Mordor Intelligence
The artificial organs market size in 2026 is estimated at USD 33.52 billion, growing from 2025 value of USD 30.99 billion with 2031 projections showing USD 49.67 billion, growing at 8.19% CAGR over 2026-2031. Strong demand stems from the rapid rise in chronic kidney disease, heart failure, diabetes and respiratory disorders, all of which strain existing donor-organ supply. Breakthroughs in biocompatible materials, nano-scale fluid management and wireless sensors have lifted product reliability, eased implantation and improved long-term patient outcomes. Shifts in reimbursement policies, especially the introduction of accelerated approval routes for breakthrough devices, are shortening time-to-market while rewarding designs that cut hospital stays[1]U.S. House of Representatives Committee on Small Business, “Stifling Innovation hearing v05 06 2024,” congress.gov. Home-based care models, powered by remote monitoring platforms, are expanding clinical reach beyond large hospitals and enabling personalized therapy adjustments. Together, these forces position the artificial organs market for durable double-digit growth through the decade.
Key Report Takeaways
- By organ type, artificial kidney devices led with 56.42% of artificial organs market share in 2025, while the wearable artificial kidney segment is forecast to grow at 13.85% CAGR to 2031.
- By technology, mechanical solutions accounted for 66.15% revenue in 2025; electronic and bionic systems are projected to expand at 10.74% CAGR through 2031.
- By fixation method, fully implantable devices captured 73.18% of artificial organs market size in 2025, whereas externally worn systems are advancing at 15.12% CAGR from 2026-2031.
- By end user, hospitals with more than 300 beds held 67.24% share of artificial organs market size in 2025, home-care settings are set to register a 12.08% CAGR through 2031.
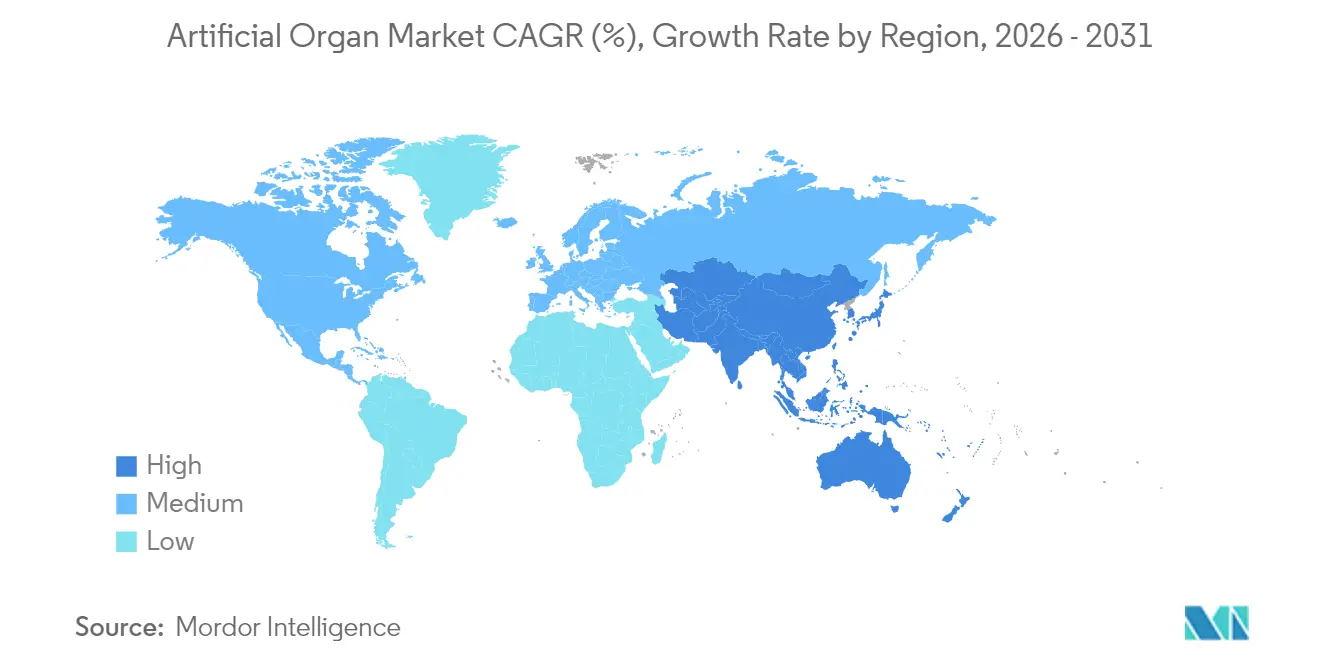
- By geography, North America accounted for a dominant 44.32% share of the artificial organs market in 2025. Meanwhile, the Asia-Pacific region is projected to achieve a robust 11.92% CAGR by 2031.
Note: Market size and forecast figures in this report are generated using Mordor Intelligence’s proprietary estimation framework, updated with the latest available data and insights as of 2026.
Market Trends and Insights
Drivers Impact Analysis of Artificial Organ Market*
| Driver | (~) % Impact on CAGR Forecast | Geographic Relevance | Impact Timeline |
|---|---|---|---|
| Increasing prevalence of chronic diseases and organ failure | +3.2% | North America, Europe, global | Long term (≥ 4 years) |
| Rising investment in research and development | +2.1% | North America, Europe, Japan, South Korea | Medium term (2-4 years) |
| Shortage of donor organs and ethical concerns | +1.8% | Global | Long term (≥ 4 years) |
| Growing aging population globally | +1.5% | Japan, Western Europe, North America, China | Long term (≥ 4 years) |
| Advancements in Technology and Biocompatibility | +2.4% | North America, Europe, advanced Asian economies | Medium term (2-4 years) |
| Patient Preference for Improved Quality of Life | +1.7% | Global, higher impact in developed regions | Medium term (2-4 years) |
| Source: Mordor Intelligence | |||
Increasing Prevalence of Chronic Diseases and Organ Failure
Kidney, cardiac and pulmonary diseases are climbing at rates that outpace organ donation, with 35.5 million adults in the United States already living with chronic kidney disease[2]Centers for Disease Control and Prevention, “Chronic Kidney Disease in the United States, 2023,” cdc.gov. End-stage renal disease treatment costs the US Medicare program USD 130 billion each year, pushing stakeholders toward durable artificial alternatives. Epidemiological modeling projects that up to 16.5% of the population in eight large economies will have chronic kidney disease by 2032, inflating dialysis demand by more than 75%. Similar pressures surface in cardiology, where a widening gap between listed transplant candidates and available hearts has pushed total artificial heart implant volume beyond 2,000 patients to date. As such, clinical urgency is directly feeding artificial organs market adoption.
Rising Investment in Research and Development
Federal grants, public-private alliances and venture capital are accelerating product pipelines. The National Institutes of Health awarded USD 459,824 in 2024 to refine the Wearable Artificial Kidney system, validating sustained public-sector support. Large med-tech firms are buying or partnering with niche innovators to gain access to 4D bioprinting and magnetically levitated pumps, while the broader biotechnology segment is forecast to reach USD 3.2 trillion by 2030. Capital is concentrating on miniaturization, hemocompatible coatings and AI-enabled control algorithms, key differentiators in the artificial organs market.
Shortage of Donor Organs and Ethical Concerns
Waiting lists extend by months whenever supply shrinks, with a 10% rise in the kidney list lengthening average wait by four months. Ethical debates on allocation fairness and xenotransplantation are pushing clinicians toward fully synthetic routes. Total artificial heart systems such as SynCardia and next-generation devices from CARMAT or BiVACOR address immediate life-threat scenarios without immunosuppression, boosting confidence among surgeons and payers.
Growing Aging Population Globally
Population aging is most pronounced in Japan, Western Europe and parts of China, regions where organ failure incidence escalates sharply after age-65. Older patients often present comorbidities that complicate donor organ compatibility, positioning long-duration mechanical circulatory support and implantable artificial kidney devices as essential. As life expectancy rises and birth rates fall, healthcare systems re-prioritize funding toward chronic-care technologies, effectively expanding the artificial organs market footprint.
Restraints Impact Analysis of Artificial Organ Market*
| Restraint | (~) % Impact on CAGR Forecast | Geographic Relevance | Impact Timeline |
|---|---|---|---|
| High cost of artificial organs and procedures with limited reimbursement | −1.9% | Global, stronger in emerging markets | Medium term (2-4 years) |
| Device longevity and biocompatibility issues | −1.2% | Global | Short term (≤ 2 years) |
| Limited awareness and skilled healthcare professionals | −0.8% | Asia-Pacific, Latin America, Africa | Medium term (2-4 years) |
| Complex Surgical Procedures | −1.1% | Global, higher impact in regions with limited healthcare infrastructure | Medium term (2-4 years) |
| Source: Mordor Intelligence | |||
High Cost of Artificial Organs and Procedures Coupled with Limited Reimbursement Options
Total artificial hearts can exceed USD 200,000 per implant, and reimbursement frameworks vary widely, especially in low-income economies. Payers often require extensive real-world evidence before assigning permanent billing codes, slowing uptake. Trade groups now lobby regulators to formalize payment pathways, as outlined in a 2025 AI Policy Roadmap that calls on Medicare to reward life-cycle cost savings. Innovative value-based contracts are beginning to emerge but remain too scarce to offset near-term pricing pressure on the artificial organs market.
Device Longevity and Biocompatibility Issues
Thrombosis, infection and early material failure create revision risk and add cost. Research on nitric-oxide-releasing surfaces and hydrophilic coatings shows progress, yet many next-generation lungs, pancreases and liver constructs are still limited to investigational use. Longer-term durability evidence is critical for surgeons and insurers before routine deployment can accelerate.
*Our forecasts treat driver/restraint impacts as directional, not additive. The impact forecasts reflect baseline growth, mix effects, and variable interactions.
Artificial Organ Market Segment Analysis
By Organ Type:
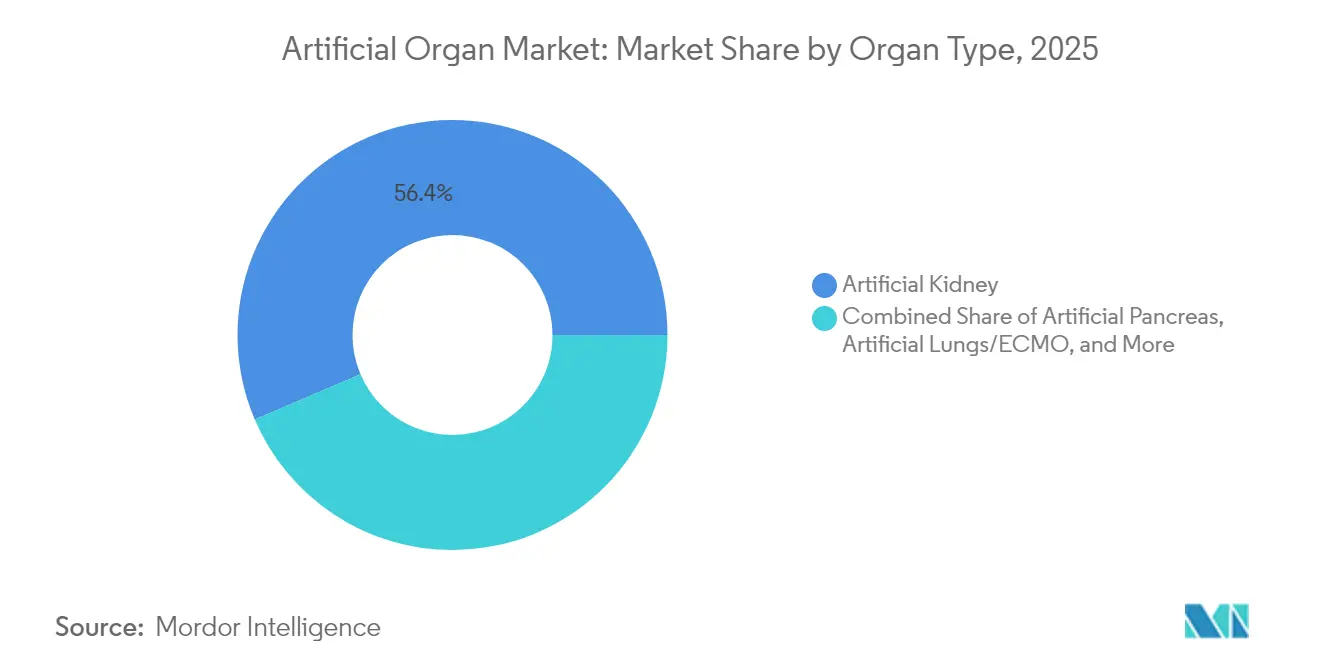
Artificial Kidney Dominates While Wearable Solutions SurgeThe artificial kidney segment generated 56.42% of artificial organs market revenue in 2025, driven by the expanding chronic kidney disease population and the entrenched dialysis ecosystem. Growing preference for continuous renal replacement in outpatient settings keeps device utilization high. The artificial organs market size for wearable kidney systems is forecast to climb at a 13.85% CAGR from 2026-2031, supported by portable nanoelectrokinetic modules that permit 8-10 hours of daily mobility. Early clinical studies highlight improved patient satisfaction when therapy shifts from clinic-bound sessions to ambulatory self-care.
Clinicians are also trialing combined toxin removal and hormone-replacement cartridges, broadening indications beyond end-stage disease. Artificial pancreases are next in line, benefiting from mature continuous glucose monitors and closed-loop insulin pumps. Meanwhile, artificial lungs gained visibility during the COVID-19 crisis, and bio-artificial liver prototypes target acute fulminant hepatic failure. Together, these innovations diversify revenue streams and reduce reliance on a single dominant organ segment within the artificial organs market.



By Technology:
Mechanical Solutions Lead While Electronic Innovations AccelerateMechanical platforms held 66.15% of 2025 revenue due to established clinical protocols and proven safety profiles. Dialysis machines, membrane oxygenators and centrifugal pumps remain hospital workhorses. Yet electronic and bionic architectures are scaling fast, and this sub-segment is predicted to grow at 10.74% CAGR through 2031. Smart sensors, closed-loop software and on-board power management allow dynamic flow regulation and real-time clot detection, properties now expected in premium cardiac support devices. As a result, hospital purchasing criteria increasingly consider connectivity and AI analytics, a shift that places electronic innovators at the center of artificial organs market momentum.
Vision-guided 4D bioprinting sits at the frontier, promising personalized soft-tissue grafts with microvascular networks. Success here would bring fully cellularized organs closer to mass-customization, bridging mechanical and biological paradigms.
By Fixation Method:
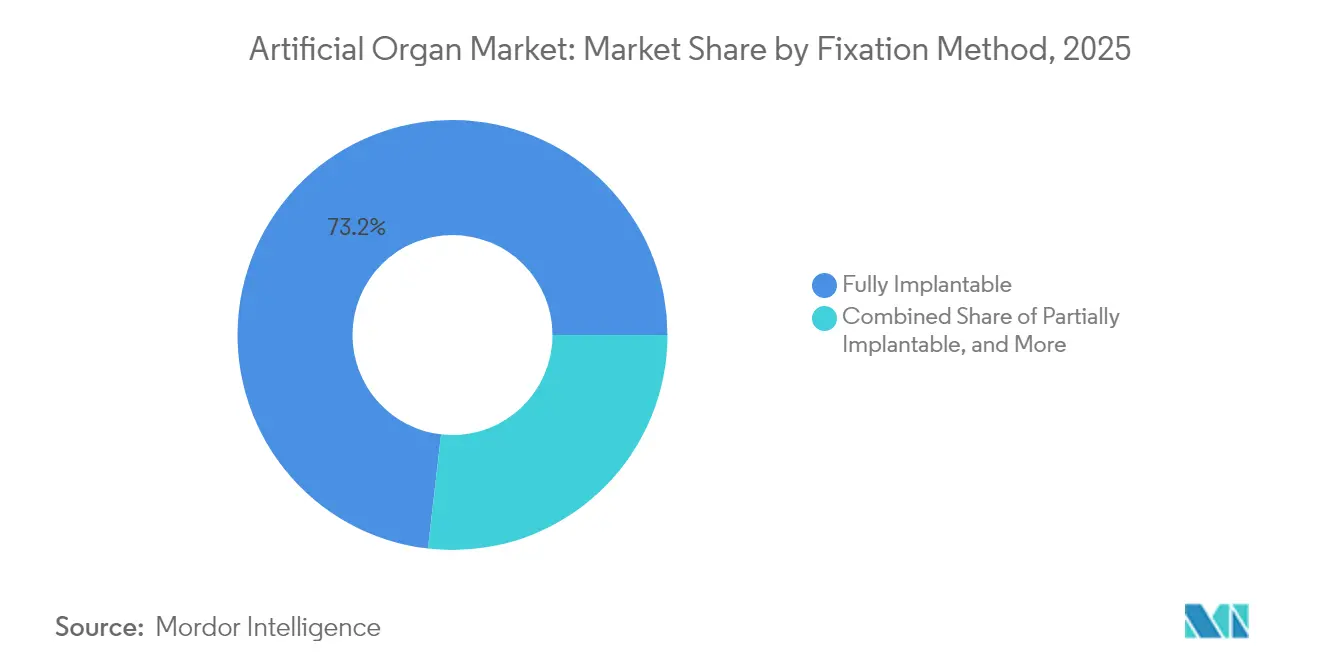
Fully Implantable Devices Predominate While External Solutions Gain MomentumFully implantable systems commanded 73.18% share in 2025 since they lower infection risk and simplify patient routines. Integration of on-board physiologic sensors has improved complication detection, extending in-body dwell time well past five years for several ventricular assist devices. However, the externally worn category is growing at 15.12% CAGR as lightweight power packs and wireless controllers unlock home-care possibilities. For patients ineligible for open-chest surgery, percutaneous devices present a safer bridge-to-transplant path. As wireless energy transfer improves, the artificial organs market is expected to witness convergence between fully implantable and partially external platforms, balancing convenience, longevity and procedural risk.
By End User:
Large Hospitals Lead While Home-care Settings Expand RapidlyHospitals above 300 beds accounted for 67.24% of artificial organs market size in 2025, reflecting their multidisciplinary teams, intensive-care capacity and reimbursement alignment. Complex implants such as total artificial hearts demand surgeons, perfusionists and bioengineers who usually cluster in tertiary centers. That said, the home-care segment is expected to rise at 12.08% CAGR due to cloud-linked monitoring dashboards that alert clinicians to pressure changes, alarm triggers or voltage drops. Smaller community hospitals and ambulatory surgical centers follow suit as plug-and-play components reduce case complexity. In emerging economies, tele-mentoring platforms are helping to bridge skills gaps, giving more institutions a pathway into the artificial organs market.
Geography Analysis
North America Artificial Organ Market
North America held 44.32% of global revenue in 2025, anchored by robust Medicare coverage for life-sustaining devices and a large installed base of dialysis clinics. The United States alone represents 40% of worldwide medical device consumption, with an extensive pipeline of FDA breakthrough-designated implants facilitating faster commercialization. Payer pilots now reimburse remote monitoring on a per-member-per-month basis, encouraging migration from hospital to home.
APAC Artificial Organ Market
Asia-Pacific is the fastest growing region, advancing at a 11.92% CAGR through 2031. China and India are scaling universal health-insurance coverage, and national procurement programs are negotiating bulk prices for dialysis cartridges and ventricular assist devices. Population aging in Japan accelerates cardiac support demand, while South Korea’s well-funded R&D incentives help local firms export miniaturized drive systems. Local manufacturing cuts cost by up to 30%, broadening access and propelling artificial organs market adoption across mid-income segments.
Europe Artificial Organ Market
Europe remains influential, thanks to uniform quality standards under the Medical Device Regulation. Germany and the United Kingdom drive early adoption of bioprosthetic heart valves and long-wear insulin pumps, whereas newer European Society for Organ Transplantation initiatives seek to harmonize advanced-therapy reimbursement. Economic constraints persist, yet coordinated procurement at the EU level is expected to support wider diffusion across Southern and Eastern member states.
MEA and South America Artificial Organ Market
Middle East and Africa plus South America account for a smaller slice of revenue. Uptake is strongest in Saudi Arabia, the United Arab Emirates, Brazil and South Africa, where private networks finance sophisticated implants. Public hospital budgets remain under pressure, but strategic partnerships with multinational device suppliers are improving clinician training and warranty coverage. Over the forecast horizon, multicenter tele-ICU hubs and cross-border service models should narrow the accessibility gap, lifting regional participation in the artificial organs market.

Competitive Landscape
The artificial organs market features a mix of diversified conglomerates and focused specialists. Medtronic, Abbott and Boston Scientific leverage global distribution and multi-product portfolios to negotiate bundled contracts with health systems. Medtronic’s launch of the Avalus Ultra surgical valve in 2024 expanded its cardiac toolkit with a lower profile yet larger effective orifice area, aiding surgeon handling. Abbott’s robotics-assisted HeartMate 3 implant in early 2025 showcased the merger of surgical automation and magnetically levitated pump technology, setting a benchmark for minimally invasive implantation.
Specialists lead radical innovation. CARMAT’s bioprosthetic heart deploys bovine pericardium contact surfaces to limit thrombosis and uses adaptive flow software for physiologic response. BiVACOR refines axial-levitation to reduce shear stress on blood cells, a critical safety differentiator. Start-ups pursuing bioartificial kidney and liver constructs rely on 4D-printed scaffolds seeded with autologous cells, aiming for immunosuppression-free function.
Mergers, licensing and equity partnerships remain common as incumbents seek rapid entry into high-growth sub-niches. Regulatory data exclusivity and patent thickets protect margins, yet payers demand cost justification. Companies therefore bundle analytics dashboards that quantify readmission reduction and therapy adherence, stacking economic evidence in reimbursement dossiers and strengthening positioning within the artificial organs market.
Artificial Organ Industry Leaders
-
Baxter International Inc.
-
Boston Scientific Corporation
-
Getinge AB
-
Medtronic PLC
-
B. Braun Melsungen AG
- *Disclaimer: Major Players sorted in no particular order
Artificial Organ Market Companies Covered in this Report
- Medtronic
- Abbott Laboratories
- Boston Scientific
- Abiomed (Johnson & Johnson MedTech)
- SynCardia Systems
- Berlin Heart
- CARMAT SA
- Jarvik Heart
- BiVACOR Pty Ltd
- Terumo Corp.
- Getinge
- Fresenius Medical Care AG
- AWAK Technologies Pte Ltd
- ALung Technologies Inc.
- Cochlear
- Asahi Kasei
- B. Braun
- Baxter
- Edwards Lifesciences Corp.
- Tandem Diabetes Care
- 3D Systems Healthcare

Market Opportunities and Future Outlook
Home-care and remote monitoring is a whitespace area for artificial organ therapy pathways, as externally worn systems and cloud-linked dashboards shift portions of care outside large tertiary centers while maintaining clinician oversight. This opportunity concentrates around the dominant renal ecosystem (artificial kidney devices held 56.42% share in 2025) and around percutaneous or partially external cardiac and pulmonary support where alarm management, adherence, and early complication detection directly affect outcomes and payer economics.
Beyond established mechanical platforms, development work in vascularized tissue engineering and biohybrid constructs opens a pathway for more functional, longer-duration solutions that address biocompatibility and durability limitations. Recent progress includes MIT work disclosed in July 2026 on more precise fabrication of artificial blood vessels for vascularized tissue engineering, and an April 2026 FDA progress update on reducing animal testing that elevates human-centric methods (such as organoids and organ-on-chip) in preclinical assessment. Together, these shifts create room for device makers and component suppliers to differentiate with validated hemocompatible surfaces, sensor-driven control algorithms, and NAM-aligned evidence packages that can support faster iteration and broader clinical adoption across heart, kidney, pancreas, and lung support categories.
Recent Industry Developments in Artificial Organ Market
- May 2026: Boston Scientific announced a USD 1.5 billion investment for an approximately 34% equity stake in MiRus LLC, along with an exclusive option tied to milestones to acquire the MiRus SIEGEL balloon-expandable transcatheter aortic valve replacement system. The move expands Boston Scientific's structural heart access and strengthens its position in a core artificial heart subsegment (prosthetic heart valves) with differentiated valve platform optionality.
- March 2026: Getinge received CE mark for the Cardiohelp II extracorporeal life support platform. This regulatory step advances Getinge's next-generation life support offering within the artificial lungs/ECMO segment and supports broader hospital adoption where performance, usability, and integration into critical-care workflows drive purchasing decisions.
- April 2026: FDA issued a progress update on reducing animal testing that elevates human-centric methods such as organoids and organ-on-chip in preclinical assessment, signaling a shift in the regulatory landscape that could influence future device development programs.


Artificial Organ Market Report Scope and Research Methodology
Market Definition and Coverage
For this study, the artificial organs market covers revenues from medical devices that replace, support, or restore organ function when the natural organ is failing, and the product is intended for clinical use. The scope includes implantable, partially implantable, and externally connected organ support systems sold into healthcare settings.
Scope exclusions: We exclude routine limb prosthetics, general surgical consumables, and pure biologic grafts or lab-only prototypes that are not commercialized for patient use.
Segments Covered in This Report
-
By Organ Type
-
Artificial Heart
- Prosthetic Heart Valves
- Ventricular Assist Devices
- Cardiac Pacemakers & ICDs
-
Artificial Kidney
- Implantable Devices
- Wearable / Portable Systems
- Artificial Pancreas
- Artificial Lungs/ECMO
- Cochlear & Auditory Brain-stem Implants
- Bio-artificial Liver
- Other Organs (Cornea, Spleen, Bladder, Trachea)
-
Artificial Heart
-
By Technology
- Mechanical
- Electronic / Bionics
- Wearable / Externally Worn
- 3D-Bioprinted Constructs
-
By Fixation Method
- Fully Implantable
- Partially Implantable
- Externally Worn / Percutaneous
-
By End User
- Hospitals (>300 Beds)
- Hospitals (<300 Beds)
- Ambulatory Surgical Centers
- Home-care & Remote Monitoring
-
Geography
-
North America
- United States
- Canada
- Mexico
-
Europe
- Germany
- United Kingdom
- France
- Italy
- Spain
- Rest of Europe
-
Asia-Pacific
- China
- Japan
- India
- South Korea
- Australia
- Rest of Asia-Pacific
-
Middle East and Africa
- GCC
- South Africa
- Rest of Middle East and Africa
-
South America
- Brazil
- Argentina
- Rest of South America
-
North America
Data Sources, Market Sizing, and Validation
Desk Research
Desk work starts by mapping the clinical demand pool and the product boundaries, then aligning that pool with what is measurable in public data. We typically use the World Health Organization for disease burden context, the World Bank for macro and health spend signals, and the OECD for health system indicators in major countries.
To ground volumes and adoption logic, we also reference the US FDA device databases and safety communications, the US CDC for chronic disease and dialysis related indicators, and peer reviewed journals that report procedure volumes and outcomes. Company annual reports, investor presentations, and reputable press help confirm device launches, pricing direction, and capacity expansions, while paid subscriptions for company financials and patent databases are used selectively when public disclosures are limited. The sources listed here are illustrative, and additional public and paid references were used for data collection, validation, and clarification.
Primary Interviews and Surveys
Primary work focused on confirming what is truly purchased and reimbursed in hospitals and specialty centers, and how adoption differs by organ type and care pathway. We spoke with a mix of clinicians, procurement stakeholders, distributors, and product or strategy leaders to pressure test pricing ranges, utilization, replacement cycles, and near-term constraints across major regions. We then used that input to tighten assumptions that were weaker in public sources.
Distribution of primary research fieldwork respondents
| Company type | Respondent position | Region |
|---|---|---|
| Top tier: 34% | CXOs: 19% | APAC: 38% |
| Mid tier: 46% | Functional/Unit leaders: 27% | EMEA: 36% |
| Smaller Players: 20% | Managers: 54% | Americas: 26% |
Market-Sizing & Forecasting
Sizing was built using a top-down approach, reconstructing the treated demand pool from organ failure and chronic disease prevalence, procedure volumes, and therapy penetration, then applying typical device pricing and replacement cadence to arrive at revenue values. We checked totals with selective bottom-up approximations, including sampled ASP times volume builds for key device categories and channel checks on where utilization is concentrated, and we adjusted the model when interviews repeatedly flagged gaps.
Inputs used in the model include dialysis and end stage renal disease indicators, cardiac surgery and valve replacement procedure trends, ventricular assist device implantation patterns, transplant waitlist pressure as an adoption signal, and reimbursement coverage direction in major countries. When country-level data was missing, we used regional proxy ratios tied to healthcare spend and treatment access, then validated those ratios through expert feedback. Forecasts were produced using scenario analysis supported by trend smoothing on procedure growth and pricing progression, followed by a consistency check against expected regulatory clearances and capacity expansions described by respondents.
Data Validation & Update Cycle
Validation is done by comparing model outputs with independent signals, such as procedure counts, reported device shipment commentary in public filings, and country-level healthcare spend direction, so the final number does not rely on a single indicator. When large variances show up by region or organ type, assumptions are re-checked, and respondents are re-contacted if the variance cannot be explained by access, reimbursement, or pricing differences.
Before sign-off, the work goes through multi-step internal review where another analyst challenges the scope mapping, key inputs, and conversion logic, then the model is rerun with corrected assumptions where needed. Reports are refreshed annually, and interim updates are made when material events occur, such as a major regulatory approval, a safety issue, or a reimbursement change. Right before delivery, a final pass is performed so the output reflects the most current view available.
Mordor Intelligence's Global Artificial Organs Market Market Size Versus Other Published Estimates
Published market sizes for artificial organs often differ because the included device set is not consistent, and because some studies anchor their math on different years, currencies, or pricing logic. Differences also come from how aggressively adoption is assumed to rise for newer systems, particularly where reimbursement and trained clinician capacity are still catching up.
A common gap driver is whether bionics and broader implantable electronics are bundled with artificial organs, which can inflate totals even if the clinical use cases overlap only partially. Another driver is the treatment of externally connected organ support circuits and wearable systems, since some estimates count them mainly in acute care, while others spread them across longer duration therapy assumptions. The spread also reflects how procedure growth is projected, since a single high growth scenario can move the 1 year market size noticeably when ASPs are updated too quickly or not tied back to payer coverage.
Benchmark comparison
| Source | Market Size | Gaps in Research Methodology |
|---|---|---|
| Mordor Intelligence | USD 33.52 B (2026) | |
| Global Consultancy A | USD 31.89 B (2024) | Uses an earlier base year and a different short-term adoption curve, and the public description provides less detail on how ASP updates and replacement cycles are normalized across organ categories. |
| Industry Publisher B | USD 41.15 B (2024) | Combines artificial organs with bionics and related implant categories, which broadens the revenue pool, and it also applies a faster growth profile that can raise the implied current-year total. |
The table shows that the biggest swings come from scope and year alignment, followed by how pricing and utilization are carried forward. When bionics revenues are kept separate and externally connected support systems are counted only where they are commercially used in patient care, the estimate stays tighter, which is the scope choice applied by Mordor Intelligence.


Key Questions Answered in the Report
What is the current size of the artificial organs market?
The artificial organs market stands at USD 33.52 billion in 2026 and is projected to reach USD 49.67 billion by 2031.
Which organ segment holds the largest artificial organs market share?
Artificial kidney devices led with 56.42% share in 2025, reflecting the heavy burden of chronic kidney disease.
Which region is growing fastest in the artificial organs market?
Asia-Pacific is advancing at a 11.92% CAGR through 2031 due to expanding healthcare access and rising chronic-disease prevalence.
How are home-care models influencing demand?
Externally worn and remotely monitored devices are growing at 15.12% CAGR as payers and patients favor therapies that reduce hospital stays.
What are the key barriers to wider adoption of artificial organs?
High upfront device costs, limited reimbursement pathways and lingering biocompatibility challenges constrain uptake, especially in emerging markets.
Which companies are leading innovation in artificial hearts?
CARMAT and BiVACOR are notable for bioprosthetic surfaces and magnetically levitated pumps that aim to improve hemocompatibility and durability.
Page last updated on:





