Market Overview
| Study Period | 2020 - 2031 |
|---|---|
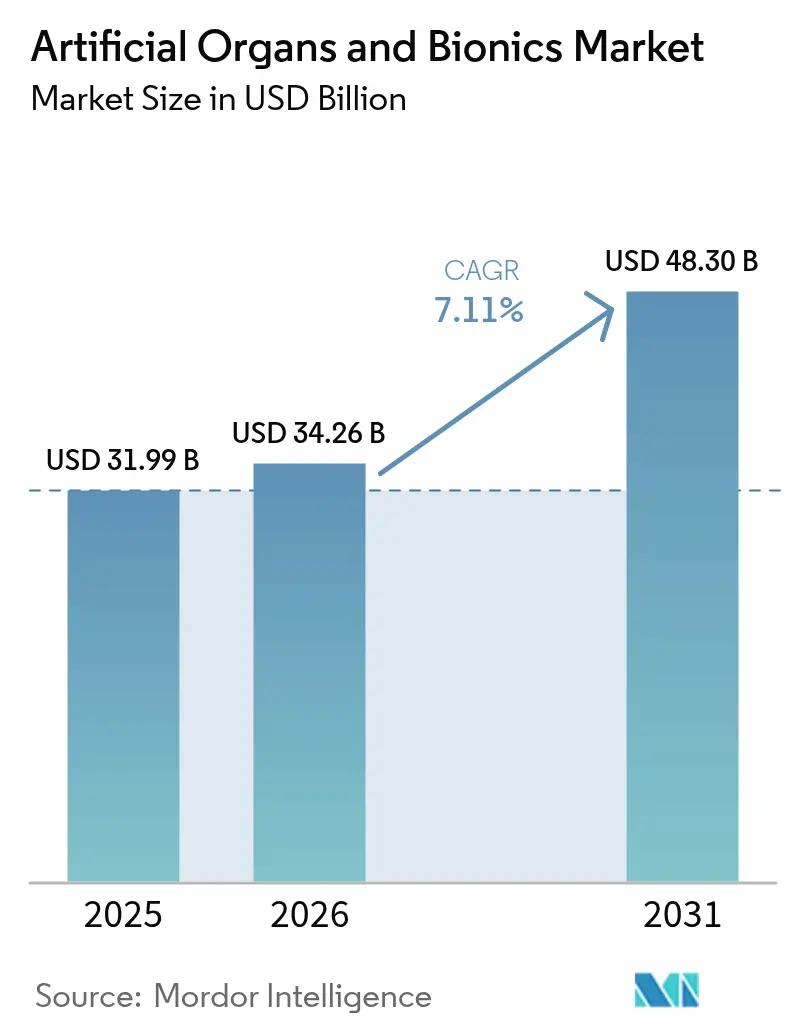
| Market Size (2026) | USD 34.26 Billion |
| Market Size (2031) | USD 48.3 Billion |
| Growth Rate (2026 - 2031) | 7.11% CAGR |
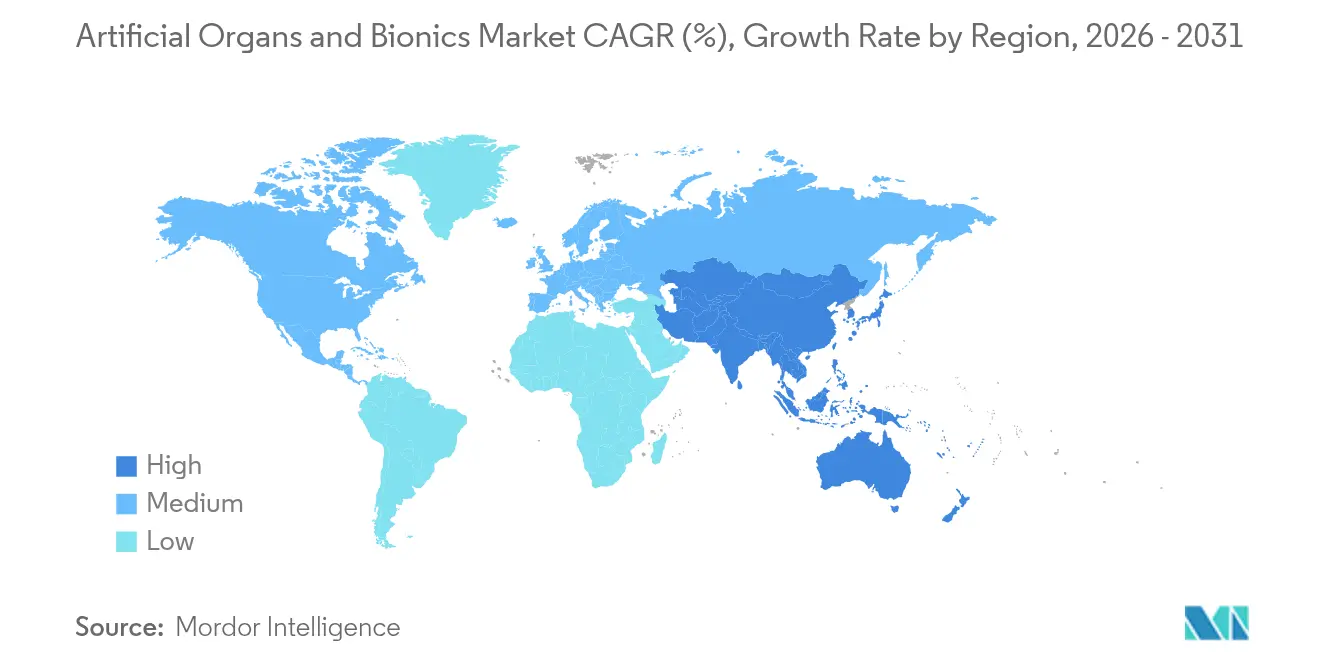
| Fastest Growing Market | Asia Pacific |
| Largest Market | North America |
| Market Concentration | Medium |
Major Players *Disclaimer: Major Players sorted in no particular order Image © Mordor Intelligence. Reuse requires attribution under CC BY 4.0. | |
Artificial Organs And Bionics Market Analysis by Mordor Intelligence
Artificial organs and bionics market size in 2026 is estimated at USD 34.26 billion, growing from 2025 value of USD 31.99 billion with 2031 projections showing USD 48.3 billion, growing at 7.11% CAGR over 2026-2031. Size expansion is being shaped by converging breakthroughs in biomaterials, miniaturized electronics, and 3-D bioprinting, all of which compress development timelines and lift clinical adoption of cardiovascular, renal, and neuro-prosthetic devices. Stretched transplant waiting lists and fast-track regulatory programs are spurring investment in total artificial hearts, wearable artificial kidneys, and next-generation brain–computer interfaces. Defense-funded limb-restoration programs have unlocked neural-interface know-how that is flowing into civilian solutions, while insurers’ gradual acceptance of home-based bionic therapies broadens the treated population. Supply-chain fragilities surrounding rare-earth sensors and high-end chips remain a watchpoint, yet growing regional manufacturing footprints in Asia-Pacific are easing part of that exposure.
Key Report Takeaways
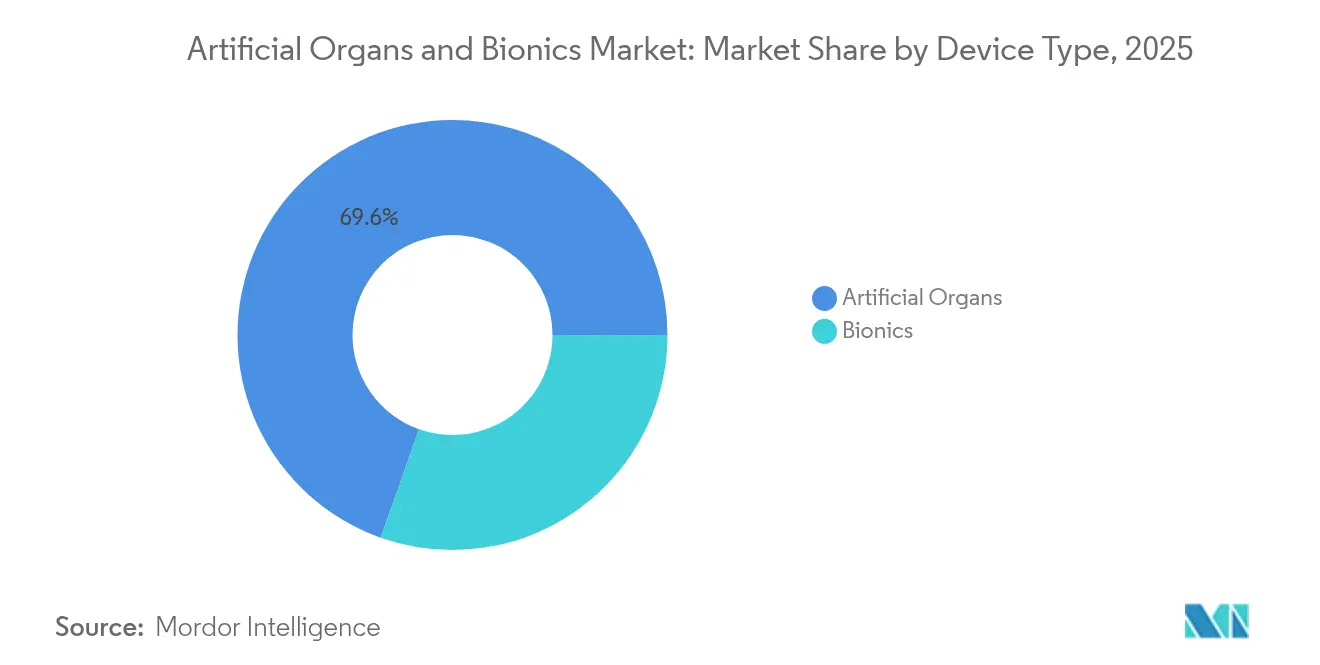
- By device type, artificial organs led with 69.58% revenue share in 2025; bionics is projected to expand at an 8.05% CAGR to 2031.
- By technology, wearable and extracorporeal systems held 54.71% of the artificial organs and bionics market share in 2025, while implantable systems are slated for the highest CAGR at 9.10% through 2031.
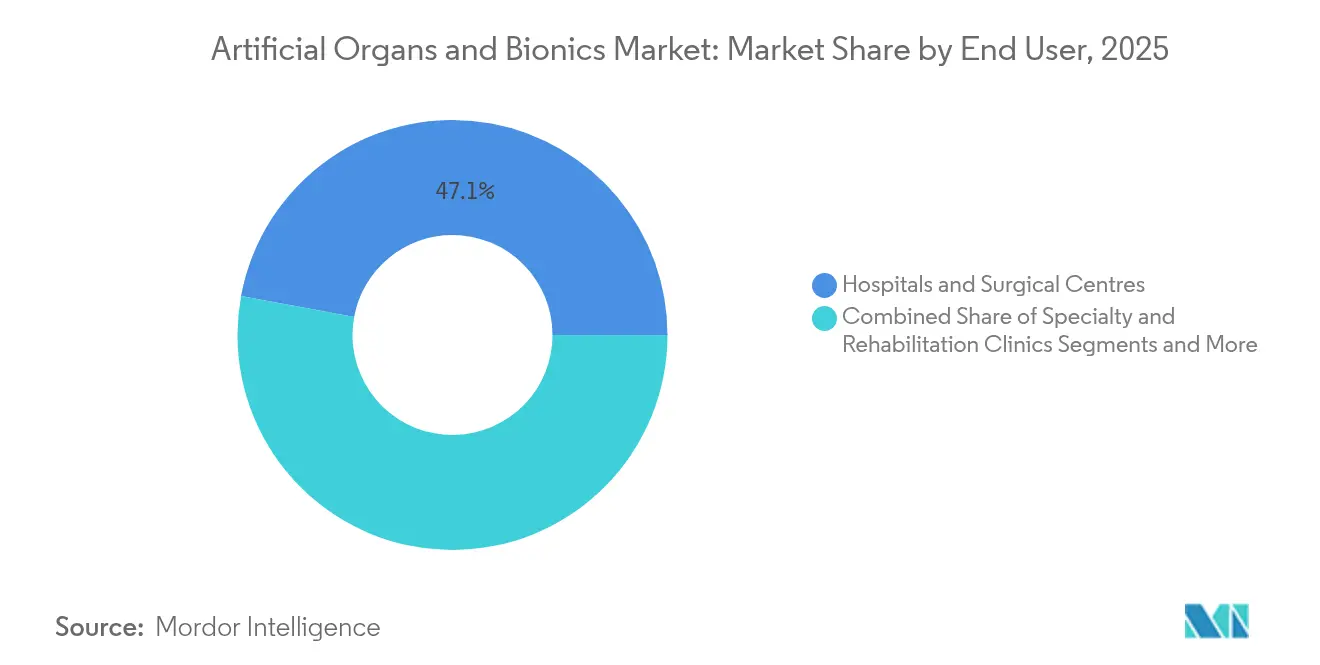
- By end user, hospitals and surgical centers accounted for 47.10% of the artificial organs and bionics market size in 2025, whereas home-care and ambulatory settings are growing at 9.05% CAGR during 2026-2031.
- By geography, North America retained 38.25% share of the artificial organs and bionics market in 2025, while Asia-Pacific is forecast to register the fastest regional CAGR at 10.30% to 2031.
Note: Market size and forecast figures in this report are generated using Mordor Intelligence’s proprietary estimation framework, updated with the latest available data and insights as of 2026.
Global Artificial Organs And Bionics Market Trends and Insights
Drivers Impact Analysis*
| Driver | (~) % Impact on CAGR Forecast | Geographic Relevance | Impact Timeline |
|---|---|---|---|
| Rapid biomaterial, micro-electronics & 3-D bio-printing advances | +2.1% | North America, Europe, core APAC | Medium term (2-4 years) |
| Rising incidence of chronic organ failure & disabilities | +1.8% | Global, concentrated in North America & Europe | Long term (≥ 4 years) |
| Scarcity of donor organs | +1.5% | Global, acute in developed markets | Medium term (2-4 years) |
| Fast-track regulatory pathways | +1.2% | North America & EU, expanding to APAC | Short term (≤ 2 years) |
| Defence-funded limb-restoration programmes | +0.9% | North America and allied nations | Short term (≤ 2 years) |
| Source: Mordor Intelligence | |||
Rising Incidence of Chronic Organ Failure & Disabilities
Degenerative ailments are swelling the addressable pool for cardiac assist devices, renal replacements, and neuro-prosthetics. Cardiovascular disease affects 49 million people in the EU, energising demand for mechanical circulatory support systems. Japan’s insulin-producing iPS-cell trials underscore momentum behind a bioartificial pancreas for 139,000 local type 1 diabetes patients. Ageing populations translate into rising stroke-related motor deficits, setting the stage for brain–computer interfaces that restore communication and mobility. The U.S. Department of Veterans Affairs is backing 25 prosthetics-oriented projects in FY 2025, signalling continuing long-term demand.
Scarcity of Donor Organs
More than 103,000 Americans wait for transplants; in Japan, fewer than 3% of organ-failure patients receive brain-dead donations, reinforcing demand for alternatives. FDA-sanctioned pig-organ trials in 2025 are emblematic of the shift toward xenotransplantation. Bridge-to-transplant devices such as the Carmat Aeson artificial heart have kept 30 European patients alive for an average of 156 days. China’s 45-gram pediatric artificial heart answers an acute need in children’s cardiac support.
Rapid Biomaterial, Micro-Electronics & 3-D Bio-Printing Advances
Stanford teams have grown vascularised heart and liver organoids, a step toward size-appropriate constructs for human use[1]Patrick Monahan, “Stanford Scientists Grow Vascularized Heart and Liver Organoids,” med.stanford.edu. 3-D-bioprinted livers transplanted into mice achieved 90% survival, validating the concept of printed human grafts. Brain–computer interface studies restored real-time speech in ALS patients. Hydrogel surface chemistries are damping inflammatory reactions, lengthening implant lifespans. Soft-robotic hearts model natural contraction patterns, trimming thrombosis risk.
Defence-Funded Limb-Restoration Programmes (Post-2024)
The U.S. Department of Defense earmarked USD 141 billion for RDT&E in FY 2025, funnelling capital into neural interfaces and high-durability prosthetics. DARPA runs four active bionics initiatives targeting electrode arrays and cybernetic limbs. The Defence Health Agency catalogued 120 medical AI use-cases, many focused on remote monitoring for advanced prostheses. Military performance specifications are fast-tracking ruggedised, lightweight materials that later enter civilian supply chains.
Restraints Impact Analysis*
| Restraint | (~) % Impact on CAGR Forecast | Geographic Relevance | Impact Timeline |
|---|---|---|---|
| High procedure & device cost | -1.4% | Global, acute in emerging markets | Medium term (2-4 years) |
| Biocompatibility issues & device malfunctions | -0.8% | Global, regulatory spotlight in North America & EU | Short term (≤ 2 years) |
| Supply-chain fragility of rare-earth sensors & chips | -0.6% | Global, concentrated impact in APAC manufacturing | Short term (≤ 2 years) |
| Source: Mordor Intelligence | |||
High Procedure & Device Cost
Robotic knees can reach USD 51,000, and private insurers often cap prosthetic reimbursement, leaving patients exposed to six-figure out-of-pocket bills. Colorado’s Medicare-parity law illustrates patchy progress on coverage mandates. Total artificial heart therapy, including surgery and follow-up, can surpass USD 500,000 per person, restricting uptake to high-resource centers. The cost barrier is sharper in emerging markets, where reimbursement rates lag device prices.
Biocompatibility Issues & Device Malfunctions
Thrombotic complications continue to challenge mechanical circulatory devices despite anticoagulation regimens. A pig-kidney xenograft failed after four months, highlighting lingering immunological hurdles. FDA warnings on systemic reactions to certain metal implants have compelled redesigns of joint and cardiovascular devices. Scar tissue around electrode arrays degrades signal fidelity, prompting ultra-soft polymer research.
*Our forecasts treat driver/restraint impacts as directional, not additive. The impact forecasts reflect baseline growth, mix effects, and variable interactions.
Segment Analysis
By Device Type: Artificial Organs Lead Despite Bionic Acceleration
Artificial organs commanded 69.58% of the artificial organs and bionics market in 2025 as transplant shortages sustained demand for ventricular assist devices and emerging bioartificial kidneys. Bionics is tracking an 8.05% CAGR to 2031, aided by miniaturised brain-computer interfaces that now facilitate speech and fine-motor control. The artificial organs and bionics market size for heart devices alone is projected to expand at 7.52% CAGR, supported by FDA breakthrough tags for titanium total artificial hearts.
Clinical momentum is evident in renal assist systems where Roivios obtained breakthrough designation and is preparing U.S. pivotal trials. Bio-printed liver constructs and gene-edited pig livers are progressing through early-phase studies, signalling pipeline depth. Neuro-bionics growth is amplified by AI-driven control algorithms that adapt in milliseconds to user intent. Collectively, these innovations anchor long-term revenue visibility across the artificial organs and bionics market.


By Technology: Implantable Systems Gain Ground Through Innovation
Wearable and extracorporeal platforms held 54.71% share in 2025, yet implantables are climbing faster at 9.10% CAGR as biocompatible polymers, rechargeable batteries, and thin-film electronics enable long-term in-body operation. Cochlear-implant pioneers have demonstrated totally implantable devices that obviate external microphones, strengthening the artificial organs and bionics market proposition for discreet therapies.
Leadless pacemakers such as Abbott’s AVEIR DR have shown 98.3% implantation success, reinforcing physician confidence. Externally, AI-enhanced hearing aids can now distinguish speech from 50 dB of background noise, extending wearable device relevance. Integration of wireless charging with fully implanted LVADs removes percutaneous cables, reducing infection risk and improving quality of life. Such cross-pollination of ideas keeps investment flowing into the artificial organs and bionics market.
By End User: Home-Care Transformation Drives Growth
Hospitals held 47.10% share in 2025, yet home-care and ambulatory settings are projected to expand at 9.05% CAGR as device makers embed Bluetooth Low-Energy chips, cloud analytics, and AI-driven alerts. The artificial organs and bionics market size for outpatient channels is expected to surpass USD 10.73 billion by 2031, underpinned by reimbursement reforms that now cover remote programming of cochlear implants and pacemakers.
The Department of Veterans Affairs is piloting portable exoskeletons that users calibrate via smartphone, demonstrating how remote monitoring shortens inpatient rehab. Private clinics such as Open Bionics service centers support custom socket fitting and firmware updates, reinforcing a distributed care model. Advances in wireless power transfer and cloud-based dashboards are therefore re-shaping utilisation patterns across the artificial organs and bionics market.
Geography Analysis
North America retained 38.25% share of the artificial organs and bionics market in 2025 on the back of an established FDA fast-track framework and robust venture funding. Investors topped USD 2 billion in disclosed U.S. deals during 2024, half of which went to cardiac and neuro-prosthesis start-ups. The region’s mature reimbursement infrastructure continues to favour early adoption, yet price sensitivity is rising as payers scrutinise cost-effectiveness.
Asia-Pacific is the fastest-growing region with a 10.30% CAGR, catalysed by Japan’s universal artificial blood that maintains two-year shelf life across all blood types. China’s triple-integrated brain-spine interface enabled paraplegic patients to regain over-ground walking within weeks, positioning domestic players at the cutting edge of neuro-prosthetics. Pediatric device innovation is also notable: a 45-gram artificial heart designed for small children filled a vital niche, reinforcing regional clinical leadership.
Europe sustains a technology leadership role through companies such as Carmat, whose Aeson artificial heart received CE marking as a bridge-to-transplant therapy. German transplant centres reported the first fully implantable artificial-heart discharge to home care, broadening real-world validation. Parallel initiatives in organ-preservation perfusion systems further tighten the supply-demand gap for donor organs, keeping Europe firmly inside the high-innovation quadrant of the artificial organs and bionics market.

Competitive Landscape
The artificial organs and bionics market is moderately fragmented: the top five firms hold a significant revenue, leaving room for nimble specialists. Johnson & Johnson’s USD 16.6 billion take-over of Abiomed underscores the strategic value of proven cardiac platforms. BD’s USD 4.2 billion acquisition of Edwards’ Critical Care unit and Teleflex’s EUR 760 million (USD 878.2 million) purchase of BIOTRONIK’s vascular assets illustrate ongoing portfolio concentration.
Challenger brands are scaling quickly. BiVACOR secured USD 13 million to advance its lightweight titanium artificial heart that delivers pulsatile flow using a magnetically levitated rotor. Synchron’s endovascular brain-computer interface circumvents open-brain surgery, earning FDA investigational-device exemption and fostering differentiation on safety. eGenesis is moving 10-gene-edited pig organs into first-in-human trials after promising non-human primate data, widening competitive parameters.
Incumbents maintain an edge in scale manufacturing and regulatory know-how, yet smaller innovators exploit agility to capture niches such as pediatric hearts and fully implantable cochlear systems. AI-powered hearing aids, augmented-AI exoskeletons, and next-generation wireless LVADs exemplify how software capabilities now shape hardware leadership across the artificial organs and bionics market.
Artificial Organs And Bionics Industry Leaders
Abiomed Inc
Boston Scientific Corporation
Ossur
Baxter International
Medtronic plc
- *Disclaimer: Major Players sorted in no particular order


Recent Industry Developments
- May 2025: OrganOx raised new funding from Intuitive Ventures and Terumo Ventures to expand its normothermic liver perfusion platform, now used in more than 5,000 transplant procedures.
- March 2025: BiVACOR reported a patient surviving 105 days on its titanium total artificial heart before receiving a donor organ, setting a durability record for the technology.
- February 2025: Abbott obtained CE Mark for AVEIR DR, the first dual-chamber leadless pacemaker system.


Research Methodology Framework and Report Scope
Market Definitions and Key Coverage
Our study defines the global artificial organs and bionics market as the aggregate revenue generated by implantable or extracorporeal mechanical devices that wholly or partly replace the function of a failed human organ or limb, together with electronically assisted bionic systems that restore hearing, vision, or movement.
Scope exclusion: xenotransplant solutions, purely biologic tissue-engineered grafts, and simple orthopedic implants are outside this market's boundary.
Segmentation Overview
- By Device Type
- Artificial Organs
- Artificial Heart
- Artificial Kidney
- Artificial Lungs
- Artificial Liver
- Artificial Pancreas
- Others
- Bionics
- Vision Bionics
- Ear Bionics
- Orthopedic Bionics
- Cardiac Bionics
- Neural Bionics
- Artificial Organs
- By Technology
- Implantable Devices
- Wearable / Extracorporeal Devices
- By End User
- Hospitals & Surgical Centres
- Specialty & Rehabilitation Clinics
- Home-care & Ambulatory Settings
- Military & Veterans Care Systems
- Geography
- North America
- United States
- Canada
- Mexico
- Europe
- Germany
- United Kingdom
- France
- Italy
- Spain
- Rest of Europe
- Asia-Pacific
- China
- Japan
- India
- South Korea
- Australia
- Rest of Asia-Pacific
- Middle East and Africa
- GCC
- South Africa
- Rest of Middle East and Africa
- South America
- Brazil
- Argentina
- Rest of South America
- North America
Detailed Research Methodology and Data Validation
Primary Research
We held structured interviews with transplant surgeons, nephrology and audiology heads, prosthetist-orthotist leads, and procurement managers across North America, Europe, and Asia-Pacific. Their insights validated device utilization rates, typical replacement cycles, reimbursement shifts, and regional ASP dispersion, filling gaps that secondary data could not resolve.
Desk Research
Mordor analysts first mapped demand fundamentals using open sources such as WHO Global Health Observatory, UNOS transplant wait-list statistics, Eurostat hospitalization data, and peer-reviewed journals covering dialysis prevalence and limb-loss epidemiology. Trade-association bulletins (e.g., International Federation of Artificial Organs), company 10-Ks, and vetted press releases supplied recent shipment volumes and average selling prices. For richer financials and competitive moves, we accessed D&B Hoovers, Dow Jones Factiva, and Questel patent families that signal pipeline intensity. This desk work framed the universe of qualifying devices and their installed base. The sources cited are illustrative; many additional public and subscription materials were reviewed to cross-check figures and definitions.
Market-Sizing & Forecasting
A top-down demand pool was built from treated-patient cohorts (renal replacement therapy, heart-assist, major limb amputees) and procedure volumes, which are then multiplied by calibrated penetration and upgrade factors. Supplier roll-ups and sampled ASP × unit checks provided a selective bottom-up lens to fine-tune totals. Key model variables include dialysis population growth, ventricular-assist implant counts, cochlear implant waiting times, device life expectancy, and reimbursement parity trends. Forecasts employ multivariate regression blended with scenario analysis to reflect technology maturation and donor-shortage policy drives; assumptions are stress-tested with field experts before lock-in. Where bottom-up inputs were sparse, regional averages were imputed using nearest-neighbor benchmarks and flagged for review.
Data Validation & Update Cycle
Outputs pass a three-step variance screen, anomaly logs are resolved through analyst peer review, and figures are reconciled with external health-system metrics before sign-off. We refresh the dataset annually and trigger interim updates for material events such as pivotal FDA approvals or reimbursement resets, ensuring clients receive the latest calibrated view.
Why Mordor's Artificial Organs and Bionics Baseline Commands Reliability
Published numbers often diverge because firms differ in device inclusion, base-year currency, and how they treat hospital service revenue.
Key gap drivers here include: some publishers bundle tissue-engineering revenue; others convert at fixed 2022 dollars or apply aggressive uptake curves for still-experimental implants. Mordor reports only commercially cleared devices, uses rolling-average exchange rates, and applies conservative penetration ramps vetted each quarter.
Benchmark comparison
| Market Size | Anonymized source | Primary gap driver |
|---|---|---|
| USD 31.99 B (2025) | Mordor Intelligence | - |
| USD 44.98 B (2025) | Global Consultancy A | Includes tissue-engineered grafts and rehabilitation services |
| USD 38.0 B (2024) | Industry Journal B | Uses broader product mix and constant-2020 FX rates |
In sum, Mordor's disciplined scope, dual-lens modeling, and continuous refresh give decision-makers a balanced, transparent baseline that is traceable to clear variables and repeatable steps.


Key Questions Answered in the Report
What is the projected value of the artificial organs and bionics market by 2031?
The market is expected to reach USD 48.3 billion in 2031 on a 7.11% CAGR trajectory.
Which segment currently dominates the artificial organs and bionics market?
Artificial organs lead with 69.58% device-type share, driven by critical demand in cardiac and renal support.
Why is Asia-Pacific the fastest-growing regional market?
Breakthroughs such as Japan’s universal artificial blood and China’s brain-spine interfaces, combined with rising healthcare investment, propel a 10.30% CAGR through 2031.
How are implantable systems gaining traction over wearable devices?
Advances in biocompatible materials, wireless charging, and miniaturised electronics enable fully internalised solutions that are growing at 9.10% CAGR.
What are the main challenges limiting broader adoption?
High procedure costs, biocompatibility hurdles, and supply-chain dependence on rare-earth sensors continue to temper growth despite strong technology momentum.
Which recent regulatory milestone could reshape the competitive landscape?
The FDA’s approval of first-in-human trials for gene-edited pig organs signals a potential long-range solution to organ scarcity and a new competitive frontier.
Page last updated on:


